
Programmed death ligand-1 expression on donor T cells drives graft-versus-host disease lethality

Asim Saha et al. J Clin Invest. .

Abstract

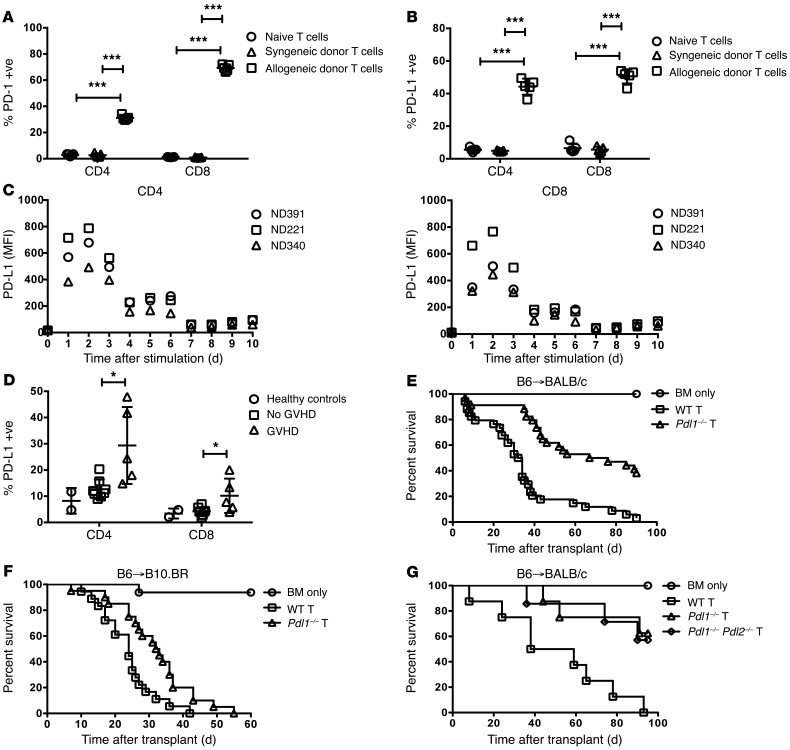
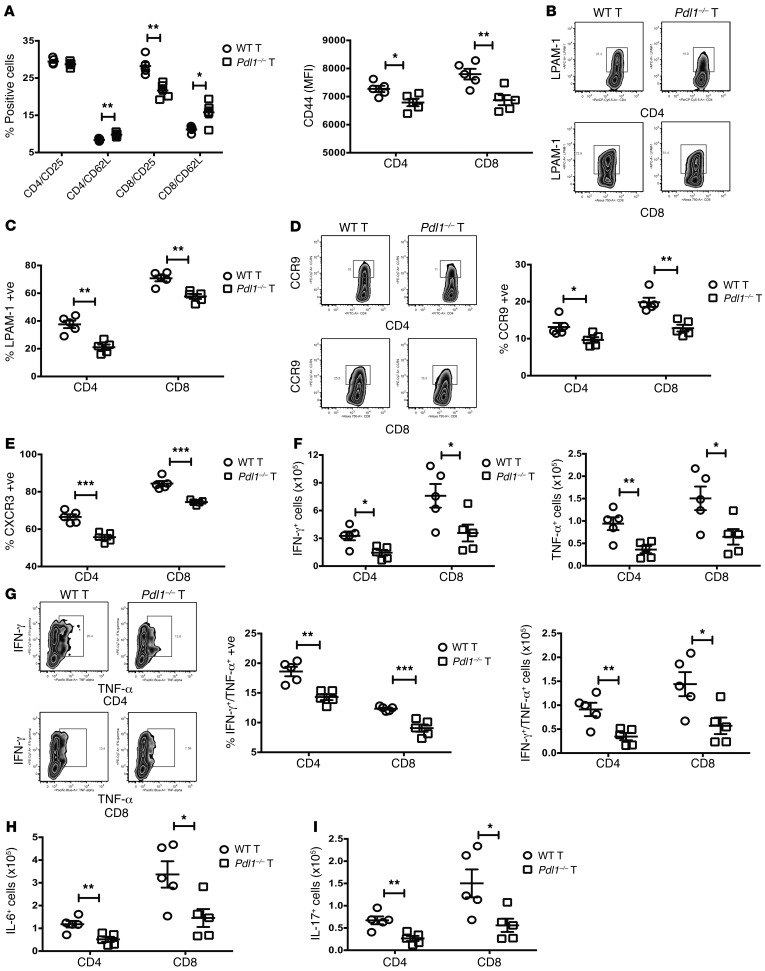
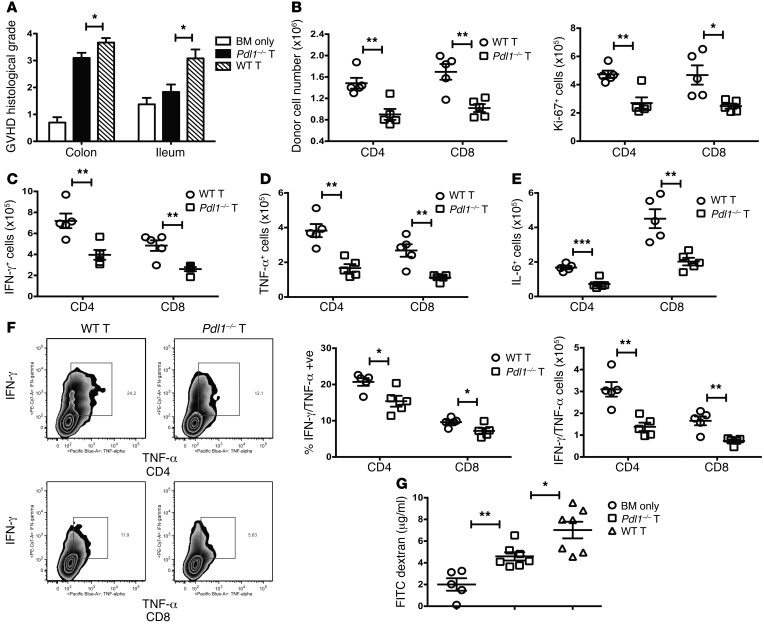
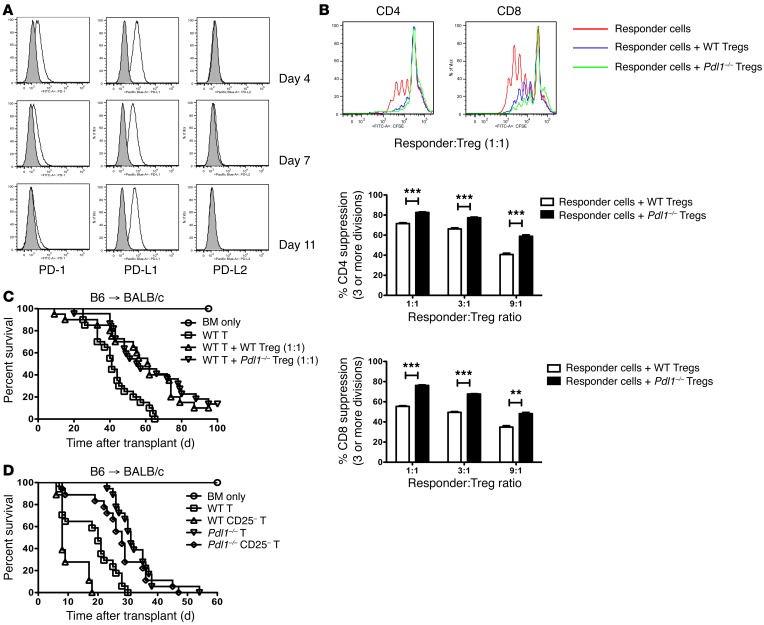
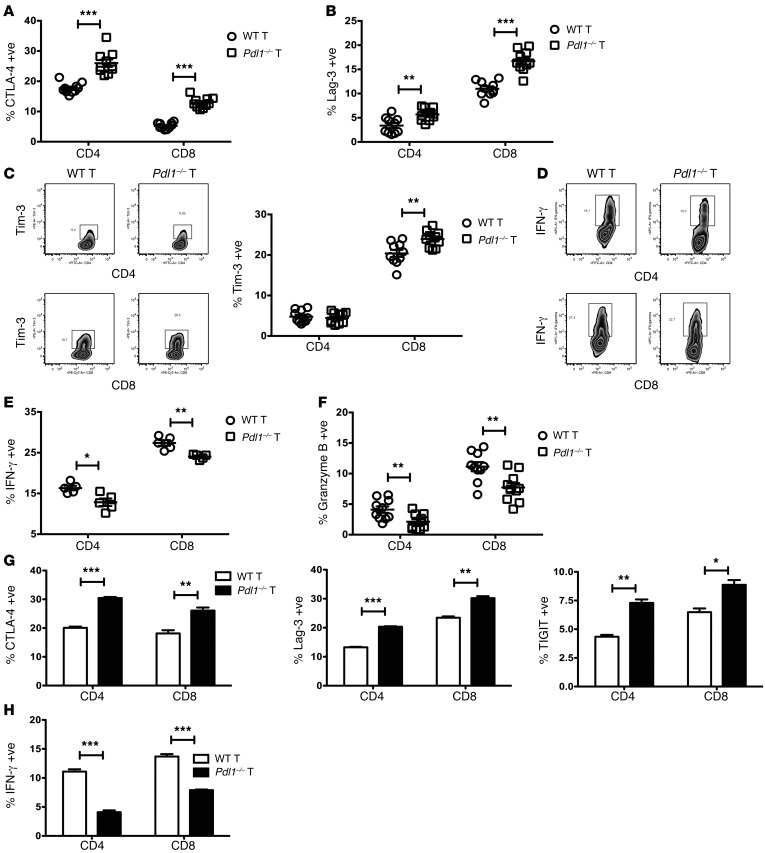
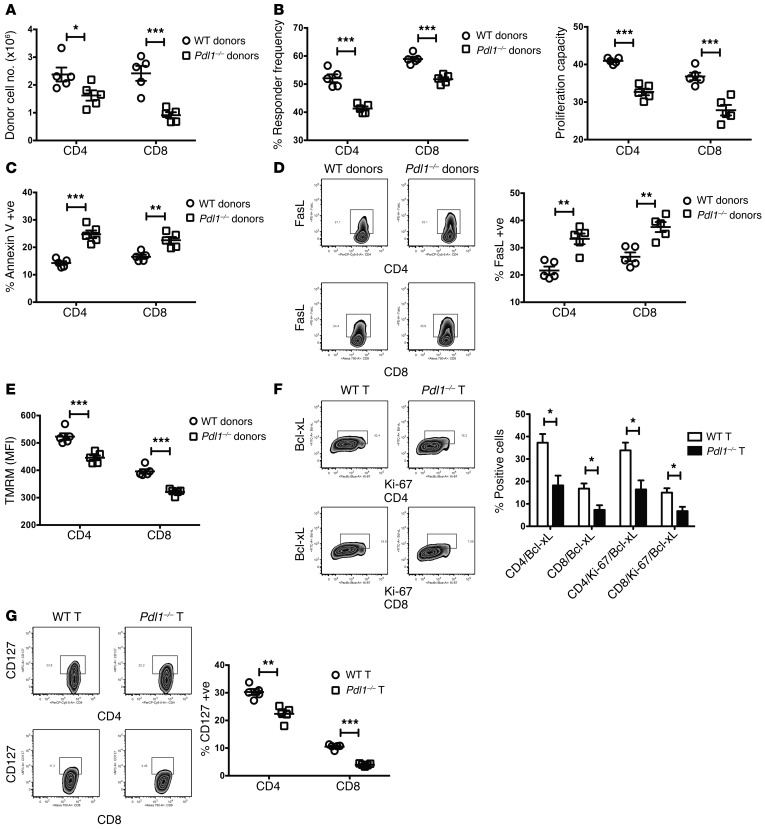
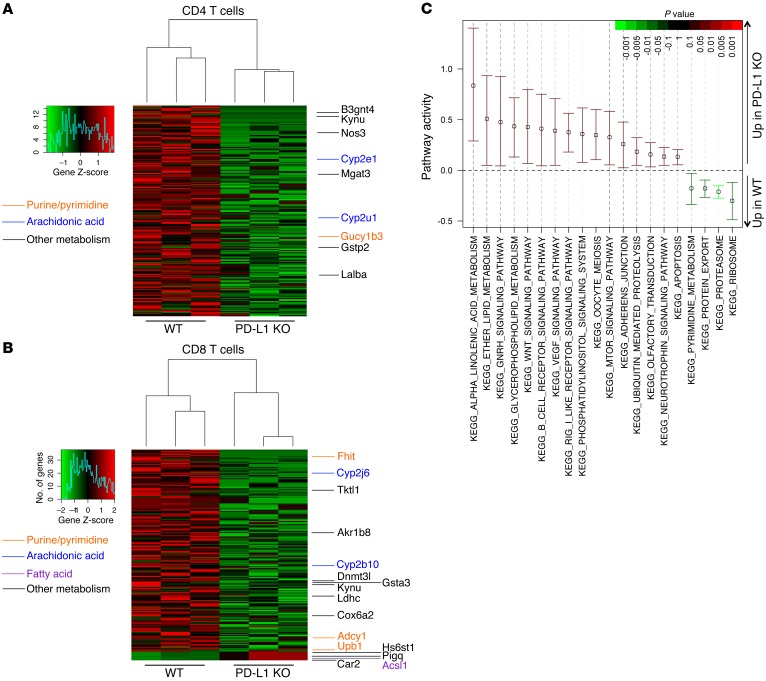
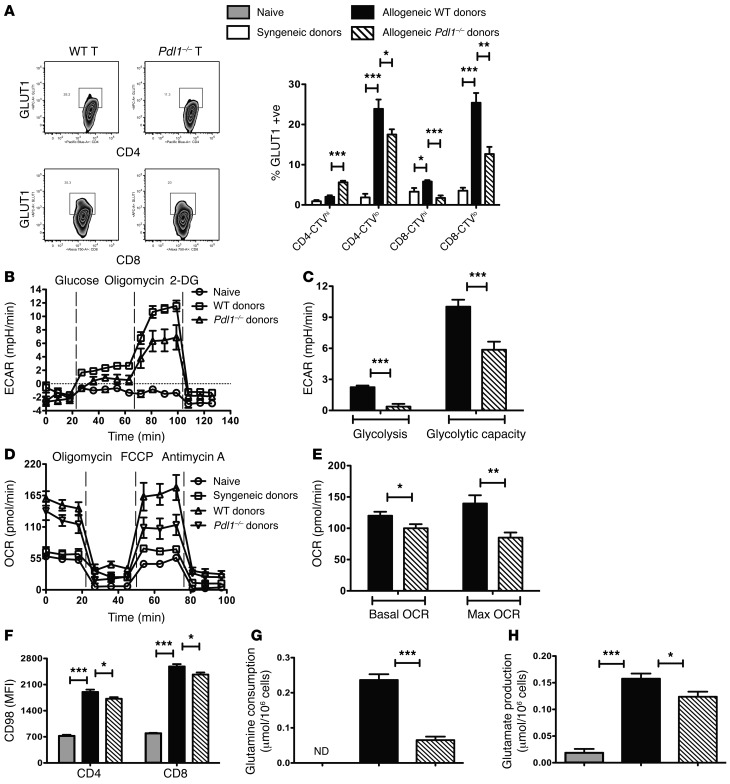
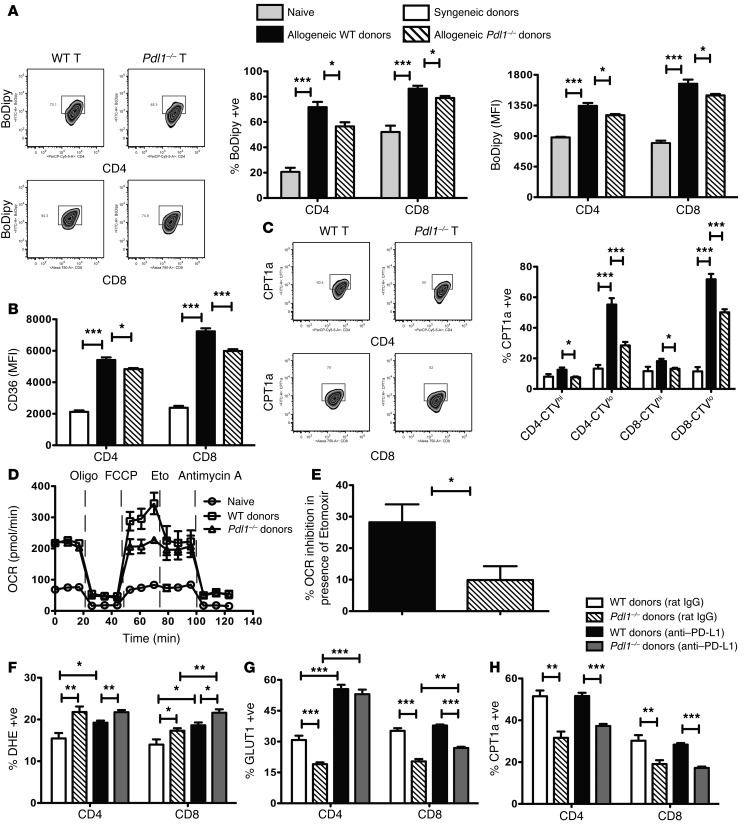
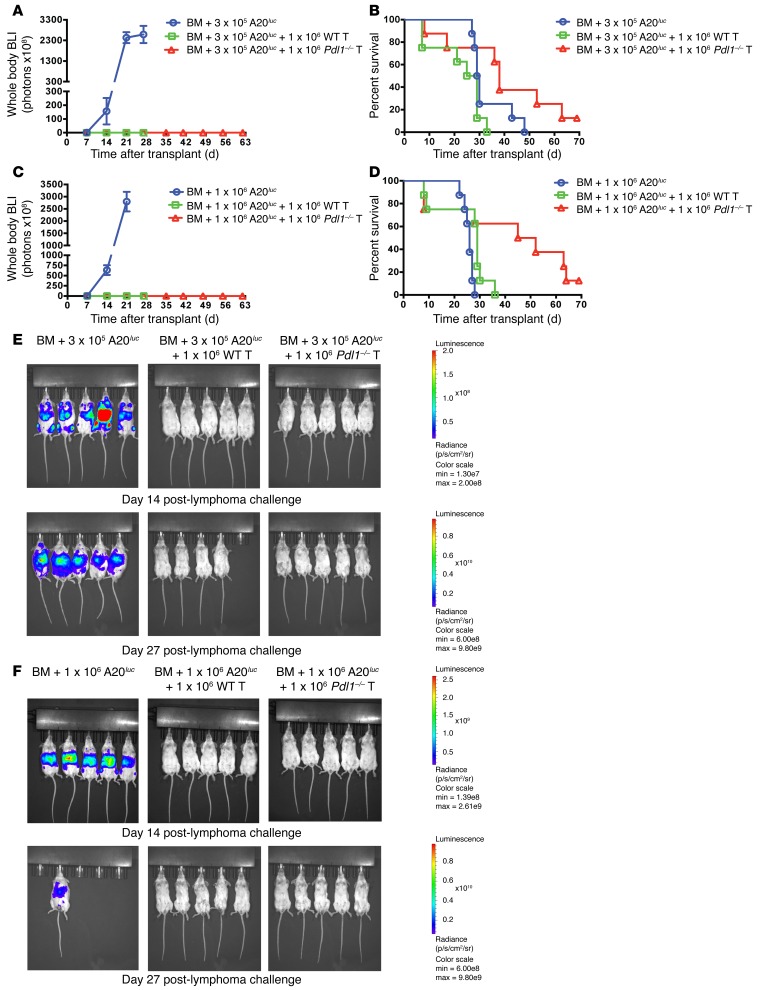
Programmed death ligand-1 (PD-L1) interaction with PD-1 induces T cell exhaustion and is a therapeutic target to enhance immune responses against cancer and chronic infections. In murine bone marrow transplant models, PD-L1 expression on host target tissues reduces the incidence of graft-versus-host disease (GVHD). PD-L1 is also expressed on T cells; however, it is unclear whether PD-L1 on this population influences immune function. Here, we examined the effects of PD-L1 modulation of T cell function in GVHD. In patients with severe GVHD, PD-L1 expression was increased on donor T cells. Compared with mice that received WT T cells, GVHD was reduced in animals that received T cells from Pdl1-/- donors. PD-L1-deficient T cells had reduced expression of gut homing receptors, diminished production of inflammatory cytokines, and enhanced rates of apoptosis. Moreover, multiple bioenergetic pathways, including aerobic glycolysis, oxidative phosphorylation, and fatty acid metabolism, were also reduced in T cells lacking PD-L1. Finally, the reduction of acute GVHD lethality in mice that received Pdl1-/- donor cells did not affect graft-versus-leukemia responses. These data demonstrate that PD-L1 selectively enhances T cell-mediated immune responses, suggesting a context-dependent function of the PD-1/PD-L1 axis, and suggest selective inhibition of PD-L1 on donor T cells as a potential strategy to prevent or ameliorate GVHD.


Figures

Figure 1
Figure 1. GVHD-induced PD-L1 upregulation on donor Teffs contributes to lethality.
(A and B) Lethally irradiated B6 or BALB/c recipients were infused with 107 WT B6 BM cells plus 6 × 10⁶ B6 Ly5.2 (CD45.1+) splenocytes. Mice were sacrificed on day 5 after BMT (n = 5 per group), and splenic donor CD4 and CD8 T cells were analyzed by flow cytometry for PD-1 (A) or PD-L1 (B) expression. Splenocytes of naive B6 Ly5.2 mice (n = 5) were included in the analysis. (C) T cells isolated from normal human donors (n = 3) were stimulated with anti–CD3/CD28 beads, and CD4 and CD8 T cells were stained for PD-L1 expression every 24 hours after stimulation. (AC) Data are representative of 2 independent experiments. (D) Human PBMCs were collected from healthy volunteers and from patients after allogeneic BMT with or without GVHD at the time of collection (Supplemental Table 1). CD4 and CD8 T cells were then stained and analyzed for PD-L1 expression using the gating strategy as shown in Supplemental Figure 2A. (E) Lethally irradiated BALB/c recipients were infused with 107 WT B6 BM cells alone or with 1 × 10⁶ WT B6 or Pdl1–/– purified T cells. Kaplan-Meier survival plot represents pooled data from 4 independent experiments (n = 31–34 per group; recipients of WT vs. Pdl1–/– donor T cells, P < 0.0001). (F) Lethally irradiated B10.BR recipients were infused with 107 WT B6 BM cells alone or with 3 × 10⁶ WT B6 or Pdl1–/– purified T cells. Kaplan-Meier survival plot represents pooled data from 2 independent experiments (n = 16–20 per group; recipients of WT vs. Pdl1–/– donor T cells, P = 0.0047). (G) Lethally irradiated BALB/c recipients were infused with 107 WT B6 BM cells alone or with 1 × 10⁶ WT B6, Pdl1–/–, or Pdl1–/– Pdl2–/– purified T cells. Kaplan-Meier survival plot of transplanted mice is shown (n = 8 per group; recipients of WT vs. Pdl1–/– donor T cells, P = 0.006; recipients of WT vs. Pdl1–/– Pdl2–/– donor T cells, P = 0.011). Data represent mean ± SEM (A, B, and D), and P values were calculated by 2-tailed t test (A, B, and D) or log-rank test (EG). *P < 0.05, ***P < 0.001.
Figure 2
Figure 2. Pdl1–/– versus WT donor T cells have reduced expression of gut homing and chemokine receptors, and inflammatory cytokines in spleen.
Lethally irradiated BALB/c recipients were infused with 107 WT B6 BM cells plus 2 × 10⁶ WT B6 or Pdl1–/– purified T cells. Mice were sacrificed (n = 5 per group) on day 7 after BMT, and donor CD4 and CD8 T cells in spleen were analyzed by flow cytometry for the expression of CD25, CD62L, and CD44 (A), LPAM-1 (B and C), CCR9 (D), and CXCR3 (E). MFI, mean fluorescence intensity. (FI) Intracellular cytokine staining was performed on day 7 after BMT to detect the number of donor T cells producing IFN-γ, TNF-α, IFN-γ/TNF-α, IL-6, or IL-17. (AI) Data are representative of 2–3 independent experiments. Data represent mean ± SEM, and P values were calculated by 2-tailed t test (A and CI). *P < 0.05, **P < 0.01, ***P < 0.001.
Figure 3
Figure 3. Pdl1–/– versus WT donor T cells promote less gut injury in recipients.
Lethally irradiated BALB/c recipients were infused with 107 WT B6 BM cells alone or with 2 × 10⁶ WT B6 or Pdl1–/– purified T cells. (A) Mice were sacrificed on day 24 after BMT (n = 5–7 per group), and H&E-stained tissue sections were scored for GVHD. (BF) Lethally irradiated BALB/c mice were infused with 107 WT B6 BM cells plus 2 × 10⁶ WT B6 or Pdl1–/– purified T cells. Mice were sacrificed on day 24 after BMT (n = 10 per group), and lymphocytes isolated from colon (2 colons were pooled to make 1 pooled sample and 5 pooled samples per group) were analyzed by flow cytometry. (B) Donor T cells were analyzed for total cell numbers or intracellular expression of Ki-67. (CF) Intracellular cytokine staining was performed to detect the number of donor T cells producing IFN-γ, TNF-α, IL-6, or IFN-γ/TNF-α. (G) FITC-dextran was administered orally on day 24 after BMT (n = 5–7 per group), and plasma levels were measured after 4 hours. (AG) Data are representative of 2 independent experiments. Data represent mean ± SEM, and P values were calculated by 2-tailed t test (AG). *P < 0.05, **P < 0.01, ***P < 0.001.
Figure 4
Figure 4. Reduced GVHD lethality in recipients of Pdl1–/– versus WT donor T cells is independent of donor Treg function.
(A) Tregs were isolated from naive WT BALB/c mice and were cultured with recombinant human IL-2 and CD3/CD28 beads. CD4+CD25+Foxp3+ cells were analyzed by flow cytometry for PD-1, PD-L1, and PD-L2 expression on day 4, day 7, and day 11. Shaded histogram: isotype-matched control Ab. (B) Tregs were isolated from naive WT B6 or Pdl1–/– mice. Naive B6 Ly5.2 mouse splenocytes were labeled with CFSE and used as responder cells. Responder cells were stimulated with anti-mCD3 Ab and were cultured with or without freshly isolated Tregs. T cell proliferation was determined by CFSE dilution on day 4 using flow cytometry. (A and B) Data are representative of 2 independent experiments. (C) Lethally irradiated BALB/c recipients were infused with 107 WT B6 BM cells alone, or with 1 × 10⁶ WT B6 purified T cells, or with 1 × 10⁶ WT B6 purified T cells plus 1 × 10⁶ WT B6 purified Tregs or 1 × 10⁶ Pdl1–/– purified Tregs. Kaplan-Meier survival plot represents pooled data from 2 independent experiments (n = 16–22 per group; WT T cells vs. WT T cells + WT Tregs, P = 0.0014; WT T cells vs. WT T cells + Pdl1–/– Tregs, P = 0.0004). (D) Lethally irradiated BALB/c recipients were infused with 107 WT B6 BM cells alone, or with 2 × 10⁶ WT B6 or Pdl1–/– purified T cells, or with 2 × 10⁶ WT B6 or Pdl1–/– CD25-depleted purified T cells. Kaplan-Meier survival plot represents pooled data from 2 independent experiments (n = 16–18 per group; WT T cells vs. WT CD25-depleted T cells, P = 0.0003; Pdl1–/– T cells vs. Pdl1–/– CD25-depleted T cells, P = 0.2306; WT vs. Pdl1–/– T cells, P < 0.0001). (B) Data represent mean ± SEM. P values were calculated by 2-tailed t test (B) or log-rank test (C and D). **P < 0.01, ***P < 0.001.
Figure 5
Figure 5. Higher expression of multiple inhibitory receptors by Pdl1–/– donor T cells leads to reduced Teff function.
(AF) Lethally irradiated BALB/c recipients were coinfused with 7.5 × 10⁶ B6 Ly5.2+ purified T cells plus 7.5 × 10⁶ Pdl1–/– purified T cells along with 107 WT B6 BM cells. Mice were sacrificed on day 3 after BMT (n = 5–10 per group), and donor T cells in spleen were analyzed by flow cytometry for the expression of Lag-3 (B) or Tim-3 (C) or intracellular expression of CTLA-4 (A), IFN-γ (D and E), or granzyme B (F). (G and H) Purified T cells from B6 Ly5.2 mice and Pdl1–/– mice were cocultured in the presence of suboptimal concentration of plate-bound anti-mCD3 (coating density 5 μg/ml) and soluble anti-mCD28 (1 μg/ml). Cells were harvested on day 4 and analyzed by flow cytometry for the expression of Lag-3, TIGIT, or intracellular expression of CTLA-4 or IFN-γ. (AH) Data are representative of 2 independent experiments. Data represent mean ± SEM, and P values were calculated by 2-tailed t test (AC and EH). *P < 0.05, **P < 0.01, ***P < 0.001.
Figure 6
Figure 6. PD-L1 expression on donor T cells is important for their expansion and survival.
(AE) Lethally irradiated BALB/c recipients were infused with 107 WT B6 BM cells plus 20 × 106 CFSE-labeled WT B6 or Pdl1–/– splenocytes. Mice were sacrificed on day 4 after BMT, and splenocytes were analyzed by flow cytometry. Donor T cells were analyzed for total cell numbers (A), CFSE dilution (B), annexin V (C), FasL (D), or TMRM expression (E). (F and G) Lethally irradiated BALB/c recipients were infused with 107 WT B6 BM cells plus 2 × 10⁶ WT B6 or Pdl1–/– purified T cells. (F) Intracellular staining was performed on day 5 and analyzed by flow cytometry to detect the percentage of splenic donor T cells expressing Bcl-xL and Ki-67. (G) Splenocytes were also analyzed on day 5 to detect the percentage of donor T cells expressing CD127. (AG) Data are representative of at least 5 mice per group from 2–3 independent experiments. Data represent mean ± SEM, and P values were calculated by 2-tailed t test (AG). *P < 0.05, **P < 0.01, ***P < 0.001.
Figure 7
Figure 7. WT and Pdl1–/– donor T cells have identical signaling patterns.
Lethally irradiated BALB/c recipients were infused with 107 WT B6 BM cells plus 2 × 10⁶ WT B6 or Pdl1–/– purified T cells. Mice were sacrificed (n = 10 per group) on day 5 or day 7 after BMT, and donor T cells were purified from spleen (3–4 spleens were pooled to make 1 pooled sample and 3 pooled samples per group). (A) Cell lysates were prepared from unstimulated or pervanadate-stimulated donor T cells, and phosphotyrosine Western blot analysis was performed. (B) Cell lysates were prepared from unstimulated T cells and probed for phospho-Akt, ZAP70, β-actin, and phospho–PKC-θ for Western blot analysis. Data are representative of 2–3 independent experiments.
Figure 8
Figure 8. Unsupervised clustering of differentially expressed genes in WT versus Pdl1–/– donor T cells during GVHD.
Lethally irradiated BALB/c recipients were infused with 107 WT B6 BM cells plus 2 × 10⁶ WT B6 or Pdl1–/– purified T cells. Mice were sacrificed (n = 15 per group) on day 5 after BMT, and donor CD4 and CD8 T cells were purified separately from spleen (5 spleens were pooled to make 1 pooled sample and 3 pooled samples per group). Differential expression between WT versus Pdl1–/– donor CD4 (A) and CD8 (B) T cells was analyzed using SAM. Unsupervised hierarchical clustering on genes that were differentially expressed at an FDR of 0.20 was done and a heat map generated to describe the results. Each column represents an individual pooled sample, and each row represents a single gene. Expression values are scaled by rows with values greater than mean shown in red and values less than mean shown in green, with intensity of color corresponding to relative level of expression. Genes with membership in a KEGG metabolism gene set are highlighted with text labels. (C) Pathway analysis of WT versus Pdl1–/– donor T cells during GVHD. Differential expression of genes comprising various KEGG pathways was tested using QuSAGE, with CD4 and CD8 T cell samples pooled into WT and Pdl1–/– groups (n = 6 pooled samples per group). A list of gene sets included in the analysis is shown in Supplemental Table 2. Gene sets with relative expression differences found at an FDR of 0.20 are shown, along with 95% confidence intervals for the expression difference. P values for C were calculated using the QuSAGE method (35).
Figure 9
Figure 9. Glucose and glutamine metabolism alterations in Pdl1–/– donor T cells during GVHD.
Lethally irradiated Thy1.1+ BALB/c recipients were infused with 107 WT B6 BM cells plus 20 × 106 CellTrace Violet–labeled (CTV-labeled) or unlabeled WT B6 or Pdl1–/– splenocytes. Lethally irradiated Thy1.1+ B6 recipients were infused with 107 WT B6 BM cells plus 20 × 106 CTV-labeled or unlabeled WT B6 splenocytes and used as syngeneic control. Mice were sacrificed on day 4 after BMT, and experiments were performed as described. (A) Splenocytes were analyzed by flow cytometry for intracellular expression of GLUT1 in undivided (CTVhi) and divided (CTVlo) donor T cells. (B) ECAR of purified donor T cells was measured after addition of glucose, oligomycin, and 2-deoxyglucose (2-DG). (C) Basal glycolysis was measured after addition of glucose, and glycolytic capacity was measured after addition of oligomycin. (D) OCR of purified donor T cells was measured after addition of oligomycin, fluorocarbonyl cyanide phenylhydrazone (FCCP), and antimycin A. (E) Basal OCR (resting OCR – antimycin A OCR) was measured before addition of oligomycin, and maximal OCR was measured after addition of FCCP subtracting nonmitochondrial OCR (antimycin A OCR). (F) Splenic donor T cells were analyzed by flow cytometry for CD98 expression. (G and H) Purified donor T cells were cultured at 37°C for 4 hours. Culture supernatants were collected, and glutamine consumption and glutamate production were measured using a NovaFlex analyzer. ND, not detected. (B, D, and FH) T cells purified from naive WT B6 mice (n = 4) were included as control. (A and F) Data are representative of 5 mice per group from 2–3 independent experiments. (BE, G, and H) Data are representative of 12 mice per group from 2–3 independent experiments. Data represent mean ± SEM. P values were calculated by 2-tailed t test (A, C, and EH). *P < 0.05, **P < 0.01, ***P < 0.001.
Figure 10
Figure 10. FA metabolism alterations in Pdl1–/– donor T cells during GVHD.
(AE) Lethally irradiated Thy1.1+ BALB/c mouse recipients infused with 107 WT B6 BM cells plus 20 × 106 CTV-labeled or unlabeled WT B6 or Pdl1–/– splenocytes. Lethally irradiated Thy1.1+ B6 recipients were infused with 107 WT B6 BM cells plus 20 × 106 CTV-labeled or unlabeled WT B6 splenocytes and used as syngeneic control. Mice were sacrificed on day 4 after BMT, and experiments were performed as described. Splenic donor T cells were analyzed by flow cytometry for BoDipy (A) and CD36 (B) expression. (C) Splenocytes were also analyzed by flow cytometry for intracellular expression of CPT1a in undivided and divided donor T cells. (AC) Data are representative of 5 mice per group from 2–3 independent experiments. (D and E) OCR of purified donor T cells was measured after addition of oligomycin, FCCP, etomoxir (Eto), and antimycin A. Data are representative of 12 mice per group. (A and D) T cells from naive WT B6 mice (n = 4) were included as control. (FH) Reduced apoptosis and enhanced metabolic activities in WT versus Pdl1–/– donor T cells are intrinsic properties of donor T cells. Lethally irradiated BALB/c recipients were coinfused with 15 × 106 B6 Ly5.2+ splenocytes plus 15 × 106 Pdl1–/– splenocytes along with 107 WT B6 BM cells. Recipient mice were treated with isotype-matched control Ab or anti–PD-L1 blocking mAb. Donor T cells in spleen were analyzed on day 4 after BMT (n = 5 mice per group) for DHE (F), or intracellular expression of GLUT1 (G) or CPT1a (H) by flow cytometry. Data are representative of 2 independent experiments. Data represent mean ± SEM. P values were calculated by 2-tailed t test (AC and EH). *P < 0.05, **P < 0.01, ***P < 0.001.
Figure 11
Figure 11. Pdl1–/– donor T cells retain GVL effects.
(A, B, and E) Lethally irradiated BALB/c recipients were infused with 107 T cell–depleted WT B6 BM cells plus 3 × 10⁵ A20luc-lymphoma cells or with 1 × 10⁶ WT B6 or Pdl1–/– purified T cells (n = 8 mice per group) on day 0. (C, D, and F) Lethally irradiated BALB/c recipients were infused with 107 T cell–depleted WT B6 BM cells plus 1 × 10⁶ A20luc-lymphoma cells or with 1 × 10⁶ WT B6 or Pdl1–/– purified T cells (n = 8 mice per group) on day 0. (A and C) Tumor growth was monitored by luciferase imaging on day 7, day 14, day 21, day 27, day 35, day 41, day 48, day 55, and day 62 after BMT. BLI, bioluminescence imaging. (B) Kaplan-Meier survival plot of transplanted mice is shown (recipients of WT vs. Pdl1–/– donor T cells, P = 0.0092). (D) Kaplan-Meier survival plot of transplanted mice is shown (recipients of WT vs. Pdl1–/– donor T cells, P = 0.046). (E and F) In vivo bioluminescence imaging of A20luc-lymphoma cells on day 14 and day 27 after BMT. The scale to the right of the images describes the color map for the photon count. P values were calculated by log-rank test (B and D). (AF) Data were obtained from 1 experiment.

References

    1. Socie G, Blazar BR. Acute graft-versus-host disease: from the bench to the bedside. Blood. 2009;114(20):4327–4336. doi: 10.1182/blood-2009-06-204669. - DOI - PMC - PubMed
    1. Blazar BR, Murphy WJ, Abedi M. Advances in graft-versus-host disease biology and therapy. Nat Rev Immunol. 2012;12(6):443–458. doi: 10.1038/nri3212. - DOI - PMC - PubMed
    1. McDonald-Hyman C, Turka LA, Blazar BR. Advances and challenges in immunotherapy for solid organ and hematopoietic stem cell transplantation. Sci Transl Med. 2015;7(280): doi: 10.1126/scitranslmed.aaa6853. - DOI - PMC - PubMed
    1. Okazaki T, et al. PD-1 immunoreceptor inhibits B cell receptor-mediated signaling by recruiting src homology 2-domain-containing tyrosine phosphatase 2 to phosphotyrosine. Proc Natl Acad Sci U S A. 2001;98(24):13866–13871. doi: 10.1073/pnas.231486598. - DOI - PMC - PubMed
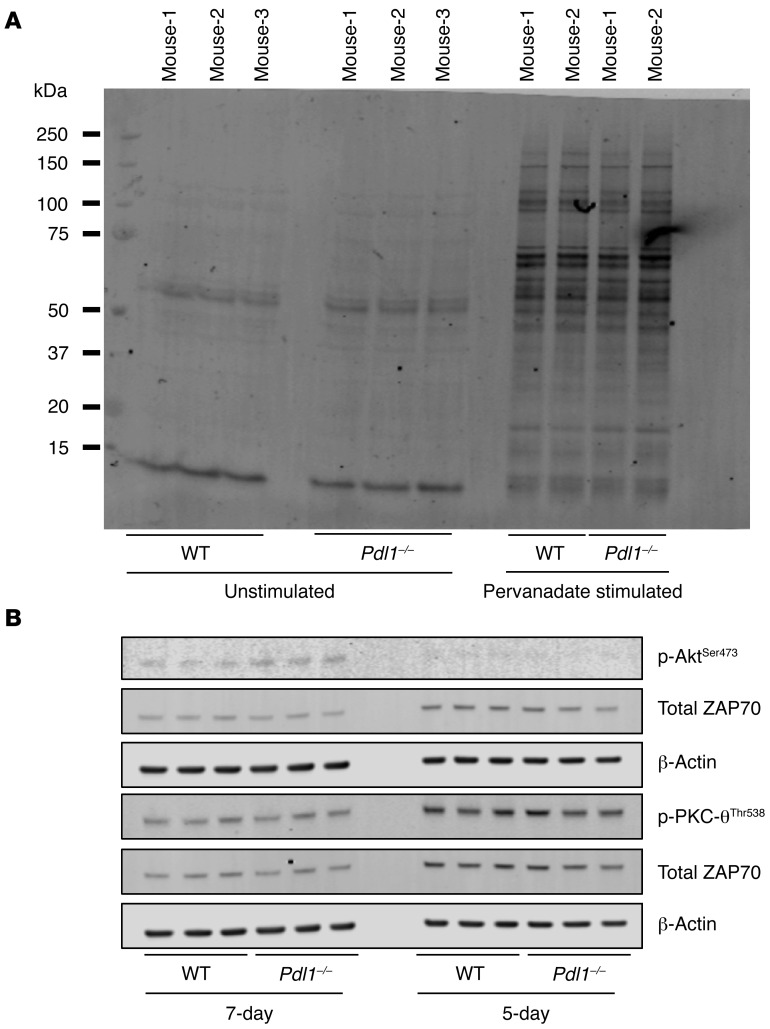
    1. Sheppard KA, et al. PD-1 inhibits T-cell receptor induced phosphorylation of the ZAP70/CD3zeta signalosome and downstream signaling to PKCtheta. FEBS Lett. 2004;574(1–3):37–41. - PubMed

Publication types

MeSH terms