. 2016 Aug;48(8):827-37.
doi: 10.1038/ng.3586. Epub 2016 Jun 13.

Protein-structure-guided discovery of functional mutations across 19 cancer types

Affiliations

Protein-structure-guided discovery of functional mutations across 19 cancer types

Beifang Niu et al. Nat Genet. 2016 Aug.

Erratum in

Abstract

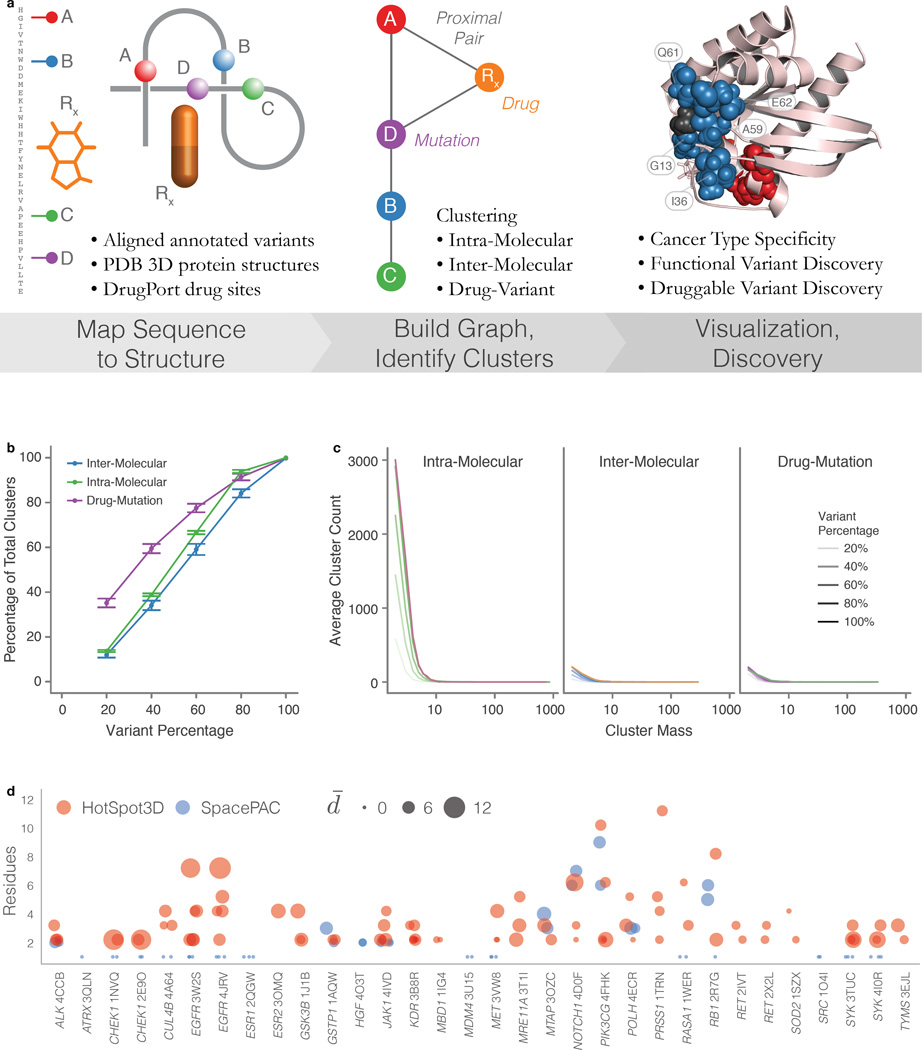
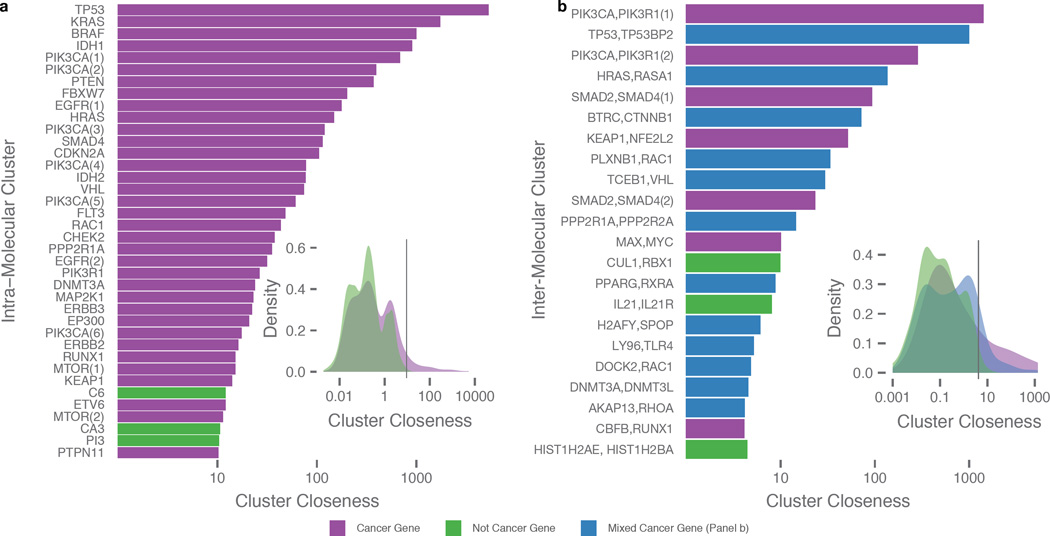
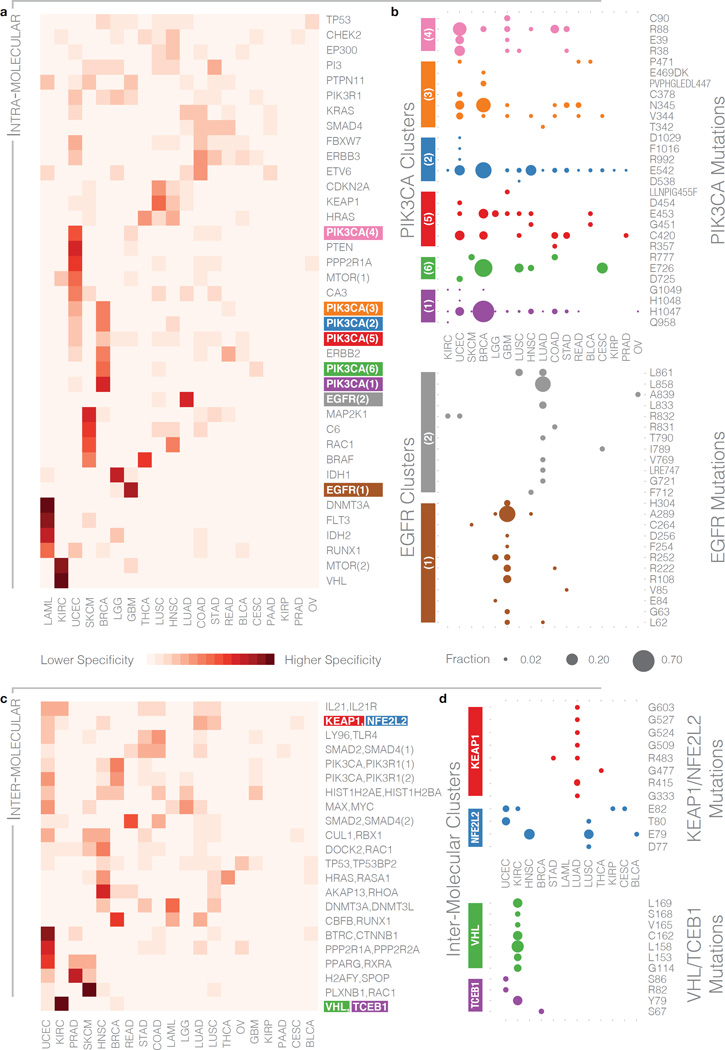
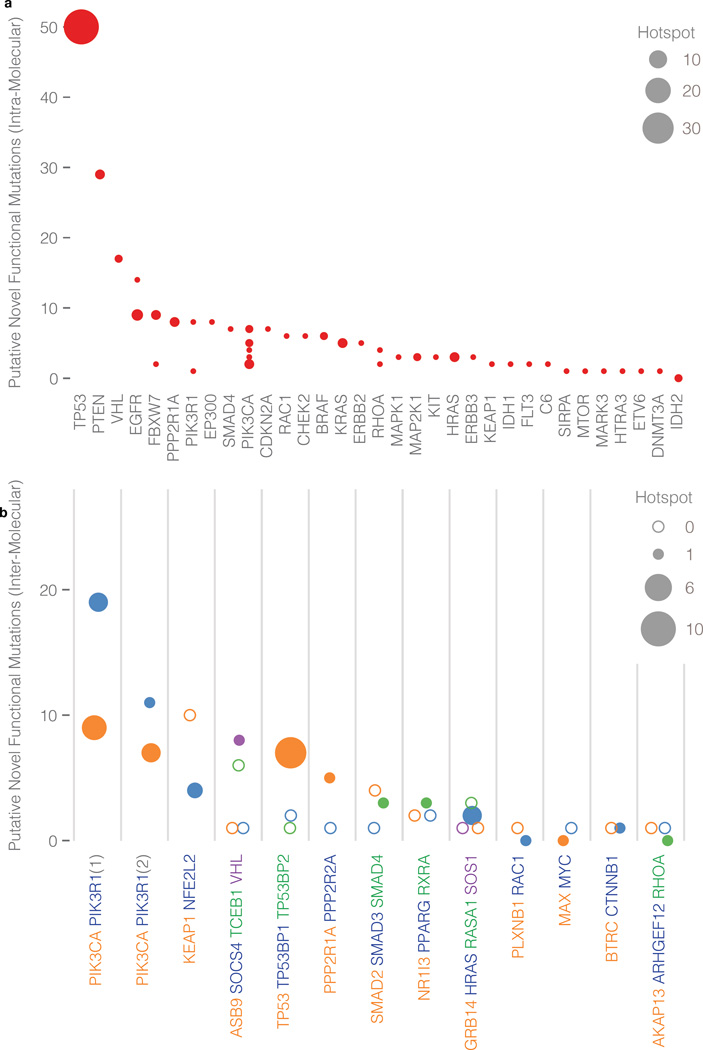
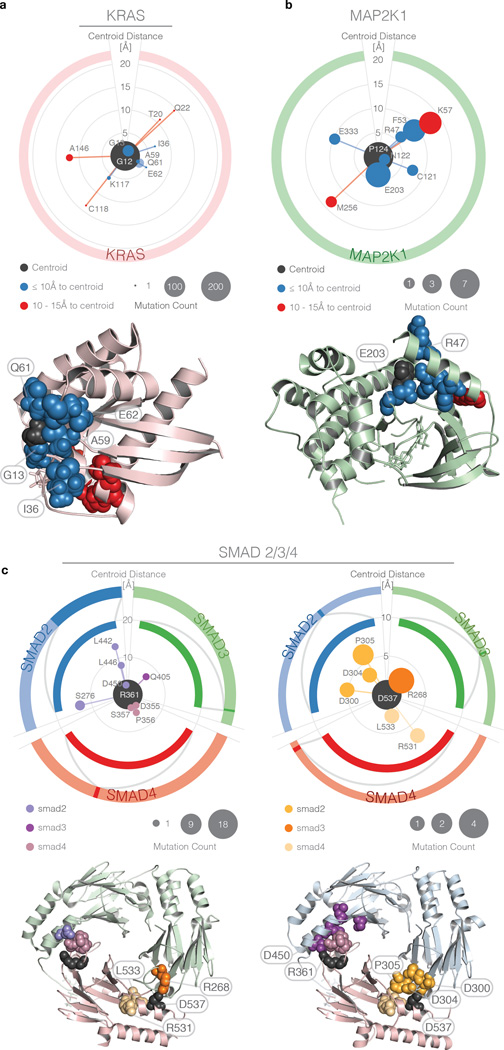
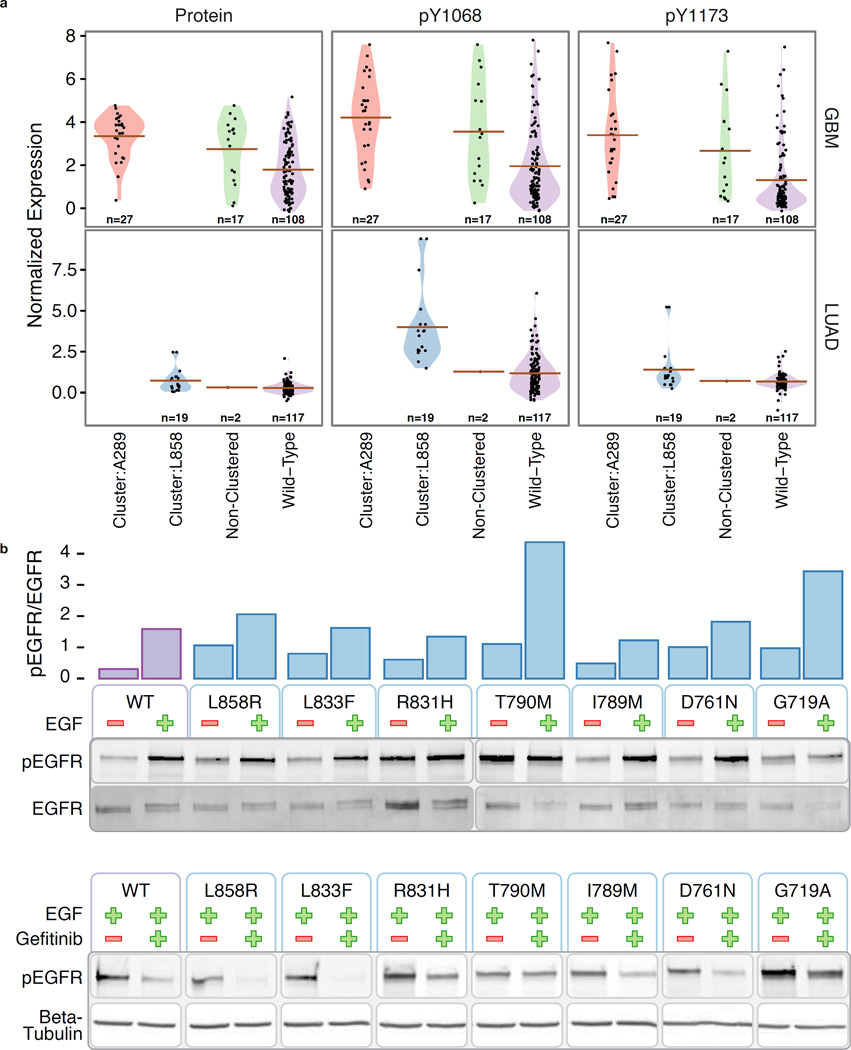
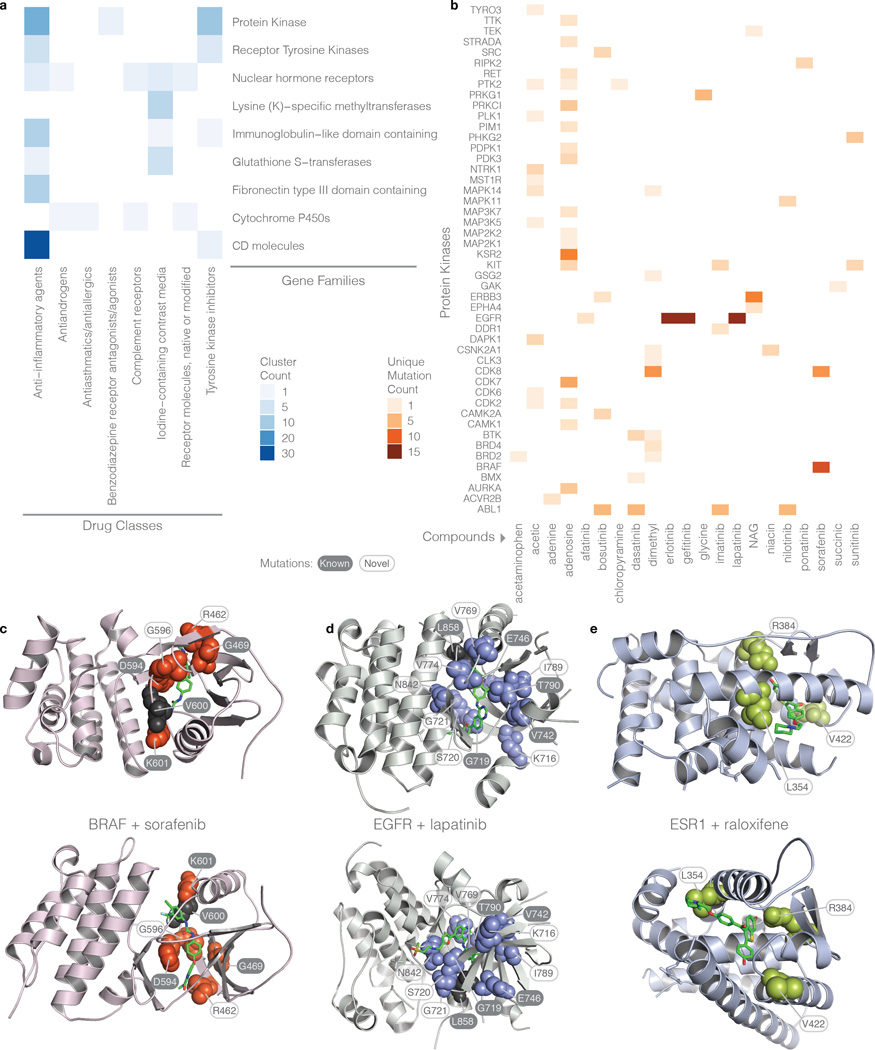
Local concentrations of mutations are well known in human cancers. However, their three-dimensional spatial relationships in the encoded protein have yet to be systematically explored. We developed a computational tool, HotSpot3D, to identify such spatial hotspots (clusters) and to interpret the potential function of variants within them. We applied HotSpot3D to >4,400 TCGA tumors across 19 cancer types, discovering >6,000 intra- and intermolecular clusters, some of which showed tumor and/or tissue specificity. In addition, we identified 369 rare mutations in genes including TP53, PTEN, VHL, EGFR, and FBXW7 and 99 medium-recurrence mutations in genes such as RUNX1, MTOR, CA3, PI3, and PTPN11, all mapping within clusters having potential functional implications. As a proof of concept, we validated our predictions in EGFR using high-throughput phosphorylation data and cell-line-based experimental evaluation. Finally, mutation-drug cluster and network analysis predicted over 800 promising candidates for druggable mutations, raising new possibilities for designing personalized treatments for patients carrying specific mutations.


Conflict of interest statement

Competing financial interests

The authors declare no competing financial interests.

Figures

Figure 1
Figure 1. HotSpot3D workflow, robustness simulations, and comparison to SpacePAC
a) HotSpot3D work-flow can be grouped to three processing steps, (from left to right), Data Preprocessing, Structural Analysis, and Post Processing. First, annotation resources from several databases are used to contextualize input datasets, including user-defined DNA variants. Variants are then annotated and mapped onto appropriate PDB structures. DrugPort annotations are used to map pharmaceutical/nutraceuticals onto PDB molecules as a part of the drug module. Mutation pairwise calculations are performed and users can perform clustering of the paired mutations. Users can then visualize mutation clusters along with annotated information. Analyses by users can then lead to in silico discoveries for functional validation hypotheses. b) Robustness simulations show a steady reduction in the percentage of clusters found relative to the percentage of the variant set used. Error bars represent one standard deviation from the mean over 50 random trials. c) Cluster mass distributions show steady decline in clusters of all sizes. Each variant percentage curve (below 100%) is an average over the random trials represented in panel b. d) Significant mutation clusters (P ≤ 0.05) are shown as circles found by HotSpot3D (red) and SpacePAC (blue). The number of residues in each cluster is shown for each structure, labeled by HUGO Symbol and PDB ID. Centers are slightly offset from each residue number, with SpacePAC on the left and HotSpot3D on the right. For all structures, molecule chain A was used. The size of each circle indicates the average inner cluster distance.
Figure 2
Figure 2. Significant spatial clusters
Panels are divided into intra-molecular (a) and inter-molecular (b) results and purple and green shading denoting gene type, i.e. cancer and non-cancer genes, respectively. a) List of intra-molecular clusters having the highest cluster closeness as defined by the same type of threshold procedure on cluster closeness distribution (inset). b) List of inter-molecular clusters having the highest cluster closeness, with threshold set at top 20% (inset). Here, inter-molecular clusters are divided into 3 groups: clusters of strictly cancer genes (purple), clusters with at least one cancer gene (blue), and cluster composed solely of non-cancer genes (green) and axis labels only include the top two genes contributing the most number of mutations. Multiple clusters within a single protein or protein complex are differentiated with a numerical suffix in parentheses.
Figure 3
Figure 3. Cancer type specificity of intra-molecular and inter-molecular clusters
a) Cancer specificity heat map of intra-molecular clusters exceeding the threshold defined in Figure 1b. Each row represents a cluster, with intensity of shading indicating the proportion of mutations across all samples in a cluster observed in a particular cancer type. b) Distribution of cancer type specificities of 6 PIK3CA (purple, green, blue, red, orange, and pink) and 2 EGFR (brown and gray) clusters at the residue level. Bubble sizes indicate the fraction of mutations in the cluster that occur at specific residues (labeled on y-axis) for each of the 19 cancer types (x-axis). Bubble color indicates corresponding clusters on the heat map in panel (a), with a trailing suffix in parenthesis to distinguish multiple clusters within same gene. c) Cancer specificity heat map of the inter-molecular clusters exceeding the threshold defined in Figure 1d. d) Distribution of cancer type specificities of the KEAP1/NFE2L2 (red and blue, respectively) and VHL/TCEB1 (green and purple, respectively) clusters at a residue level. Here, colors correspond to the specific genes that make up the cluster.
Figure 4
Figure 4. Intra-molecular and inter-molecular clusters with unique hotspot mutations and novel mutations
Numbers of unique hotspot and novel mutations are indicated by bubble area and y-axis position, respectively. a) Intra-molecular clusters: Proteins are labeled on the x-axis and each bubble denotes a cluster from each protein. b) Inter-molecular clusters: Clusters are labeled on the x-axis and bubble colors correspond to member proteins (multiple clusters involving the same proteins are designated in parenthesis). Hollow bubbles indicate that a protein has novel unique mutations but does not have a hotspot.
Figure 5
Figure 5. Polar plots showing rare/medium recurrent functional mutation discovery in intra-molecular and inter-molecular clusters
Centroids (black) and mutations are represented by bubbles. The latter are ordered clockwise according to primary sequence position, with the radial extent proportional to centroid-mutation spatial distance (rather than geodesics used for clustering). Bubble area indicates number of samples in which the mutations are found. Outer and inner rings represent, respectively, the entire protein linear sequence and a subsection within which the mutations are found. Corresponding clusters on the 3D protein structure are shown below each polar plot. Although there is a linear limit of 20 peptides between paired mutations (Methods), clusters represent networks with edge lengths as the pairwise distance, thus picking up mutations between linearly limited mutations through chaining mutations. a) KRAS Gly12 cluster, with colors indicating mutation distance from the centroid, and corresponding 3D protein structure. b) MAP2K1 Pro124 cluster with same scaling as panel (a) and corresponding 3D structure. c) SMAD2/3/4 clusters with centroid located at SMAD4 Arg361 (top left) and SMAD4 Asp537 (top right). The three proteins are distinguished on the polar plots by differing colors of the outer and inner rings (which correspond to protein backbone color on 3D structure) and slight variation in hue for the bubbles. SMAD3/SMAD4 complex 3D structure on bottom left shows SMAD4 Arg361 (purple) and SMAD4 Asp537 (orange). SMAD2/SMAD4 complex 3D structure is on bottom right with same color key.
Figure 6
Figure 6. Functional assessment using phosphorylation data and experimental validation
a) Protein and phosphoprotein (pTyr1068 and pTyr1173) levels in GBM and LUAD samples with mutations in EGFR from the Ala289 cluster (red), the Leu858 cluster (green), non-clustered (blue), and wild type (purple). b) Ligand-independent activity of the mutant EGFR. Bar plot shows normalized relative intensities of pEGFR/EGFR from the western blots below. NIH3T3 clone2.2 cells were transiently transfected with wild type (WT) or mutant EGFR constructs were cultured in 0.5% calf serum for 24h before stimulating with EGF (50ng/ml) for 10 minutes. EGFR autophosphorylation was analyzed by quantifying phosphorylated EGFR (pEGFR, phospho Tyr1068). Tyrosine 1068 of mature EGFR is equivalent to Tyrosine 1092 of uncleaved EGFR. c) NIH3T3 clone2.2 cells were transiently transfected with wild type or mutant EGFR constructs were cultured in 0.5% calf serum for 21h. A 3h gefitinib (1uM) treatment was started at this time and it was followed by a 10-minute EGF stimulation.
Figure 7
Figure 7. Drug-mutation interaction heat maps and structures
a) Number of clusters across gene families and drug classes. Gene families and protein kinases are determined by the HUGO Gene Nomenclature Committee (HGNC) and the Gene Ontology (GO) databases, respectively. Protein kinase family is a superset of the receptor tyrosine kinase family. b) Number of unique mutations involving specific protein kinases and drugs. c) 3D structures displaying drug-mutation clusters for BRAF, EGFR, and ESR1 with sorafenib, lapatinib, and raloxifene, respectively. Mutations are depicted as spheres while drugs are represented as green stick models. Black residues represent the centroids; however, for the ESR1 cluster, the drug is the centroid. Two views are shown at different rotations.

References

    1. Dees ND, et al. MuSiC: Identifying mutational significance in cancer genomes. Genome research. 2012;22:1589–1598. - PMC - PubMed
    1. Lawrence MS, et al. Mutational heterogeneity in cancer and the search for new cancer-associated genes. Nature. 2013;499:214–218. - PMC - PubMed
    1. Carter H, Samayoa J, Hruban RH, Karchin R. Prioritization of driver mutations in pancreatic cancer using cancer-specific high-throughput annotation of somatic mutations (CHASM) Cancer biology & therapy. 2010;10:582–587. - PMC - PubMed
    1. Gonzalez-Perez A, et al. IntOGen-mutations identifies cancer drivers across tumor types. Nature methods. 2013 - PMC - PubMed
    1. Gonzalez-Perez A, Lopez-Bigas N. Functional impact bias reveals cancer drivers. Nucleic acids research. 2012;40:e169. - PMC - PubMed

Methods References

    1. Reorganizing the protein space at the Universal Protein Resource (UniProt) Nucleic acids research. 2012;40:D71–D75. - PMC - PubMed
    1. Berman HM. The Protein Data Bank: a historical perspective. Acta crystallographica. Section A, Foundations of crystallography. 2008;64:88–95. - PubMed
    1. Law V, et al. DrugBank 4.0: shedding new light on drug metabolism. Nucleic acids research. 2014;42:D1091–D1097. - PMC - PubMed
    1. Dangalchev C. Residual closeness in networks. Physica A: Statistical Mechanics and its Applications. 2006;365:556–564.
    1. Siepel A, et al. Evolutionarily conserved elements in vertebrate, insect, worm, and yeast genomes. Genome research. 2005;15:1034–1050. - PMC - PubMed

Publication types