. 2016 Jul;23(7):682-690.
doi: 10.1038/nsmb.3248. Epub 2016 Jun 13.

The dynamic interactome and genomic targets of Polycomb complexes during stem-cell differentiation

Affiliations

The dynamic interactome and genomic targets of Polycomb complexes during stem-cell differentiation

Susan L Kloet et al. Nat Struct Mol Biol. 2016 Jul.

Abstract

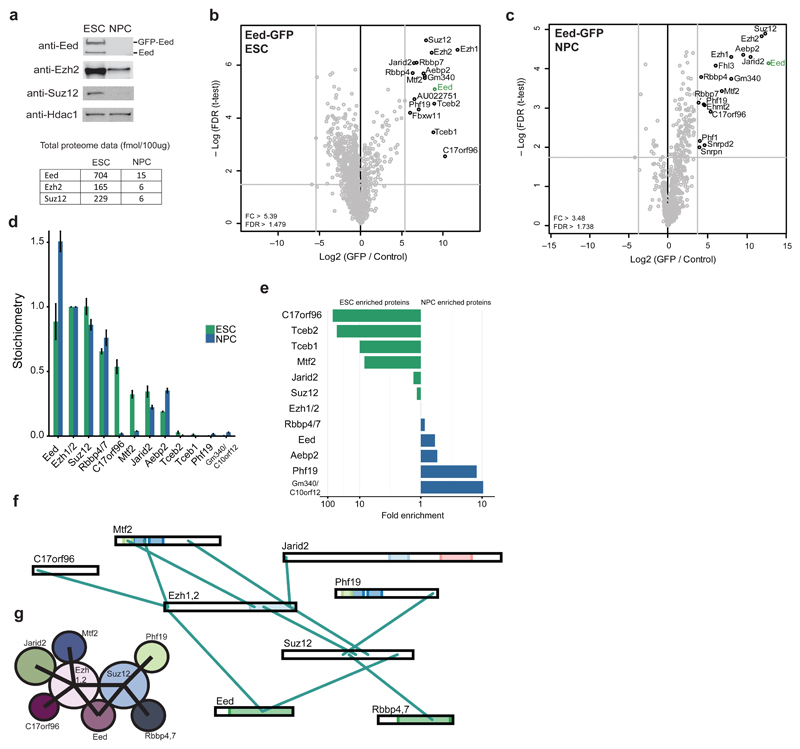
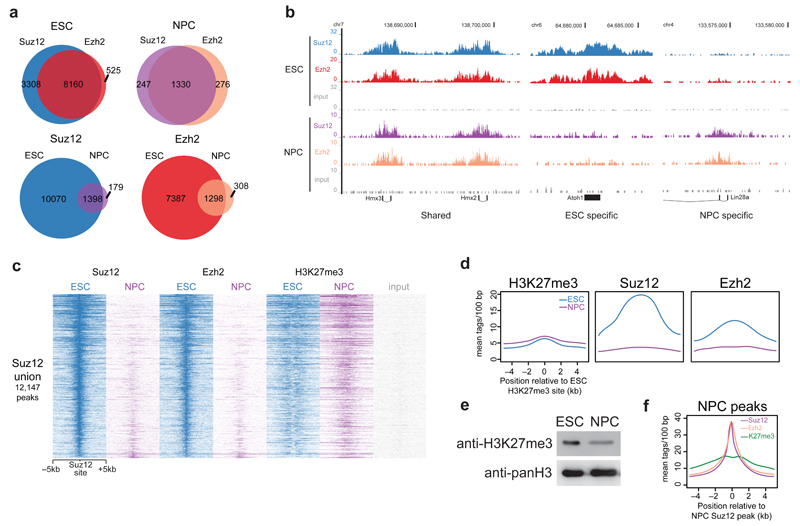
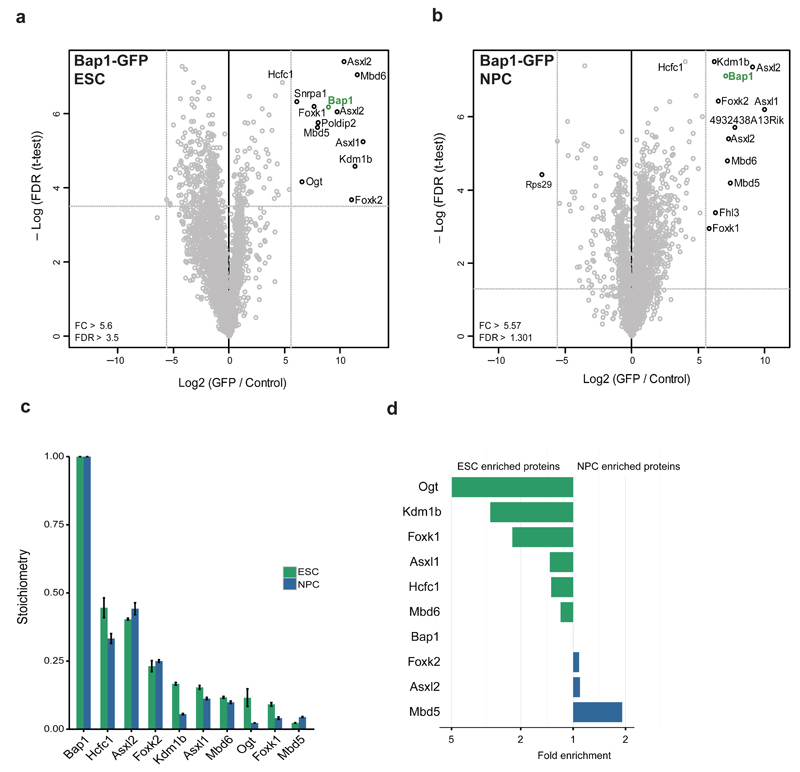
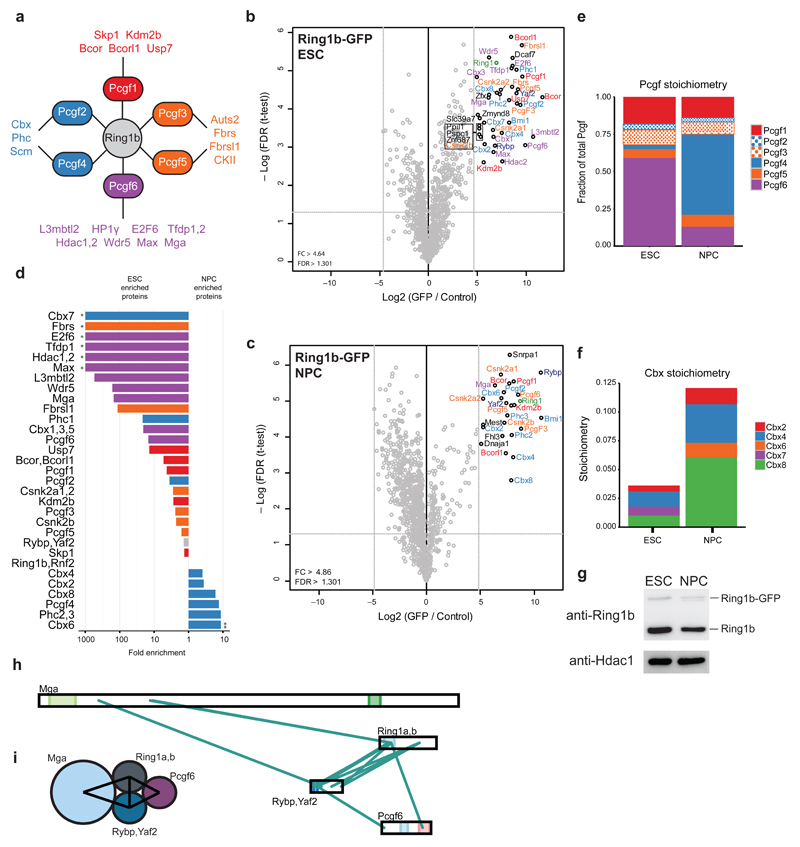
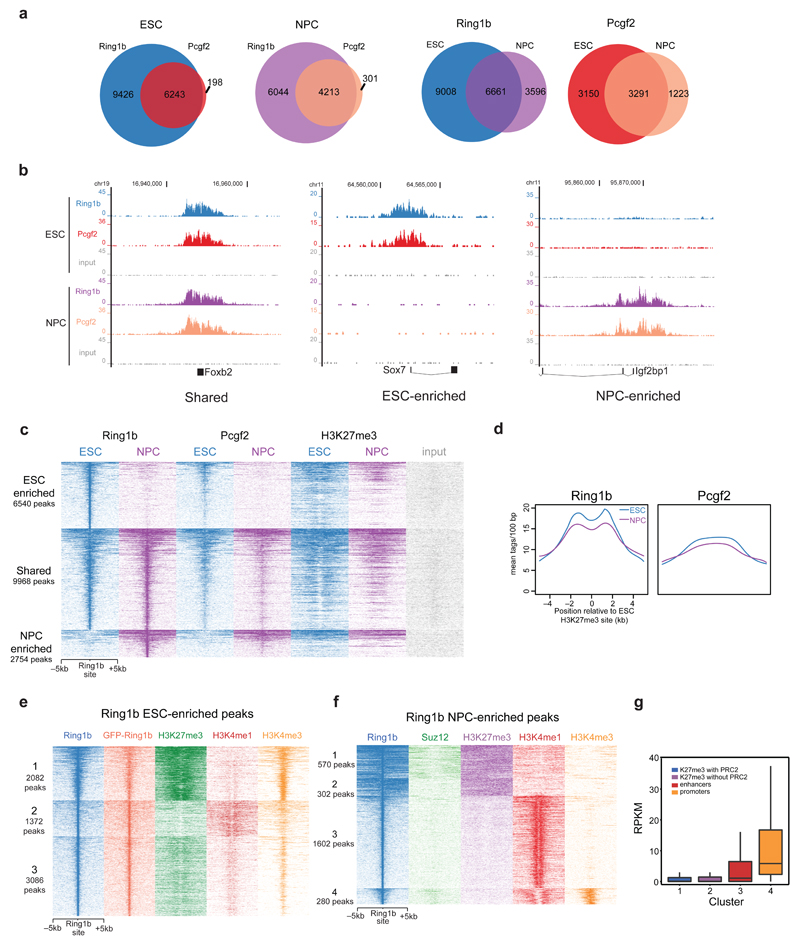
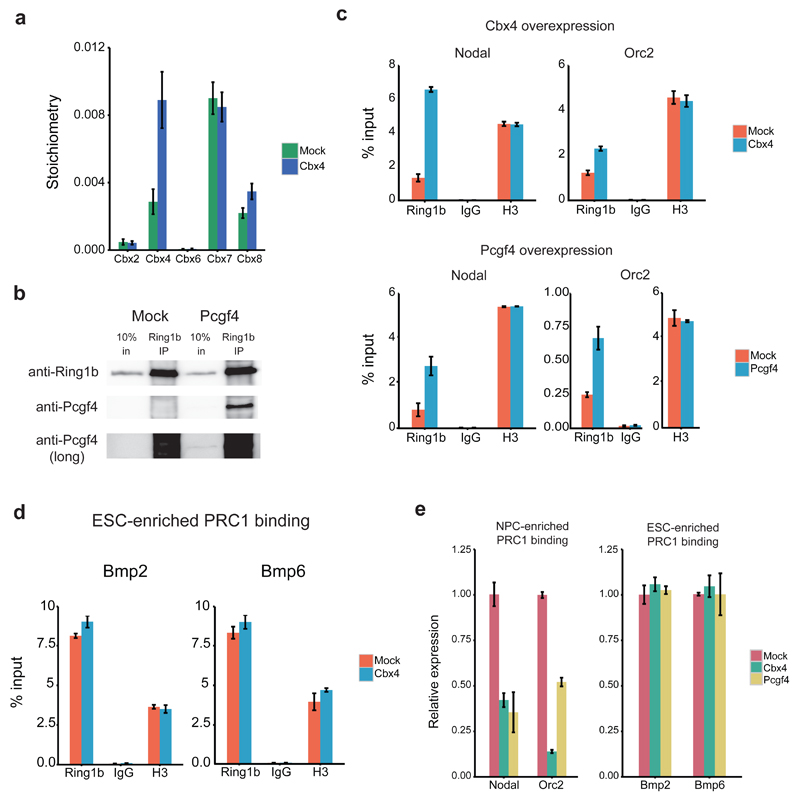
Although the core subunits of Polycomb group (PcG) complexes are well characterized, little is known about the dynamics of these protein complexes during cellular differentiation. We used quantitative interaction proteomics and genome-wide profiling to study PcG proteins in mouse embryonic stem cells (ESCs) and neural progenitor cells (NPCs). We found that the stoichiometry and genome-wide binding of PRC1 and PRC2 were highly dynamic during neural differentiation. Intriguingly, we observed a downregulation and loss of PRC2 from chromatin marked with trimethylated histone H3 K27 (H3K27me3) during differentiation, whereas PRC1 was retained at these sites. Additionally, we found PRC1 at enhancer and promoter regions independently of PRC2 binding and H3K27me3. Finally, overexpression of NPC-specific PRC1 interactors in ESCs led to increased Ring1b binding to, and decreased expression of, NPC-enriched Ring1b-target genes. In summary, our integrative analyses uncovered dynamic PcG subcomplexes and their widespread colocalization with active chromatin marks during differentiation.


Conflict of interest statement

The authors declare no competing financial interests.

Figures

Figure 1
Figure 1. PRC2 interactors and architecture during stem cell differentiation
(a) Western blot (top) of core PRC2 members on nuclear extracts from ESCs and NPCs. Hdac1 is used as a loading control. Uncropped blots appear in Supplementary Data Set 1. The bottom table lists the absolute abundance of Eed, Ezh2 and Suz12 in nuclear extracts from each cell type. (b,c) Volcano plots from label-free GFP pulldowns on Eed-GFP ESC (b) and NPC (c) nuclear extracts. Statistically enriched proteins in the Eed-GFP pulldown are identified by a permutation-based FDR-corrected t-test. The label-free quantification (LFQ) intensity of the GFP pulldown relative to the control [fold change (FC), x-axis] is plotted against the -log10-transformed P-value of the t-test (y-axis). Dotted grey lines represent statistical cutoffs. The proteins in the upper right corner represent the bait (Eed, green) and its interactors. Snrpn, Snrpd2, and Fhl3 are known GFP contaminants. (d) Stoichiometry of Eed-GFP interactors in ESCs and NPCs. The iBAQ value of each protein group is divided by the iBAQ value of the core PRC2 subunits Ezh1 and 2, then graphed with Ezh1 and 2 set to 1. Data are shown as mean ± s.d. (n = 3 pulldowns). (e) Logarithmic plot of the ratio of ESC enrichment (left) or NPC enrichment (right) for Eed-GFP interacting proteins. (f) Visualization of cross-links identified from single affinity purified Eed-GFP in ESCs. Ambiguous cross-links between paralogous subunits (Rbbp4 and 7, Ezh1 and 2) are combined in this visualization. (g) Summary of PRC2 architecture in mESCs based on cross-links from (f).
Figure 2
Figure 2. ChIP-sequencing of core PRC2 subunits during stem cell differentiation
(a) Venn diagrams summarizing the number of peaks called from Suz12 and Ezh2 ChIP-seq in ESCs and NPCs. (b) UCSC genome browser screenshots of binding profiles at 3 classes of genes: Cell type independent, ESC specific, or NPC specific binding. (c) Suz12, Ezh2, and H3K27me3 occupancy (ChIP-seq read density) in ESCs and NPCs centered on Suz12 ESC peaks. (d) Average binding profile of Suz12 and Ezh2 in ESCs and NPCs at H3K27me3 peaks in ESCs. (e) Western blot analysis of acid extracted histones from ESCs and NPCs using the indicated antibodies. Uncropped blots appear in Supplementary Data Set 1. (f) Average binding profile of Suz12, Ezh2, and H3K27me3 in NPCs at Suz12 NPC peaks.
Figure 3
Figure 3. PR-DUB interactors during stem cell differentiation
(a,b) Volcano plots from label-free GFP pulldowns on Bap1-GFP ESC (a) and NPC (b) nuclear extracts graphed as in Fig. 1b. Snrpa1 and Fhl3 are known GFP contaminants. (c) Stoichiometry of Bap1-GFP interactors in mESCs and NPCs. The iBAQ value of each protein group is divided by the iBAQ value of Bap1, then graphed with Bap1 set to 1. Data are shown as mean ± s.d. (n = 3 pulldowns). (d) Plot of the ratio of ESC enrichment (left) or NPC enrichment (right) for Bap1-GFP interacting proteins.
Figure 4
Figure 4. PRC1 interactors and architecture during stem cell differentiation
(a) Schematic of the PRC1 complex showing the core catalytic subunit Ring1b as well as all 6 Pcgf proteins and a summary of their known interactors. (b,c) Volcano plot from label-free GFP pulldowns on Ring1b-GFP ESC (b) or NPC (c) nuclear extracts graphed as in Fig. 1b. Snrpa1 and Fhl3 are known GFP contaminants. (d) Logarithmic plot of the ratio of ESC enrichment (left) or NPC enrichment (right) for Ring1b-GFP interacting proteins. (*) only detected in ESC pulldown (**) only detected in NPC pulldown (e) Pcgf protein stoichiometry values in ESCs and NPCs. Results are presented as the fraction of total Pcgf bound to the complex. (f) Cbx protein stoichiometry values from ESCs and NPCs. (g) Western blot of GFP-tagged and endogenous Ring1b on nuclear extracts from ESCs and NPCs with Hdac1 used as a loading control. Uncropped blots appear in Supplementary Data Set 1. (h) Visualization of cross-links identified from single affinity purified Ring1b-GFP from ESCs. Ambiguous cross-links between paralogous subunits (Ring1a and Ring1b, Rybp and Yaf2) are combined in this visualization. (i) Summary of PRC1 architecture in ESCs based on cross-links shown in (h).
Figure 5
Figure 5. ChIP-sequencing of core PRC1 subunits during stem cell differentiation
(a) Venn diagrams summarizing the number of peaks called from Ring1b and Pcgf2 ChIP-seq in ESCs and NPCs. (b) UCSC genome browser screenshots of binding profiles at 3 classes of genes: Shared, ESC enriched, or NPC enriched binding. (c) Ring1b, Pcgf2, and H3K27me3 occupancy (ChIP-seq read density) in ESCs and NPCs at 3 clusters of genes centered on the union of all Ring1b peaks. Enriched peaks have >3-fold more reads at the Ring1b binding site relative to the other cell type. (d) Average binding profile of Ring1b and Pcgf2 in ESCs and NPCs at H3K27me3 peaks in ESCs. (e) k-means clustering of Ring1b ESC enriched peaks on Ring1b, GFP-Ring1b, H3K27me3, H3K4me1, and H3K4me3 ChIP-sequencing results. (f) k-means clustering of Ring1b NPC enriched peaks on Ring1b, Suz12, H3K27me3, H3K4me1, and H3K4me3 ChIP-sequencing results. (g) Read per kilobase per million mapped reads (RPKM) values for genes located nearby Ring1b peaks from each of the four clusters identified in (f). For all box plots: midline, median; box limits, 25th percentile (first quartile) and 75th percentile (third quartile); upper whisker, min(max(x)), third quartile + 1.5× interquartile range (IQR; third-quartile minus first-quartile values); lower whisker, max(min(x)), first quartile − 1.5× IQR.
Figure 6
Figure 6. Overexpression of NPC-enriched PRC1 subunits can affect genomic localization of Ring1b
(a) Stoichiometry values for Cbx proteins bound to Ring1b in mock or Cbx4-transfected Ring1b-GFP BAC ESCs. Data are shown as mean ± s.d. (n = 3 pulldowns) (b) Western blots of Ring1b co-immunoprecipitations in mock or Pcgf4-transfected ESCs. Uncropped blots appear in Supplementary Data Set 1. (c-d) ChIP-qPCR of Ring1b, IgG, and histone H3 at 2 NPC-enriched loci (c) and at 2 ESC-enriched loci (d) in mock, Cbx4 or Pcgf4-transfected ESCs. Data shown are from one representative ChIP (n = 3 ChIPs) and graphed as mean ± s.d. (n = 3 technical replicates). (e) qRT-PCR analysis of gene expression levels in mock, Cbx4 or Pcgf4-transfected ESCs. Data shown are from one representative transfection (n = 3 transfections) and graphed as mean ± s.d. (n = 3 technical replicates).

References

    1. Laugesen A, Helin K. Chromatin repressive complexes in stem cells, development, and cancer. Cell Stem Cell. 2014;14:735–51. - PubMed
    1. Montavon T, Duboule D. Chromatin organization and global regulation of Hox gene clusters. Philos Trans R Soc Lond B Biol Sci. 2013;368:20120367. - PMC - PubMed
    1. Simon JA, Kingston RE. Occupying chromatin: Polycomb mechanisms for getting to genomic targets, stopping transcriptional traffic, and staying put. Mol Cell. 2013;49:808–24. - PMC - PubMed
    1. Di Croce L, Helin K. Transcriptional regulation by Polycomb group proteins. Nat Struct Mol Biol. 2013;20:1147–55. - PubMed
    1. Wang H, et al. Role of histone H2A ubiquitination in Polycomb silencing. Nature. 2004;431:873–8. - PubMed

Publication types

MeSH terms