. 2016 Jun 13:6:27915.
doi: 10.1038/srep27915.

Calcineurin inhibitors cyclosporine A and tacrolimus induce vascular inflammation and endothelial activation through TLR4 signaling

Affiliations

Calcineurin inhibitors cyclosporine A and tacrolimus induce vascular inflammation and endothelial activation through TLR4 signaling

Raquel Rodrigues-Diez et al. Sci Rep. .

Abstract

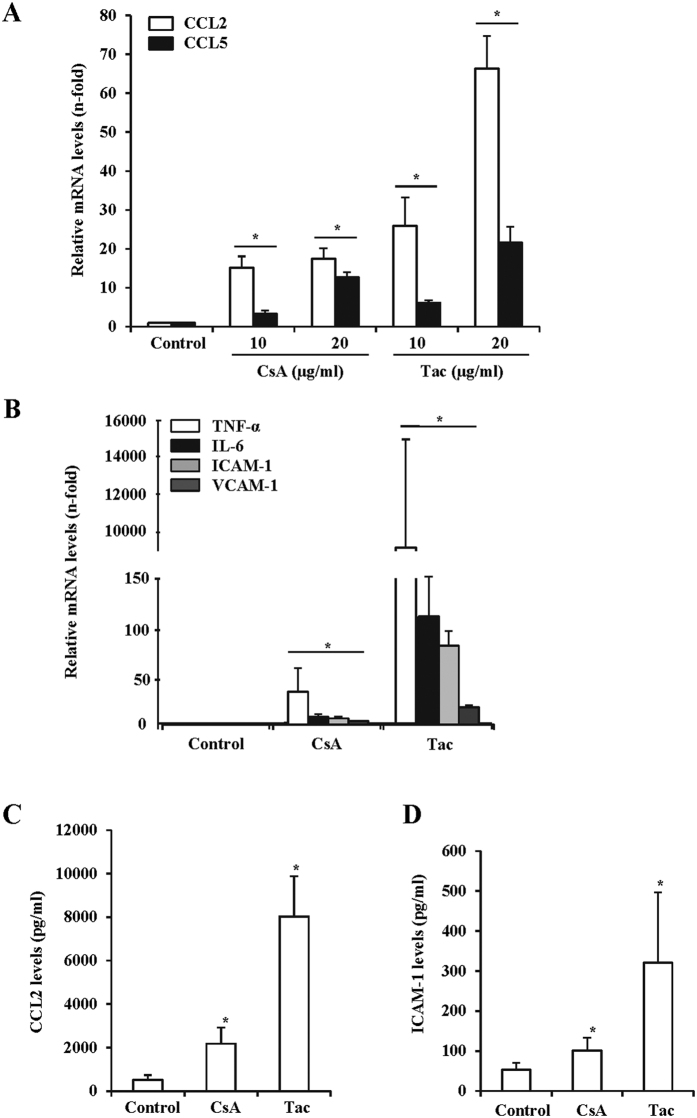
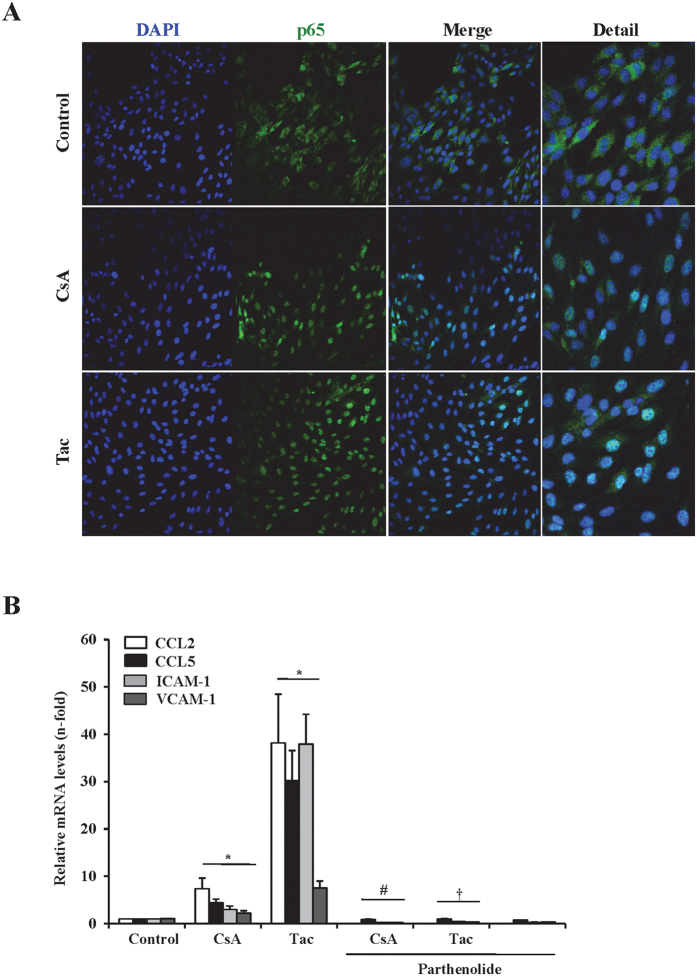
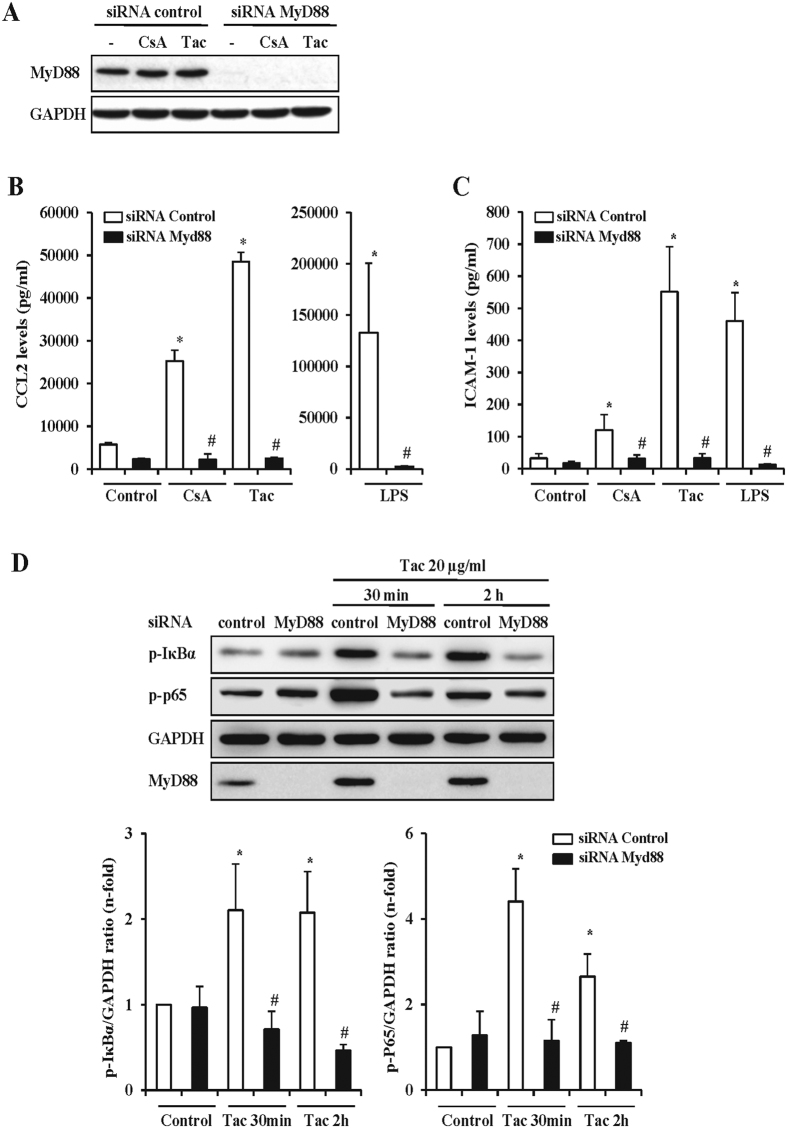
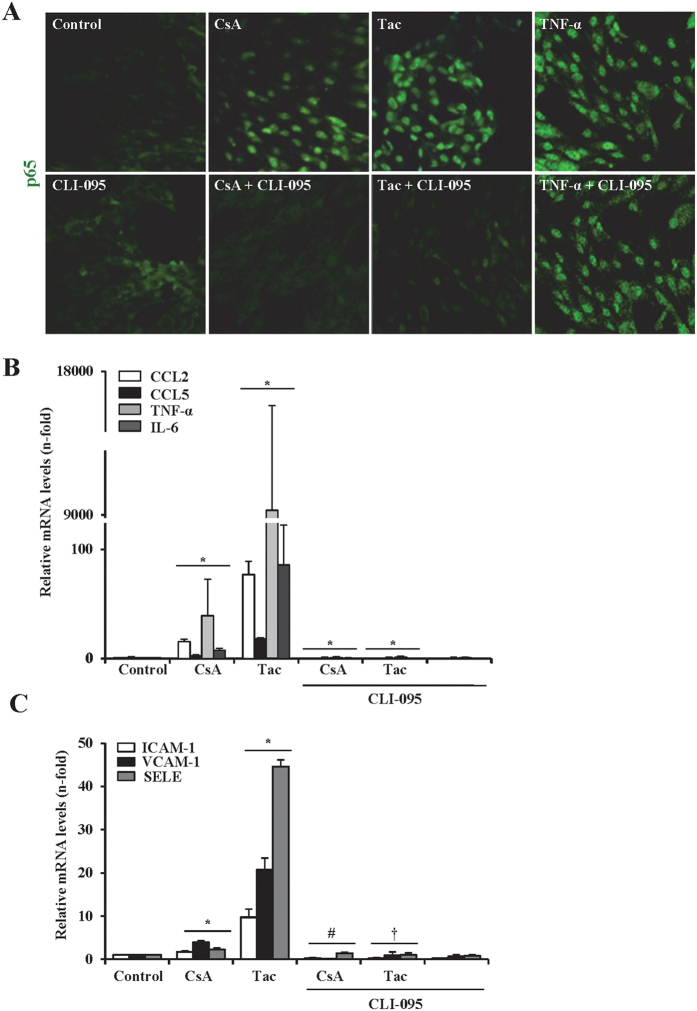
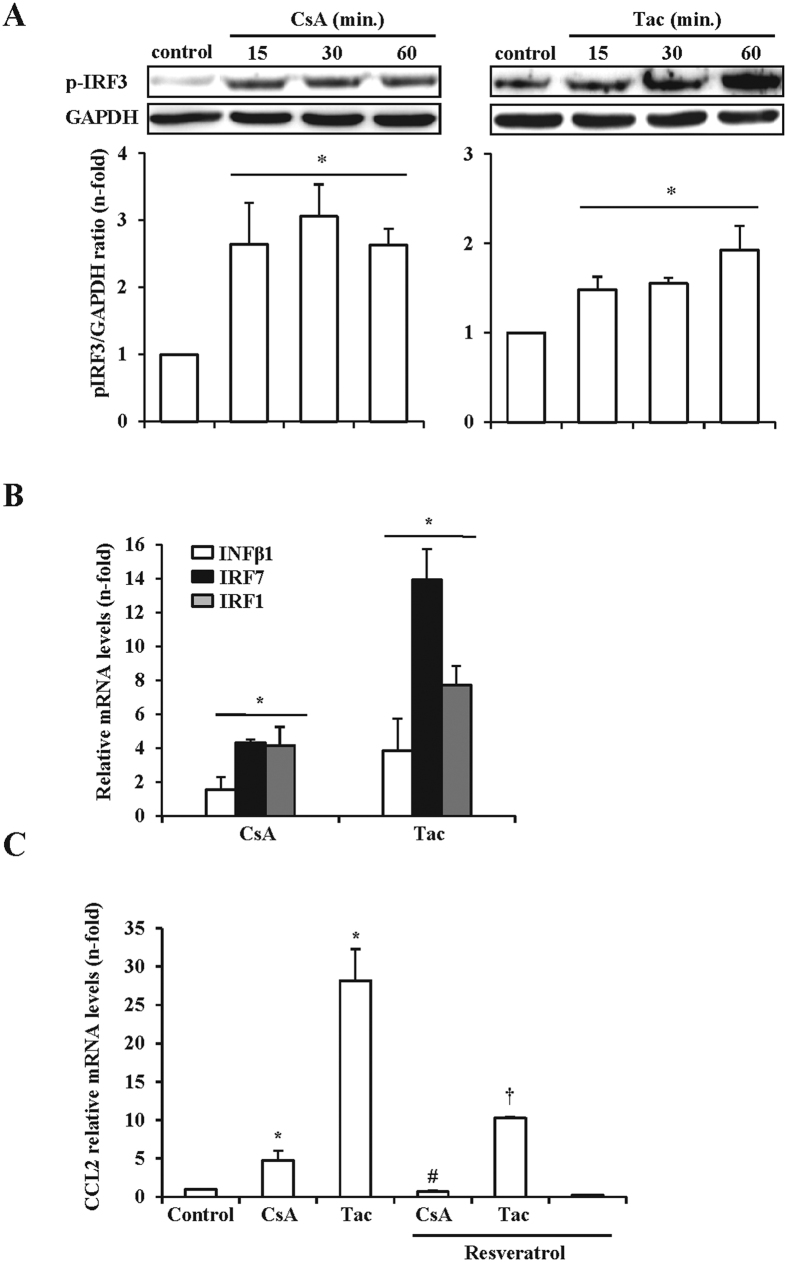
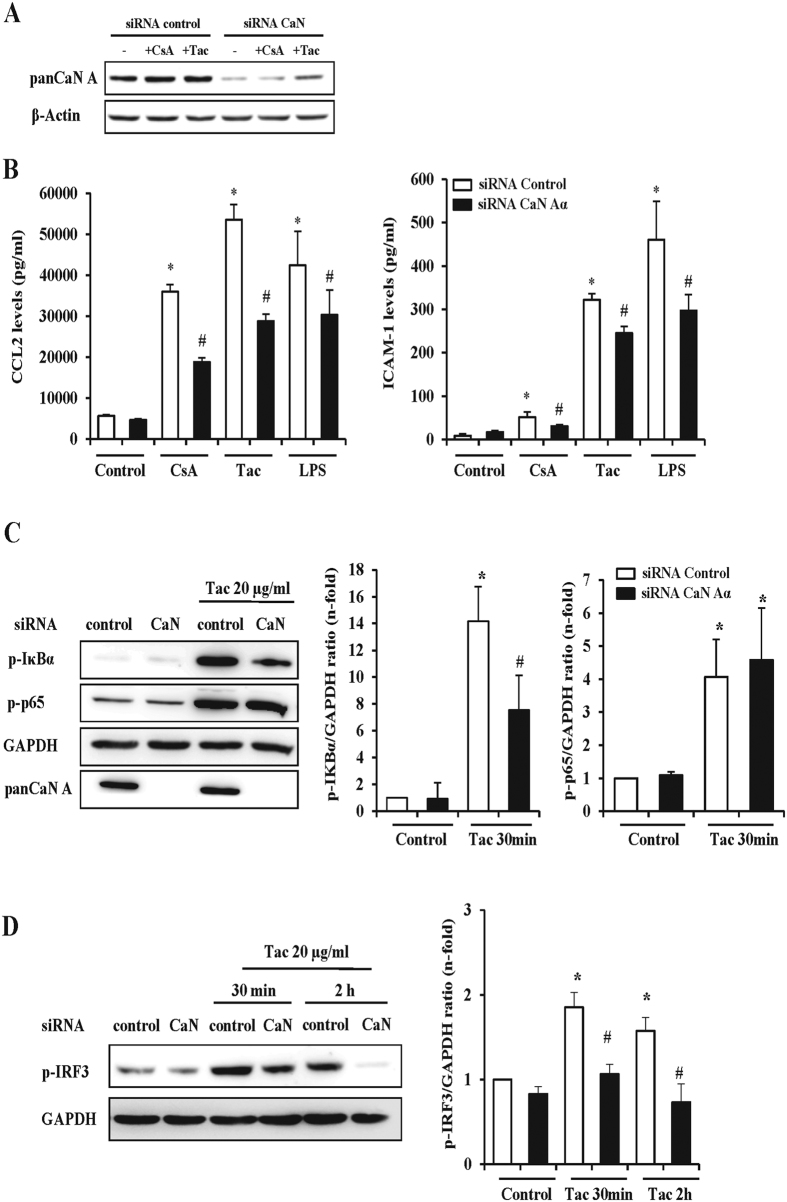
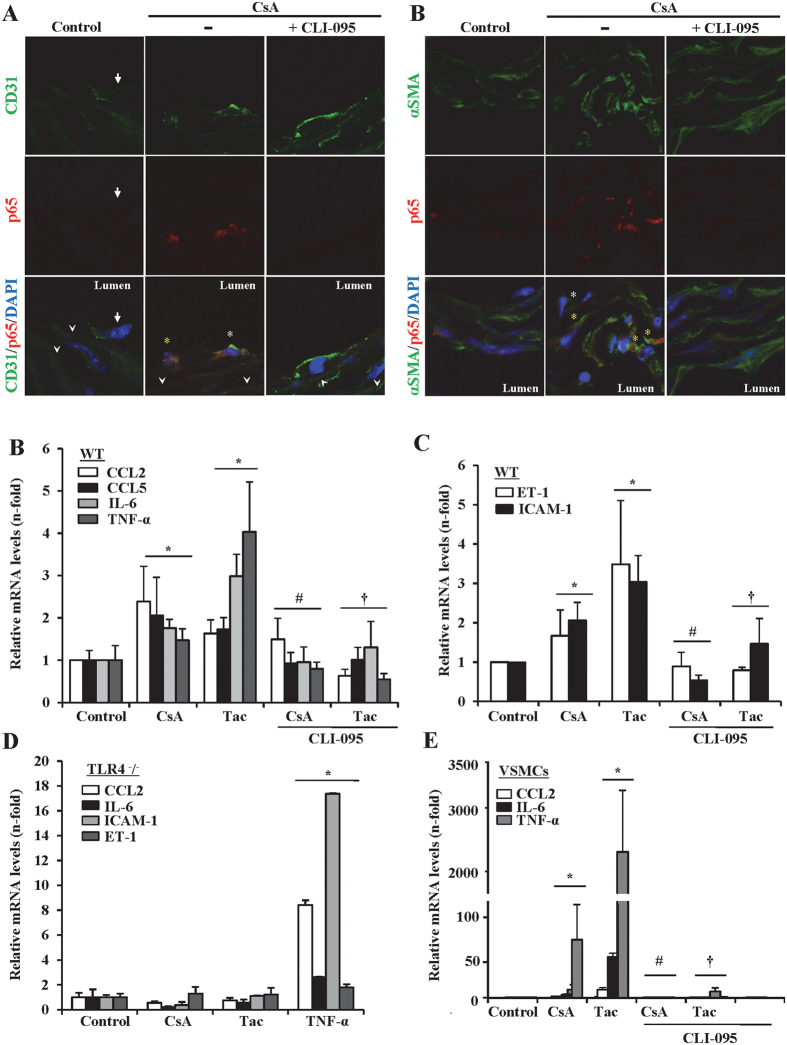
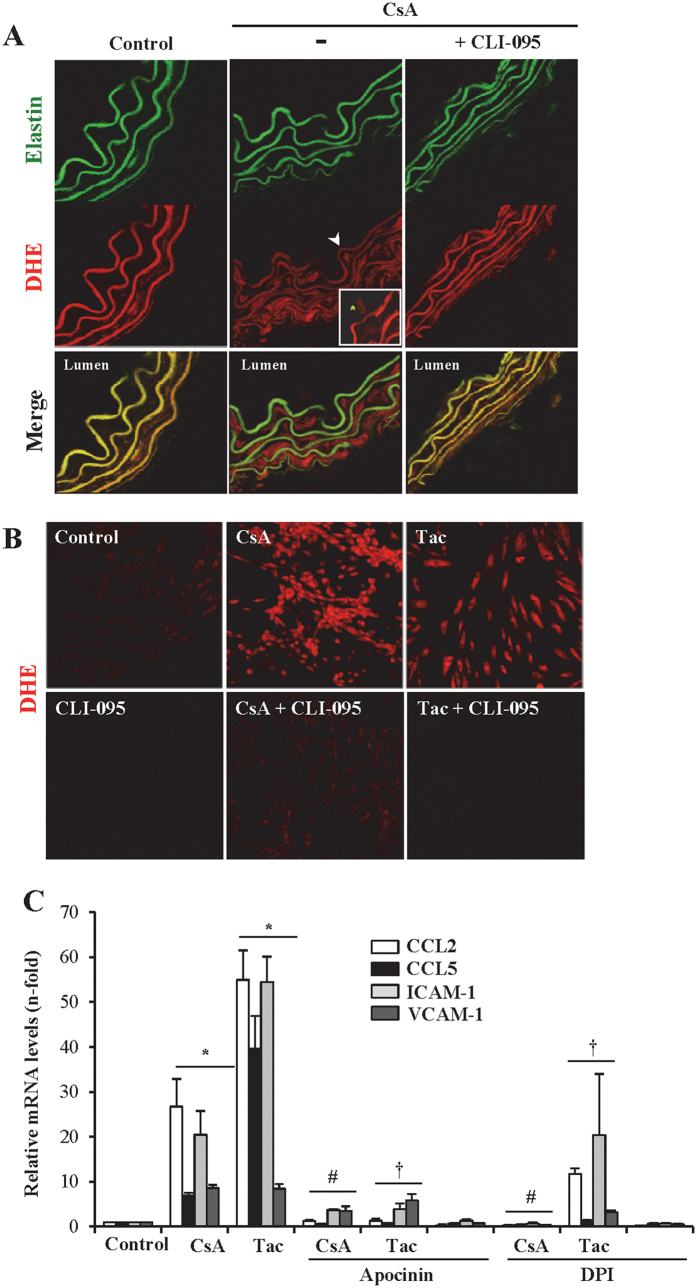
The introduction of the calcineurin inhibitors (CNIs) cyclosporine and tacrolimus greatly reduced the rate of allograft rejection, although their chronic use is marred by a range of side effects, among them vascular toxicity. In transplant patients, it is proved that innate immunity promotes vascular injury triggered by ischemia-reperfusion damage, atherosclerosis and hypertension. We hypothesized that activation of the innate immunity and inflammation may contribute to CNI toxicity, therefore we investigated whether TLR4 mediates toxic responses of CNIs in the vasculature. Cyclosporine and tacrolimus increased the production of proinflammatory cytokines and endothelial activation markers in cultured murine endothelial and vascular smooth muscle cells as well as in ex vivo cultures of murine aortas. CNI-induced proinflammatory events were prevented by pharmacological inhibition of TLR4. Moreover, CNIs were unable to induce inflammation and endothelial activation in aortas from TLR4(-/-) mice. CNI-induced cytokine and adhesion molecules synthesis in endothelial cells occurred even in the absence of calcineurin, although its expression was required for maximal effect through upregulation of TLR4 signaling. CNI-induced TLR4 activity increased O2(-)/ROS production and NF-κB-regulated synthesis of proinflammatory factors in cultured as well as aortic endothelial and VSMCs. These data provide new insight into the mechanisms associated with CNI vascular inflammation.


Figures

Figure 1
Figure 1. CNIs induce the expression of inflammatory mediators and endothelial activation markers in murine endothelial cells.
The expression of proinflammatory cytokines and endothelial activation markers was evaluated in murine endothelial cells exposed to cyclosporine (CsA) or tacrolimus (Tac). (A) Dose-dependent CCL2 and CCL5 mRNA expression in cells treated for 6 h with 10–20 μg/ml CsA or Tac, assessed by qRT-PCR. (B) TNF-α, IL-6, ICAM-1 and VCAM-1 mRNA expression in cells treated with 10 μg/ml CsA and 20 μg/ml Tac, qRT-PCR. (C,D) CCL2 (C) or ICAM-1 (D) protein levels assessed by ELISA in supernatants from cells stimulated with 10 μg/ml CsA, 20 μg/ml Tac or vehicle (Control). Data represent the mean ± SEM of three independent experiments. *p ≤ 0.05 vs control.
Figure 2
Figure 2. Proinflammatory responses elicited by CNIs in endothelial cells depend on NF-κB activation.
(A) Representative confocal microscopy immunofluorescence images showing NF-κB/p65 (green) nuclear translocation in cells stimulated for 30 min with 10 μg/ml CsA and 20 μg/ml Tac. Nuclei were counterstained with or with 4′,6-diamino-2-fenilindol (DAPI) (blue). Original magnification x400. (B) Addition of the NF-κB inhibitor parthenolide 1 h before stimuli, abolished the CsA or Tac-induced CCL2, CCL5, ICAM-1 and VCAM-1 mRNA upregulation at 6 h. Mean ± SEM of three independent experiments. *p ≤ 0.05 vs control; #p ≤ 0.05 vs CsA, p ≤ 0.05 vs Tac.
Figure 3
Figure 3. CNI-induced proinflammatory responses in endothelial cells depend on MyD88 signaling.
(A) The overall efficiency of the transfection procedure was assessed by detection of MyD88 expression by western blot in total protein extracts from cells transfected with a scramble siRNA (sc-siRNA) or with a MyD88 siRNA (MyD88-siRNA). After transfection, cells were stimulated with vehicle, CsA or Tac for 24 h. The figure is a representative experiment showing an almost undetectable expression of MyD88 in MyD88-siRNA transfected cells compared to expression levels in cells transfected with the sc-siRNA. CsA or Tac did not significantly change MyD88 expression. β-actin was used as protein loading control. (B,C) Secretion of CCL2 and ICAM-1 was evaluated by ELISA in supernatants from control cells or from sc-siRNA or MyD88-siRNA transfected cells stimulated with CsA, Tac or vehicle for 24 h. Functional efficiency of MyD88 silencing was assessed in cells stimulated for 24 h with 1 μg/ml LPS, used as a control. Bar graphs represent the Mean ± SEM of a set of six independent experiments. (D) Activation of the MyD88-dependent NF-κB pathway assessed by phosphorylated IκBα (p-IκBα) and RelA/p65 (p-p65) levels in total protein extracts from sc-siRNA or MyD88-siRNA MS1 transfected cells treated with 20 μg/ml Tac. Image shows representative western blots of p-IκBα and p-p65 from sets of four independent experiments for each protein and the corresponding quantification bar graphs depict the mean ± SEM. A control western blot showing the lack of MyD88 expression in this experiment is also showed at the figure bottom. GAPDH was used as protein loading control. *p < 0.05 vs control (siRNA control); #p < 0.05 vs CsA or Tac (siRNA-MyD88).
Figure 4
Figure 4. Pharmacological inhibition of TLR4 blocked proinflammatory responses induced by CsA and tacrolimus in endothelial cells.
Cells were incubated with 10 μg/ml CsA or 20 μg/ml Tac alone or in the presence of the TLR4 inhibitor, CLI095 (added 6 h before the CNIs). (A) Activation of NF-κB was assessed through the nuclear translocation of the NF-κB/p65 subunit detected by immunofluorescence confocal microscopy. Control cells show a cytoplasmic NF-κB/p65 staining (green) whereas in cells stimulated with CsA or Tac, NF-κB/p65 was mostly located inside nuclei. By contrast, the TLR4 inhibitor CLI-095 prevented nuclear translocation of NF-κB/p65. Cells were also stimulated with TNF-α (30 ng/ml) alone as a positive control of NF-κB activation or preincubated with CLI-095 to prove that TLR4 inhibition does not interfere with TNF-α-mediated NF-κB/p65 translocation. (B,C) Transcriptional levels of proinflammatory cytokines (CCL2, CCL5, TNF-α, IL-6) (A) and endothelial activation markers (ICAM-1, VCAM1, SELE) (B) were evaluated by qRT-PCR. Data are mean ± SEM of three independent experiments. *p ≤ 0.05 vs control; #p ≤ 0.05 and p ≤ 0.05 vs CsA or Tac, respectively.
Figure 5
Figure 5. CsA and tacrolimus activate the TLR4/TRIF-dependent signaling pathway in endothelial cells.
Cells were treated with CsA or Tac as in the preceding figures. (A) Representative western blots of the phosphorylated IRF3 (p-IRF3) using total protein extracts from cells treated with CsA or Tac for 15 to 60 min. Bar graphs represent the mean ± SEM from three independent experiments. *p ≤ 0.05 vs control. (B) Activity of the TRIF pathway was assessed by qRT-PCR quantification of IRF3 target gene (INFβ1, IRF7, IRF1) mRNA in cells stimulated with CsA or Tac for 6 h. Data expressed as mean ± SEM of fold-change over control of at least three independent experiments. *p ≤ 0.05 vs control. (C) TRIF pathway and proinflammatory response. Cells were stimulated with CsA or Tac for 6 h following pretreatment with 50 μM resveratrol. CCL2 mRNA expression was assessed by qRT-PCR. Bar graph represents mean ± SEM from three independent experiments. *p ≤ 0.05 vs control; #p ≤ 0.05 vs CsA, p ≤ 0.05 vs Tac.
Figure 6
Figure 6. CNI proinflammatory activity in endothelial cells is partially dependent on calcineurin.
Cells were transfected with a control scrambled siRNA (sc-RNA) of with a specific calcineurin siRNA (CaN-siRNA) and then stimulated with CsA or Tac to assess the efficiency of the silencing procedure (A), the magnitude of the overall proinflammatory response (B) or the activation of NF-κB signaling (C). (A) Representative western blot showing calcineurin expression in control sc-siRNA or in CaN-siRNA cells stimulated with vehicle, CsA or Tac for 24 h. β-actin was used as protein loading control. (B) CCL2 and ICAM-1 ELISA in supernatants of sc-siRNA or CaN-siRNA transfected cells stimulated with CsA or Tac for 24 h. As positive control for TLR4 signaling cells were also stimulated with 1 μg/ml LPS. Quantification graphs represent the mean ± SEM of six independent experiments. *p < 0.05 vs sc-siRNA; #p < 0.05 vs Calcineurin-siRNA. (C) Comparative levels of calcineurin, phosphorylated IκBα (p-IκBα) and NF-κB/p65 (p-p65) in control, sc-siRNA or in CaN-siRNA transfected cells stimulated with Tac for 24 h. Image shows representative western blots from three independent experiments and the corresponding quantification bar graph. *p < 0.05 vs control (siRNA control); #p < 0.05 vs CsA or Tac (siRNA-Calcineurin). GAPDH was used as protein loading control.
Figure 7
Figure 7. CNI induce inflammation in wild-type aortas but not in aortas from TLR4−/− mice.
Aorta tissue segments extracted from wild-type or TLR4−/− C57BL/6 mice were stimulated for 6 h with 10 μg/ml CsA or 20 μg/ml Tac. CLI-095 was added 6 h before stimulation with the CNIs. (A,B) Confocal microphotographs showing NF-κB/p65 content and location in control or CsA or CsA plus CLI-095 treated aortic sections from wild-type mice. Activation of NF-κB/p65 was detected by intensification of the specific red fluorescence in cytoplasm and nucleus of either endothelial cells recognized by CD31 staining (green fluorescence surrounding the cell borders) (A) or VSMC cells expressing αSMA (cytoplasmic green fluorescence) (B). Endothelial cells were found lining the intima layer and facing the lumen and VSMC located in the media layer. Yellow asterisks point cells with nuclear translocation of p65 and white asterisks indicate cells with increased cytoplasmic p65 expression. White arrows point endothelial and VSMC without increased expression of p65 in control or CLI095 treated aortas. White arrowheads in A show elastin fibers (green autofluorescence) which otherwise are not apparently visualized in B because the much higher αSMA specific fluorescence. Nuclei were counterstained with DAPI. Original magnification x630. (C,D) Gene expression of CCL2, CCL5, IL-6, TNF-α (left panel) and ICAM-1, ET-1(right panel) in cultured aorta sections from wild-type mice exposed to CsA or Tac alone or in the presence of CLI-095. Data are expressed as mean ± SEM of 4 samples. *p < 0.05 versus control non-stimulated aortas; #p < 0.05 vs CsA or Tac treated aortas. (E) Gene expression of CCL2, IL-6, ICAM-1 and ET-1 in cultured aorta sections from TLR4−/− mice exposed to CsA, Tac or TNF-α. Data are the mean ± SEM of 4 samples. *p < 0.05 versus control non-stimulated aortas. (F) CCL2, IL-6 and TNF-α mRNA expression in VSMC stimulated for 6 h with 10 μg/ml CsA or 20 μg/ml Tac alone or pretreated with vehicle or CLI-095. Data represent the mean ± SEM of at least three independent experiments. *p ≤ 0.05 vs control; #p ≤ 0.05 and p ≤ 0.05 vs CsA or Tac alone, respectively.
Figure 8
Figure 8. Activation of the TLR4 pathway by CsA and tacrolimus increases the production of O2/ROS as inflammation mediator in aorta and endothelial cells.
(A) Confocal photomicrographs of aortic tissue sections treated with 10 μg/ml CsA for 6 h showing an increased O2/ROS production measured as DHE staining (red fluorescence). Elastin auotofluorescence (green) shows the structure of the artery that contrast with the red fluourescence indicating that O2/ROS was mainly located in VSMCs (media layer) and also in endothelial cells (intima layer). White arrowhead shows DHE positive VSMCs and asterisk point DHE positive endothelial cells, which are showed at a larger augment (inset). Aortas subjected to pharmacological TLR4 inhibition with CLI-095 show a lesser DHE staining. Original magnification x630. (B) Representative confocal photomicrographs of O2/ROS production measured as DHE positive staining in murine endothelial MS1 cells treated with 10 μg/ml CsA (A) or 20 μg/ml Tac for 6 h. Cells subjected to pretreatment with CLI-095 before CsA or Tac stimulation exhibit a basal DHE staining after treatment with CsA or Tac. (D) Gene expression of proinflammatory factors and adhesion molecules (CCL2, CCL5, VCAM-1 and ICAM-1) was assessed by PCR in MS1 cells treated with 10 μg/ml CsA (A) or 20 μg/ml Tac for 6 h, both in the presence or in the absence of the NADPH inhibitors Apocinin (10 mM) and DPI (10 μM) added 1 h before the stimuli. The bar chart represent the Media ± SEM of a set of three independent experiments. *p ≤ 0.05 vs control; #p ≤ 0.05 and p ≤ 0.05 vs CsA or Tac alone, respectively.

References

    1. Valantine H. Cardiac allograft vasculopathy after heart transplantation: risk factors and management. J Heart Lung Transplant. 23, S187–93 (2004). - PubMed
    1. Al-Massarani G. et al.. Impact of immunosuppressive treatment on endothelial biomarkers after kidney transplantation. Am J Transplant. 8, 2360–7 (2008). - PubMed
    1. Mitchell R. N. Graft vascular disease: immune response meets the vessel wall. Annu Rev Pathol. 4, 19–47 (2009). - PubMed
    1. Jiang X., Sung Y. K., Tian W., Qian J., Semenza G. L. & Nicolls M. R. Graft microvascular disease in solid organ transplantation. J Mol Med (Berl). 92, 797–810 (2014). - PMC - PubMed
    1. Navarro-Antolín J. et al.. Role of peroxynitrite in endothelial damage mediated by Cyclosporine A. Free Radic Biol Med. 42, 394–403 (2007). - PubMed

Publication types

MeSH terms