. 2016 Jun;13(6):979-85.
doi: 10.1513/AnnalsATS.201602-107CC.

Severe, Rapidly Reversible Hypoxemia in the Early Period after Bilateral Lung Transplantation

Affiliations

Severe, Rapidly Reversible Hypoxemia in the Early Period after Bilateral Lung Transplantation

Ankur Mishra et al. Ann Am Thorac Soc. 2016 Jun.
No abstract available


Figures

Figure 1.
Figure 1.
Perfusion scan immediately after bilateral lung transplantation. Perfusion is identified in bilateral transplanted lungs, with slight heterogeneity of perfusion at the lung base. The right-to-left perfusion ratio based on the anterior view was estimated at 60–40%. These findings suggest intact vascular anastomoses without complications.
Figure 2.
Figure 2.
(A) Chest radiograph performed immediately after transplantation, showing mild diffuse bilateral infiltrates, consistent with moderate primary graft dysfunction. (B) Subsequent chest radiograph, showing no acute changes.
Figure 3.
Figure 3.
Effects of ventilation–perfusion (V./Q.) relationships on oxygen exchange in a two-compartment lung under (A) ideal or perfect conditions, (B) V./Q. mismatch (absent ventilation in one compartment with V./Q. = 0, consistent with right-to-left shunt) with hypoxic pulmonary vasoconstriction, (C) V./Q. mismatch (absent ventilation in one compartment with V./Q. = 0, consistent with right-to-left shunt) without hypoxic pulmonary vasoconstriction, and (D) V./Q. mismatch (absent ventilation in one compartment with V./Q. = 0, consistent with right-to-left shunt) without hypoxic pulmonary vasoconstriction in the setting of low mixed venous Po2. Values for total ventilation (V.), inspired oxygen tension (PiO2), total cardiac output (Q.), and mixed venous oxygen concentration (CmvO2), tension (PmvO2), and hemoglobin saturation (SmvO2) shown in (A) were the same for all conditions, except for (D), as indicated. Compartmental ventilation (V.1, V.2), perfusion (Q.1, Q.2), ventilation–perfusion ratio (V.1/Q.1, V.2/Q.2), the resulting systemic arterial oxygen concentration (CaO2, calculated as the perfusion-weighted mean of the oxygen concentrations in blood flowing from each compartment), and corresponding systemic arterial oxyhemoglobin saturation (SaO2) and oxygen tension (PaO2) are also indicated for each condition. For simplicity, oxygen concentrations were calculated as the product of hemoglobin concentration (15 g/dl), hemoglobin oxygen–binding capacity (1.34 vol% per g/dl), and oxyhemoglobin saturation, and ignore the concentration of oxygen physically dissolved in plasma, which would be small at these oxygen tensions. Vol% indicates milliliters of oxygen (STPD) per 100 ml of blood. Reproduced by permission from Reference . HPV = hypoxic pulmonary vasoconstriction.
Figure 4.
Figure 4.
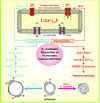
The role of K+ channels and voltage-dependent Ca2+ channels in membrane depolarization (membrane potential, Em) and pulmonary vasoconstriction. When K+ channels are closed, the resulting membrane depolarization opens voltage-dependent Ca2+ channels (VDCCs), promotes Ca2+ influx, increases [Ca2+] in the cytosol, and causes vasoconstriction. When K+ channels are activated the resulting membrane hyperpolarization closes VDCCs, inhibits agonist-mediated Ca2+ influx, and causes vasodilation. [Ca2+]cyt = Ca2+ concentration in the cytosol; PASMC = pulmonary artery smooth muscle cell. Reproduced by permission from Reference .
Figure 5.
Figure 5.
Pulmonary vascular resistance (PVR) during left lower lobe (LLL) normoxia and LLL hypoxia with and without nicardipine at 1, 3 or 6 µg/kg/min. Data are expressed as means ± SEM (n = 7). Significant change from LLL normoxia at same dose of nicardipine: ††P < 0.01. Significant change from control LLL hypoxia: §§P < 0.01. Reproduced by permission from Reference .

References

    1. Sylvester JT, Shimoda LA, Aaronson PI, Ward JP. Hypoxic pulmonary vasoconstriction. Physiol Rev. 2012;92:367–520. - PMC - PubMed
    1. Swenson ER. Hypoxic pulmonary vasoconstriction. High Alt Med Biol. 2013;14:101–110. - PubMed
    1. Robin ED, Theodore J, Burke CM, Oesterle SN, Fowler MB, Jamieson SW, Baldwin JC, Morris AJ, Hunt SA, Vankessel A, et al. Hypoxic pulmonary vasoconstriction persists in the human transplanted lung. Clin Sci (Lond) 1987;72:283–287. - PubMed
    1. von Euler US, Liljestrand G. Observations on the pulmonary arterial blood pressure in the cat. Acta Physiol Scand. 1946;12:301–320.
    1. Kregenow DA, Swenson ER. The lung and carbon dioxide: implications for permissive and therapeutic hypercapnia. Eur Respir J. 2002;20:6–11. - PubMed

LinkOut - more resources