. 2016 Jun 13:6:28039.
doi: 10.1038/srep28039.

Tumour endothelial cells in high metastatic tumours promote metastasis via epigenetic dysregulation of biglycan

Affiliations

Tumour endothelial cells in high metastatic tumours promote metastasis via epigenetic dysregulation of biglycan

Nako Maishi et al. Sci Rep. .

Abstract

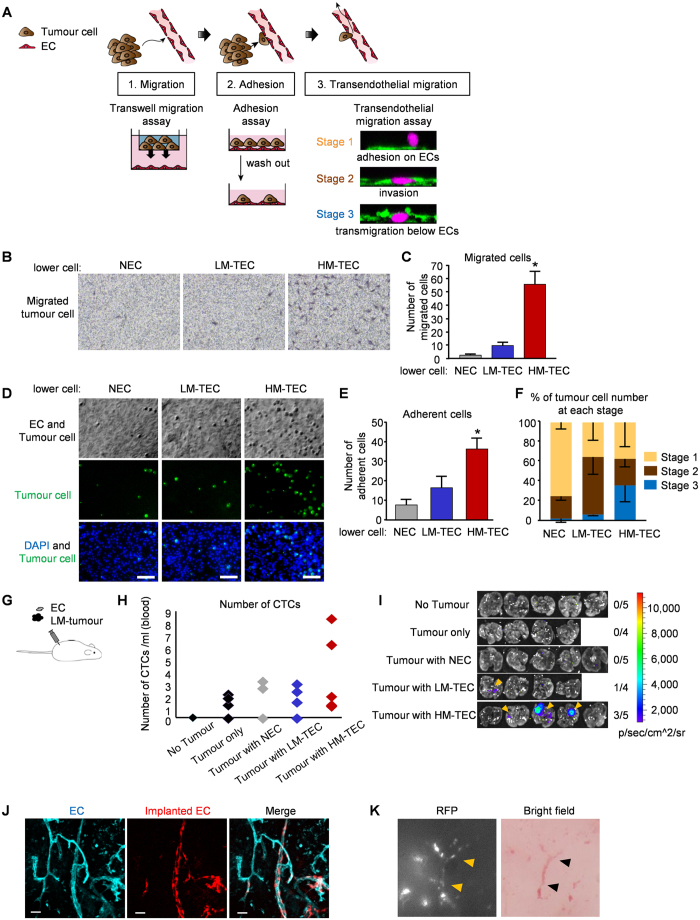
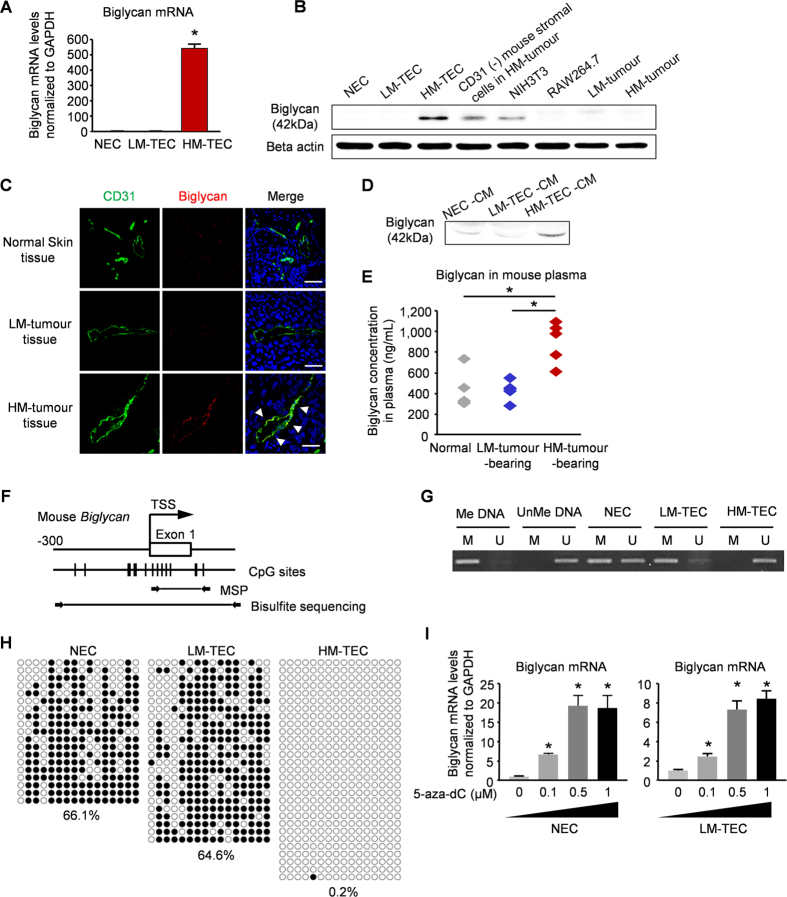
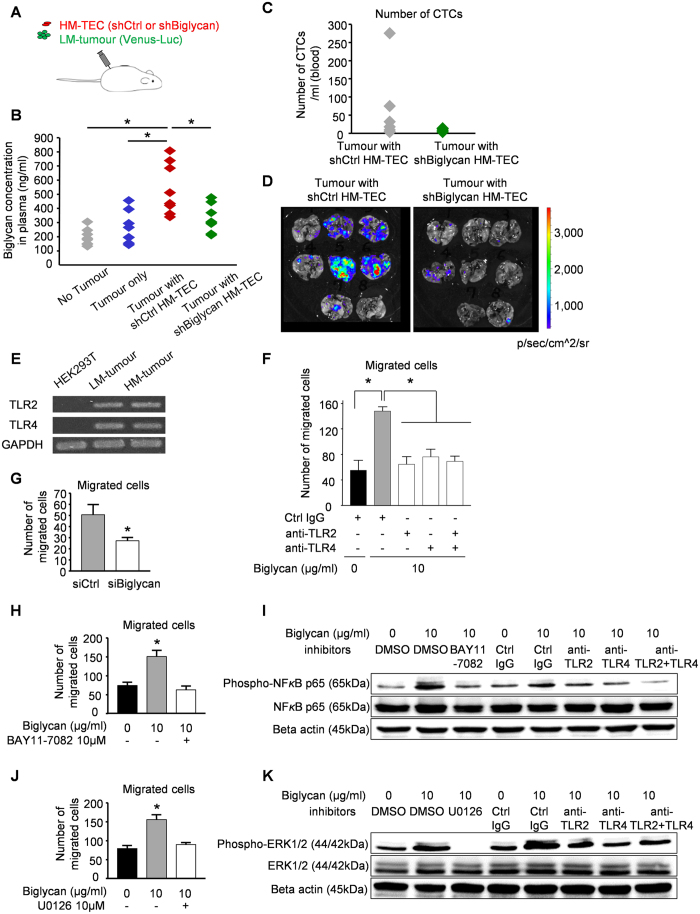
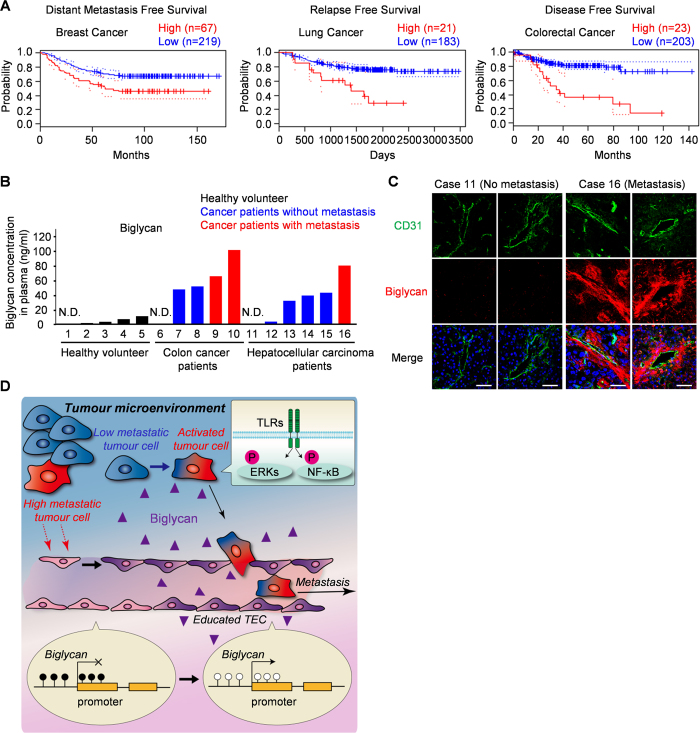
Tumour blood vessels are gateways for distant metastasis. Recent studies have revealed that tumour endothelial cells (TECs) demonstrate distinct phenotypes from their normal counterparts. We have demonstrated that features of TECs are different depending on tumour malignancy, suggesting that TECs communicate with surrounding tumour cells. However, the contribution of TECs to metastasis has not been elucidated. Here, we show that TECs actively promote tumour metastasis through a bidirectional interaction between tumour cells and TECs. Co-implantation of TECs isolated from highly metastatic tumours accelerated lung metastases of low metastatic tumours. Biglycan, a small leucine-rich repeat proteoglycan secreted from TECs, activated tumour cell migration via nuclear factor-κB and extracellular signal-regulated kinase 1/2. Biglycan expression was upregulated by DNA demethylation in TECs. Collectively, our results demonstrate that TECs are altered in their microenvironment and, in turn, instigate tumour cells to metastasize, which is a novel mechanism for tumour metastasis.


Figures

Figure 1
Figure 1. HM-TECs promote tumour cell intravasation and metastasis.
(A) Schematic of the steps involved during tumour intravasation: migration, adhesion and transendothelial migration. (B,C) LM-tumour cells that migrated to the underside of the membrane were photographed (B) and counted (C). (*P < 0.01 versus LM-TECs and NECs, one-way ANOVA. Data are mean ± SD, n = 6 fields). (D) Representative photomicrographs of bright-field (upper panels) and fluorescence (middle panels) microscopic images of adherent tumour cells on EC monolayers after co-culture for 30 min. Merged images of adherent tumour cells (green) and DAPI (blue) are also shown in lower panels. Scale bar = 100 μm. (E) Adherent tumour cells with a FITC-anti-human HLA antibody were counted (*P < 0.01 versus LM-TECs and NECs, one-way ANOVA. Data are mean ± SD, n = 6 fields). (F) Tumour cells at each stage were counted and plotted as a percentage of total cells (Data are mean ± SD, n = 3 independent experiments). (G) Schematic illustration of experimental methods. LM-tumour cells were co-xenografted with one type of EC (HM-TECs, LM-TECs, or NECs) into nude mice (n = 4 or 5). (H) Circulating RFP-positive tumour cell numbers were determined by flow cytometry (n = 4 or 5). (I) Tumour cell luminescence intensity in the lungs (arrowhead) was detected using IVIS Spectrum. (J) All blood vessels in tumours were visualized by Alexa Fluor 647-GS-1B4 lectin (cyan). Specimens were observed under a fluorescence microscope. Of note, implanted TECs (red) were connected to host ECs. Arrowhead indicates co-localization. Scale bar = 20 μm. (K) Tumour vessels were imaged using a fluorescence stereomicroscope. A fluorescence image (left) and a bright-field image (right) show that the vasculatures comprising implanted ECs (expressing RFP) and containing red blood cells. Arrowheads indicate co-localization.
Figure 2
Figure 2. HM-TECs express and secrete biglycan via demethylation of its promoter.
(A) Biglycan expression was evaluated by real-time PCR (*P < 0.01 versus LM-TECs and NECs, one-way ANOVA. Data are mean ± SD, n = 4 real-time RT-PCR runs). (B) Biglycan protein levels in various cells were analysed by western blotting. (C) Biglycan expression in tumours dissected from mouse and normal dermal tissues. Arrowhead indicates CD31 and biglycan co-localization. Scale bar = 50 μm. (D) Biglycan protein in conditioned medium (CM) from each type of EC was analysed by western blotting. (E) Plasma biglycan levels were determined by ELISA for each mouse group (*P < 0.01 versus Normal and LM-tumour-bearing, one-way ANOVA. Data are mean ± SD, n = 5). (F) A schematic diagram of the CpG sites in the mouse biglycan promoter; vertical ticks indicate CpG sites; arrowheads indicate the specific primers used for MSP and bisulfite sequencing analyses. (G) A representative image of the MSP analysis of the biglycan promoter. Me DNA, methylated control DNA; UnMe DNA, unmethylated control DNA; M, methylated PCR product; U, unmethylated PCR product. (H) Bisulfite sequencing analysis of the biglycan promoter in ECs. The white and black circles indicate unmethylated and methylated CpG dinucleotides, respectively. The results are from at least 19 individually sequenced clones. Quantification of DNA methylation is shown. (I) Relative biglycan mRNA levels in NECs and LM-TECs treated with 5-aza-dC at the indicated doses [*P < 0.01 versus 5-aza-dC (0 μM), one-way ANOVA. Data are represented as mean ± SD, n = 4 real-time RT-PCR runs].
Figure 3
Figure 3. HM-TEC-derived biglycan induces tumour cell intravasation and metastasis through the activation of NF-κB and ERK Signalling via TLR2 and TLR4.
(A) LM-tumour cells were subcutaneously implanted along with HM-TECs transfected with shBiglycan or those transfected with control shRNA (shCtrl); n = 8. (B) Plasma biglycan levels were determined by ELISA for each mouse group (*P < 0.01 versus No Tumour, Tumour only and Tumour with shBiglycan HM-TEC, one-way ANOVA, n = 8). (C) The number of Venus-positive circulating tumour cells was analysed by flow cytometry (n = 8). See also Supplementary Fig. S3G. (D) Tumour cell luminescence intensity in the lungs was detected using IVIS Spectrum. (E) TLR2 and TLR4 mRNA expression levels in HM- and LM-tumour cells were determined by RT-PCR. (F) LM-tumour cell migration toward the biglycan protein at 10 μg/mL in the presence of an anti-TLR2 or anti-TLR4 antibody (10 μg/mL) was evaluated by a migration assay (*P < 0.01, one-way ANOVA. Data are represented as mean ± SD, n = 8 fields). (G) LM-tumour cell migration toward monolayers of TECs with or without biglycan knockdown (*P < 0.01 versus siCtrl, two-sided Student’s t-test. Data are mean ± SD, n = 6 fields). (H) LM-tumour cell migration toward the biglycan protein in the presence of 10 μM of the NF-κB inhibitor, BAY11-7082, was evaluated by a migration assay (*P < 0.01, one-way ANOVA. Data are represented as mean ± SD, n = 4 fields). (I) LM-tumour cells were preincubated with BAY11-7082 or anti-TLR2 and/or TLR4 antibodies. After stimulation of biglycan, cells were lysed and the levels of phospho-NF-κB were determined by western blotting. (J) LM-tumour cell migration toward biglycan in the presence of 10 μM of the MEK inhibitor, U0126, was evaluated by a migration assay (*P < 0.01, one-way ANOVA. Data are represented as mean ± SD, n = 4 fields). (K) LM-tumour cells were preincubated with U0126 or anti-TLR2 and/or TLR4 antibodies. After stimulation of biglycan, cells were lysed and the levels of phosphor-ERK1/2 were determined by western blotting.
Figure 4
Figure 4. Tumour blood vessels of patients with cancer express biglycan.
(A) Relationships between biglycan expression and the prognosis of patients with indicated cancer were investigated using the PrognoScan database (see also Table 1). Survival curves for high (red) and low (blue) expression groups divided at the optimal cutpoint are plotted. (B) Plasma biglycan levels were determined using ELISA for healthy volunteers (black columns), patients without metastatic cancer (blue columns) and patients with metastatic cancer (red columns). N.D., not detectable. (C) Representative tumour tissues were fixed, sectioned and stained with the anti-CD31 antibody (green) and the anti-biglycan antibody (red). Scale bar = 50 μm. See also Supplementary Fig. S3J. (D) Educated TECs affected by the tumour microenvironment of highly metastatic tumour cells provide a “gateway” for tumour cell metastasis.

Similar articles

Cited by

References

    1. Chambers A. F., Groom A. C. & MacDonald I. C. Dissemination and growth of cancer cells in metastatic sites. Nat Rev Cancer 2, 563–572 (2002). - PubMed
    1. Joyce J. A. & Pollard J. W. Microenvironmental regulation of metastasis. Nat Rev Cancer 9, 239–252 (2009). - PMC - PubMed
    1. Folkman J. Role of angiogenesis in tumor growth and metastasis. Semin Oncol 29, 15–18 (2002). - PubMed
    1. Weidner N., Semple J. P., Welch W. R. & Folkman J. Tumor angiogenesis and metastasis–correlation in invasive breast carcinoma. N Engl J Med 324, 1–8 (1991). - PubMed
    1. Fidler I. J. Angiogenic heterogeneity: regulation of neoplastic angiogenesis by the organ microenvironment. J Natl Cancer Inst 93, 1040–1041 (2001). - PubMed

MeSH terms