

doi: 10.1038/nmeth.3897.
Epub 2016 Jun 13.
Varying label density allows artifact-free analysis of membrane-protein nanoclusters
Affiliations
- PMID: 27295310
- PMCID: PMC6404959
- DOI: 10.1038/nmeth.3897
Item in Clipboard
Varying label density allows artifact-free analysis of membrane-protein nanoclusters
Nat Methods.
2016 Aug.
Abstract
We present a method to robustly discriminate clustered from randomly distributed molecules detected with techniques based on single-molecule localization microscopy, such as PALM and STORM. The approach is based on deliberate variation of labeling density, such as titration of fluorescent antibody, combined with quantitative cluster analysis, and it thereby circumvents the problem of cluster artifacts generated by overcounting of blinking fluorophores. The method was used to analyze nanocluster formation in resting and activated immune cells.
Conflict of interest statement
The authors declare no competing financial interests.
Figures
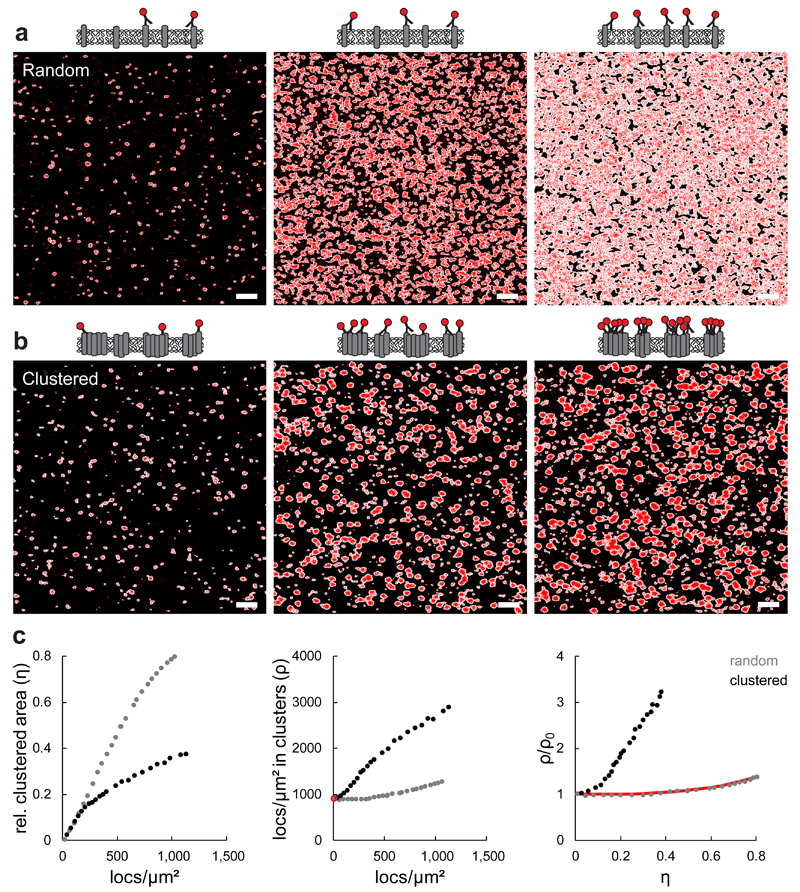
(a, b) Simulations of increasing numbers of randomly distributed (a) and clustered molecules (b), each yielding an average of seven localizations per molecule (red); the calculated cluster masks are shown in white. For clustered distributions we assumed cluster radii of 50 nm and 3 clusters/μm2. We simulated localization densities of ˜50 locs/μm² (left), ˜500 locs/μm² (center) and ˜1,000 locs/μm² (right). Scale bars correspond to 1 μm. (c) Quantification of the relative clustered area per image (η) and the density of localizations per clustered area (ρ); the plots show characteristic changes of η and ρ with increasing numbers of localizations (left and center), as well as a characteristic η-dependence of ρ/ρ0 (right). ρ0, which is used for normalization of ρ/η plots, is highlighted by a red circle (center). The red line indicates the reference curve for a random distribution.
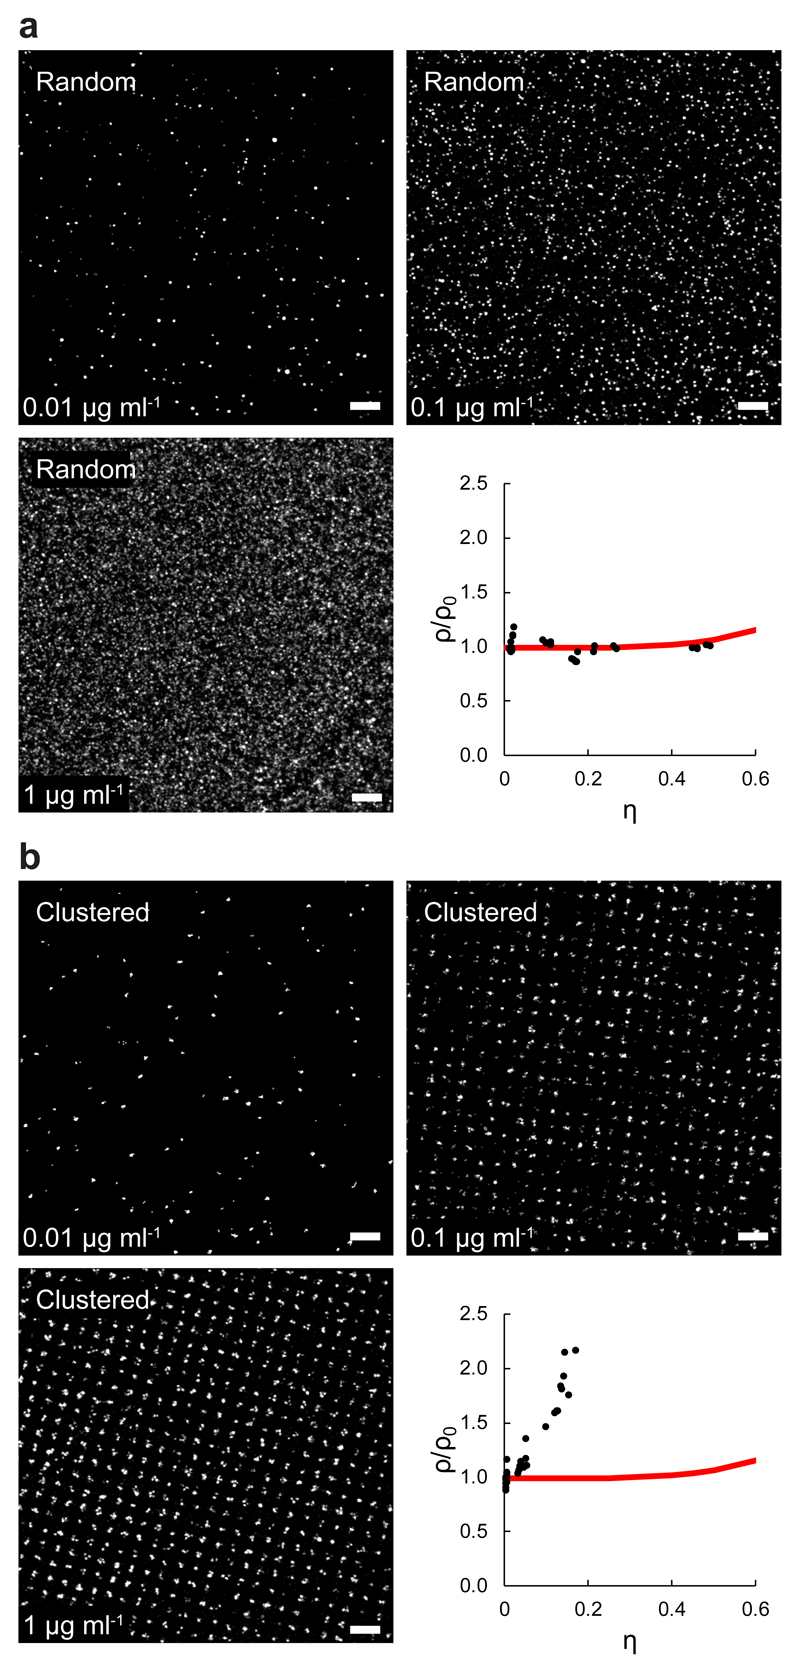
Streptavidin was adsorbed to glass surfaces either randomly (a) or as 200 nm-sized clusters via microcontact printing (b), and incubated with biotinylated murine IgG. The images show a titration series where the biotinylated IgG was detected via an AF647-conjugated IgG-specific antibody at the indicated concentrations. From reconstructed dSTORM localization maps ρ and η values were calculated for each image to generate normalized ρ/η plot (a, b bottom right, respectively). >10 images were recorded per titration step; each data point represents a single image. The red lines indicate the reference curve for a random distribution. Scale bars correspond to 1 μm.
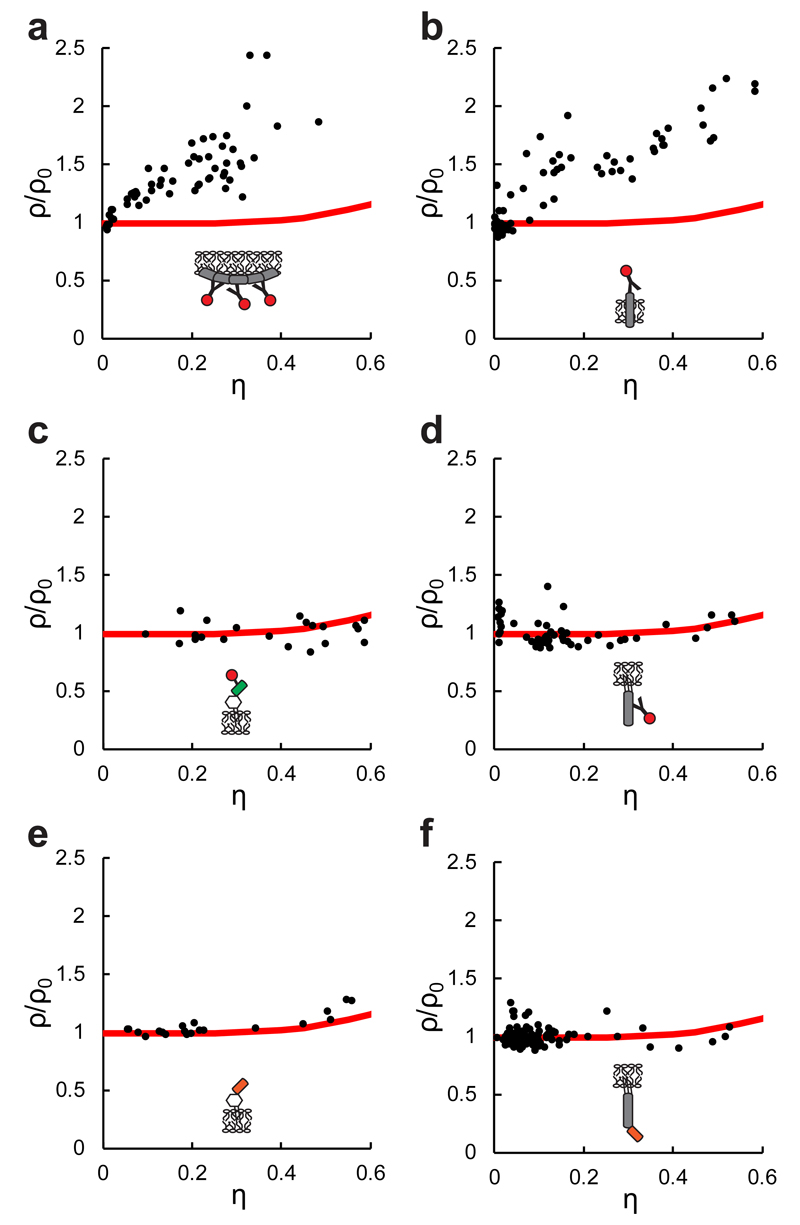
Label density variation for different membrane proteins yielded characteristic normalized ρ/η curves for each protein. (a-d) Cells were stained at different label concentrations and imaged via dSTORM: Jurkat T cells were labeled with anti-clathrin-HC-AF647 (a) or anti-LFA-1-AF647 (b). CHO cells expressing GPI-mGFP were labeled with GFP-Trap-AF647 (c). Jurkat T cells were labeled with anti-Lck-AF647 (d). (e, f) PALM was carried out at different expression levels of GPI-mEOS3.2 in CHO cells (e) or Lck-mEOS3.2 in JCaM1.6 T cells (f). Each data point represents a single cell; up to 5 independent experiments were pooled for each graph. The red lines indicate the reference curve for a random distribution.
References
-
- Sauer M. Localization microscopy coming of age: from concepts to biological impact. J Cell Sci. 2013;126:3505–3513. - PubMed
-
- Sage D, et al. Quantitative evaluation of software packages for single-molecule localization microscopy. Nat Methods. 2015;12:717–724. - PubMed
-
- Annibale P, Scarselli M, Kodiyan A, Radenovic A. Photoactivatable Fluorescent Protein mEos2 Displays Repeated Photoactivation after a Long-Lived Dark State in the Red Photoconverted Form. J Phys Chem Let. 2010;1:1506–1510.
-
- Rubin-Delanchy P, et al. Bayesian cluster identification in single-molecule localization microscopy data. Nat Methods. 2015;12:1072–1076. - PubMed
Publication types
MeSH terms
Substances
Grants and funding
LinkOut - more resources
Full Text Sources
Other Literature Sources
Research Materials
