. 2016 Jun 13:6:27923.
doi: 10.1038/srep27923.

Ecophysiological consequences of alcoholism on human gut microbiota: implications for ethanol-related pathogenesis of colon cancer

Affiliations

Ecophysiological consequences of alcoholism on human gut microbiota: implications for ethanol-related pathogenesis of colon cancer

Atsuki Tsuruya et al. Sci Rep. .

Abstract

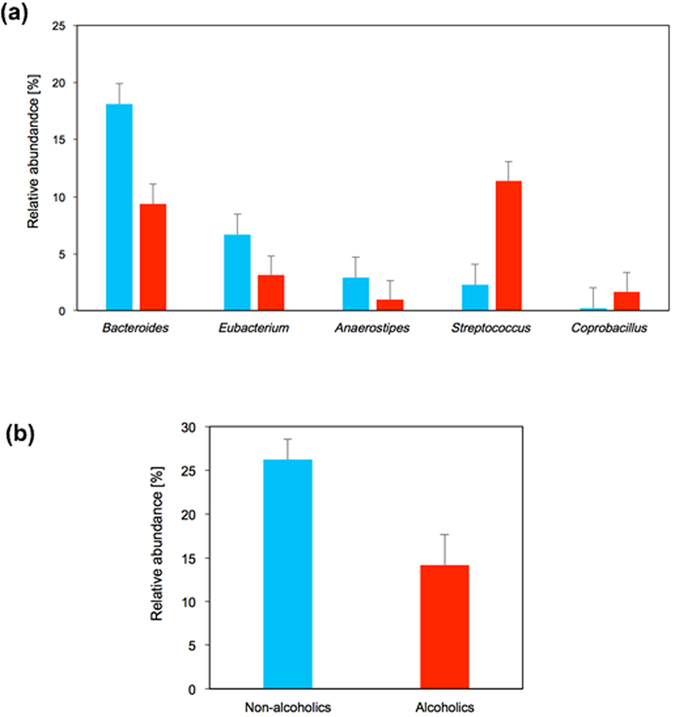
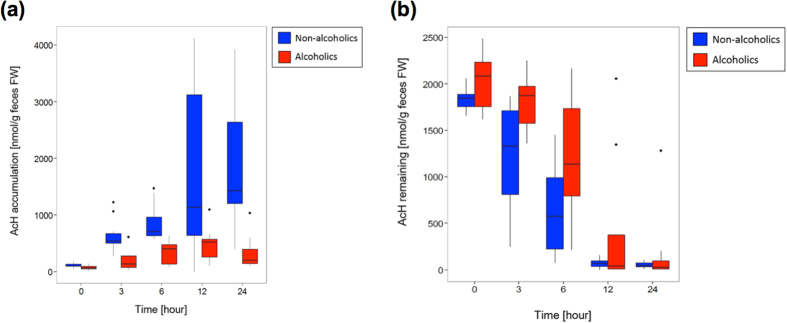
Chronic consumption of excess ethanol increases the risk of colorectal cancer. The pathogenesis of ethanol-related colorectal cancer (ER-CRC) is thought to be partly mediated by gut microbes. Specifically, bacteria in the colon and rectum convert ethanol to acetaldehyde (AcH), which is carcinogenic. However, the effects of chronic ethanol consumption on the human gut microbiome are poorly understood, and the role of gut microbes in the proposed AcH-mediated pathogenesis of ER-CRC remains to be elaborated. Here we analyse and compare the gut microbiota structures of non-alcoholics and alcoholics. The gut microbiotas of alcoholics were diminished in dominant obligate anaerobes (e.g., Bacteroides and Ruminococcus) and enriched in Streptococcus and other minor species. This alteration might be exacerbated by habitual smoking. These observations could at least partly be explained by the susceptibility of obligate anaerobes to reactive oxygen species, which are increased by chronic exposure of the gut mucosa to ethanol. The AcH productivity from ethanol was much lower in the faeces of alcoholic patients than in faeces of non-alcoholic subjects. The faecal phenotype of the alcoholics could be rationalised based on their gut microbiota structures and the ability of gut bacteria to accumulate AcH from ethanol.


Figures

Figure 1
Figure 1. OTU and UniFrac principal coordinate analyses of faecal bacterial communities of alcoholic patients (n = 16) and non-alcoholic volunteers (n = 48).
(a) Notched box plots of faecal OTU numbers (α-diversity). (b) Weighted average UniFrac distances within the non-alcoholic group (NA, blue bars), within the alcoholic group (AL, blue bars), and between these two groups (NA vs. AL, blue bar). Weighted average UniFrac distances were also determined within the non-alcoholic men (i.e., excluding women; NA, orange bars; n = 28), within the alcoholic men (AL, orange bars; n = 16), and between these two groups (NA vs. AL, orange bars). **P < 0.05 (Welch’s t-test with 10,000 Monte Carlo simulations, adjusted based on the Bonferroni procedure). (c) Faecal bacterial communities in the alcoholic patients (red symbols) and non-alcoholic volunteers (blue symbols) were clustered by PCoA of the weighted UniFrac distance matrix. In the PCoA, PCo1 and PCo2 explained 15.1% and 11.5% of the variation, respectively. Grey oval (dashed line) delineates a possible cluster of the non-alcoholic GM structures.
Figure 2
Figure 2. Comparison of relative abundances of bacteria between the faecal bacterial communities of the alcoholic and non-alcoholic groups.
(a) Relative abundances of bacterial genera showing significant differences (P < 0.05; Welch test). (b) Relative abundances of obligate anaerobes that potentially accumulate AcH to high levels (i.e., Ruminococcus, Bifidobacterium, Collinsella, and Prevotella). Blue bars, non-alcoholic group; Red bars, alcoholic group. P < 0.01.
Figure 3
Figure 3. Hierarchical clustering of GM structures and their relationships to some background factors (alcoholism, sex, generation, drinking and smoking habits, the polymorphisms of ADH1B and ALDH2, and enterotypes).
For alcoholism, magenta and light-blue rectangles indicate alcoholics and non-alcoholics, respectively. For sex, deep-blue and red rectangles indicate male and female, respectively. For generation, sky-blue, green, orange, and red rectangles indicate young (15–30 years old), mature (31–44 years old), middle-aged (45–65 years old), and elderly (66 years old or older), respectively. For drinking and smoking habits, deep-blue, green, orange, and red rectangles indicate Groups 1, 2, 3, and 4, respectively (see text for the group definitions). White represents the non-alcoholic volunteers who did not respond to the questionnaire. For the polymorphisms of ADH1B and ALDH2, coloured rectangles indicate the following genotypes: blue, ADH1B *1/*1 ALDH2 *1/*1; light green, ADH1B *1/*2 ALDH2 *1/*1; brown, ADH1B *1/*2 ALDH2 *1/*2; yellow, ADH1B *2/*2 ALDH2 *1/*1; grey, ADH1B *2/*2 ALDH2 *1/*2; and black, ADH1B *2/*2 ALDH2 *2/*2. For possible enterotypes of subjects, blue, orange, and grey rectangles indicate types 1, 2, and 3, respectively.
Figure 4
Figure 4. UniFrac PCoA plots of faecal bacterial communities of Groups 1–4 classified by their drinking and smoking habits.
UniFrac PCoA plots. The blue, green, yellow, and red symbols denote Group 1 (n = 26), Group 2 (n = 4), Group 3 (n = 11, including 6 alcoholic patients), and Group 4 (n = 15, including 10 alcoholic patients), respectively. The oval indicates where the plots of Group 3 tend to segregate from those of non-drinkers (Groups 1 and 2).
Figure 5
Figure 5. Relative abundances of bacterial genera in the faecal bacterial communities of Groups 1–4.
Figure 6
Figure 6. Aerobic faecal AcH metabolism.
(a) Box-whisker plots comparing the courses of faecal AcH production between the non-alcoholic volunteers (blue, n = 10) and the alcoholic patients (red, n = 7). AcH accumulation was acquired during aerobic incubation with 22 mM ethanol at pH 7.0 and 37 °C. (b) Box-whisker plots comparing the initial rates of faecal AcH decomposition between the non-alcoholic volunteers (blue, n = 10) and the alcoholic patients (red, n = 7). Remaining AcH was determined during aerobic incubation with 175 ± 30 μM AcH (initial concentration) at pH 7.0 and 37 °C. We emphasise that in these assays, the faecal samples included both hard and soft types of formed faeces in each group, and the water contents were not determined. Thus, these data are not corrected for water contents. However, the reported average water contents of formed faeces do not significantly differ (68 ± 0.9% and 74 ± 0.3% for hard and soft forms, respectively).

References

    1. Mizoue T. et al. Alcohol drinking and colorectal cancer in Japanese: a pooled analysis of results from five cohort studies. Am J Epidemiol 167, 1397–1406 (2008). - PubMed
    1. Seitz H. K. & Stickel F. Molecular mechanisms of alcohol-mediated carcinogenesis. Nat Rev Cancer 7, 599–612 (2007). - PubMed
    1. Mizukami T., Yokoyama A., Maruyama K. & Hibi T. Screening colonoscopy for Japanese alcoholic men (in Japanese). Shokakika 48, 599–604 (2009).
    1. Salaspuro M. Microbial metabolism of ethanol and acetaldehyde and clinical consequences. Addiction Biol 2, 35–46 (1997). - PubMed
    1. Das S. K. & Vasudevan D. M. Alcohol-induced oxidative stress. Life Sci 81, 177–187 (2007). - PubMed

Publication types

MeSH terms