. 2016 Jun 13:6:27939.
doi: 10.1038/srep27939.

Low-Pressure Burst-Mode Focused Ultrasound Wave Reconstruction and Mapping for Blood-Brain Barrier Opening: A Preclinical Examination

Affiliations

Low-Pressure Burst-Mode Focused Ultrasound Wave Reconstruction and Mapping for Blood-Brain Barrier Opening: A Preclinical Examination

Jingjing Xia et al. Sci Rep. .

Abstract

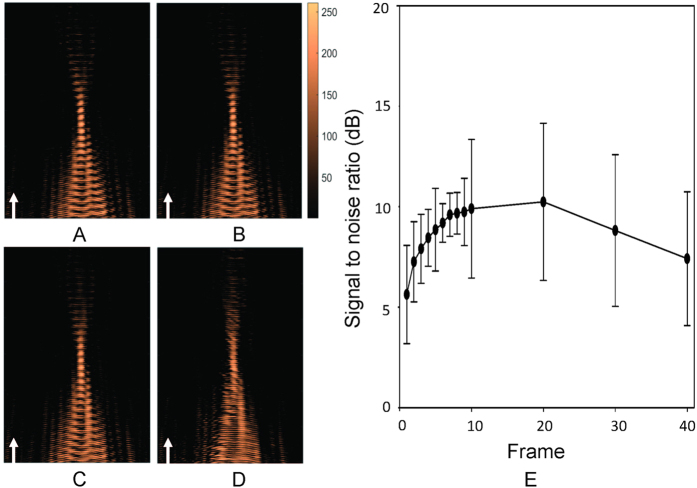
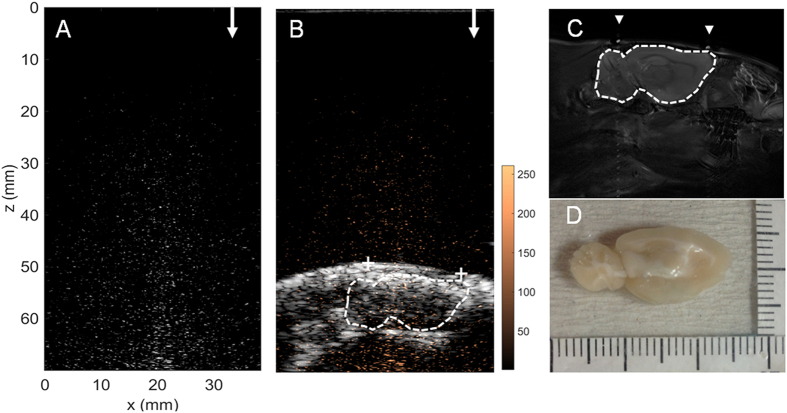
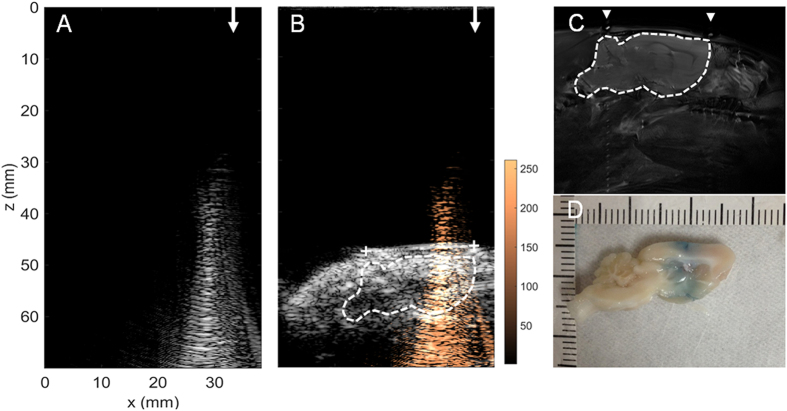
Burst-mode focused ultrasound (FUS) exposure has been shown to induce transient blood-brain barrier (BBB) opening for potential CNS drug delivery. FUS-BBB opening requires imaging guidance during the intervention, yet current imaging technology only enables postoperative outcome confirmation. In this study, we propose an approach to visualize short-burst low-pressure focal beam distribution that allows to be applied in FUS-BBB opening intervention on small animals. A backscattered acoustic-wave reconstruction method based on synchronization among focused ultrasound emission, diagnostic ultrasound receiving and passively beamformed processing were developed. We observed that focal beam could be successfully visualized for in vitro FUS exposure with 0.5-2 MHz without involvement of microbubbles. The detectable level of FUS exposure was 0.467 MPa in pressure and 0.05 ms in burst length. The signal intensity (SI) of the reconstructions was linearly correlated with the FUS exposure level both in-vitro (r(2) = 0.9878) and in-vivo (r(2) = 0.9943), and SI level of the reconstructed focal beam also correlated with the success and level of BBB-opening. The proposed approach provides a feasible way to perform real-time and closed-loop control of FUS-based brain drug delivery.


Figures

Figure 1
Figure 1. A summary shows acoustic wave reconstruction maps of FUS exposures with different exposure burst lengths (0.01–10 ms) and different exposure levels (0.391–1.194 MPa).
The bottom-right subplot shows asynchronous implementation of reconstruction under the exposure of 1.194 MPa and 10-ms burst length. Arrows indicate the FUS emit direction.
Figure 2
Figure 2. Peak signal intensity of the acoustic wave reconstruction maps under different exposure levels (0.391–1.194 MPa) and different burst lengths (0.01–10 ms; frequency = 1.5 MHz).
The dashed line represents the linear regression when pressure >0.467 MPa and burst length >0.05 ms. N = 10 for each exposure condition. The p values was calculated when using 0.05-ms burst length group as control.
Figure 3
Figure 3. Signal-to-noise ratio (SNR) of acoustic wave reconstruction maps under different exposure levels (0.391–1.194 MPa) and different burst lengths (0.01–10 ms; frequency = 1.5 MHz).
N = 10 for each exposure condition. The p values was calculated when using 0.05-ms burst length group as control.
Figure 4
Figure 4. Acoustic wave reconstruction maps of FUS exposures with different exposure frequencies.
(A) 0.55 MHz, 0.8 MPa; (B) 1.1 MHz, 0.8 MPa; (C) 1.5 MHz, 0.9 MPa; (D) 2 MHz, 1.1 MPa. In all experiments the burst length were set to 10 ms. N = 10 for each exposure condition. Arrows indicate FUS exposure direction.
Figure 5
Figure 5. Influence of the frame averaging on focal beam visualization.
(A) Acoustic wave reconstruction maps of focused ultrasound exposures (1.5 MHz, 0.9 MPa, 10 ms) with different numbers of averaged frames (frame number = 1, 5, 10, 20); (B) Signal-to-noise ratio (SNR) of acoustic wave reconstruction maps under different numbers of averaged frames. Arrows indicate FUS exposure direction.
Figure 6
Figure 6. In vivo FUS-exposure animal treatment example 1.
This example shows the use of intermediate FUS exposure level to perform FUS-BBB opening (frequency = 1.5 MHz, acoustic power = 4.54 W, acoustic pressure = 0.467 MPa). (A) Acoustic wave reconstruction maps of FUS exposures (FUS exposure directions are pointed out by arrows); (B) Acoustic wave reconstruction maps co-localized with diagnostic ultrasound and MRI (fiducial marker positions are marked as “+”); (C) MR images as high-resolution anatomical reference; (D) EB-Stained brain section. Arrow heads indicate the attached fiducial markers.
Figure 7
Figure 7. In vivo FUS-exposure animal treatment example 2.
This example shows the use of intermediate FUS exposure level to perform FUS-BBB opening, but intentionally left strong interference on animal scalp (frequency = 1.5 MHz, acoustic power = 4.54 W, acoustic pressure = 0.467 MPa). (A) Acoustic wave reconstruction maps of FUS exposures (FUS exposure directions are pointed out by arrows); (B) Acoustic wave reconstruction maps co-localized with diagnostic ultrasound and MRI (fiducial marker positions are marked as “+”); (C) MR images as high-resolution anatomical reference; (D) EB-Stained brain section. Arrow heads indicate the attached fiducial markers.
Figure 8
Figure 8. In vivo FUS-exposure animal treatment example 3.
This example shows the use of high FUS exposure level to perform FUS-BBB opening (frequency = 1.5 MHz, acoustic power = 9.12 W, acoustic pressure = 0.705 MPa). (A) Acoustic wave reconstruction maps of FUS exposures (FUS exposure directions are pointed out by arrows); (B) Acoustic wave reconstruction maps co-localized with diagnostic ultrasound and MRI (fiducial marker positions are marked as “+”); (C) MR images as high-resolution anatomical reference; (D) EB-Stained brain slice. Arrow heads indicate the attached fiducial markers.
Figure 9
Figure 9. Correlation of the peak SI level with the exposure level obtained from in vivo experiments.
Four groups of different FUS-BBB sonication levels and FUS-BBB opening outcomes: (Group A): low-level exposure, pressure = 0.111 ± 0.0045 MPa, BBB intact; (Group B): intermediate-level exposure with strong scalp interference, pressure = 0.439 ± 0.014 MPa, BBB intact; (Group C): intermediate-level exposure, pressure = 0.4352 ± 0.0162 MPa, BBB opened; (Group D): high-level exposure, pressure = 0.705 ± 0.005 MPa, BBB opened.

References

    1. Brightman M. & Reese T. Junctions between intimately apposed cell membranes in the vertebrate brain. The Journal of cell biology 40, 648–677 (1969). - PMC - PubMed
    1. Pardridge W. M. Drug and gene delivery to the brain: the vascular route. Neuron 36, 555–558 (2002). - PubMed
    1. Hynynen K., McDannold N., Sheikov N. A., Jolesz F. A. & Vykhodtseva N. Local and reversible blood–brain barrier disruption by noninvasive focused ultrasound at frequencies suitable for trans-skull sonications. Neuroimage 24, 12–20 (2005). - PubMed
    1. Hynynen K., McDannold N., Vykhodtseva N. & Jolesz F. A. Noninvasive MR Imaging–guided Focal Opening of the Blood-Brain Barrier in Rabbits 1. Radiology 220, 640–646 (2001). - PubMed
    1. Yarmolenko P. S. et al.. Thresholds for thermal damage to normal tissues: an update. International Journal of Hyperthermia 27, 320–343 (2011). - PMC - PubMed

Publication types