. 2016 Sep 15:509:50-59.
doi: 10.1016/j.ab.2016.05.026. Epub 2016 Jun 11.

An assay for 26S proteasome activity based on fluorescence anisotropy measurements of dye-labeled protein substrates

Affiliations

An assay for 26S proteasome activity based on fluorescence anisotropy measurements of dye-labeled protein substrates

Sucharita Bhattacharyya et al. Anal Biochem. .

Abstract

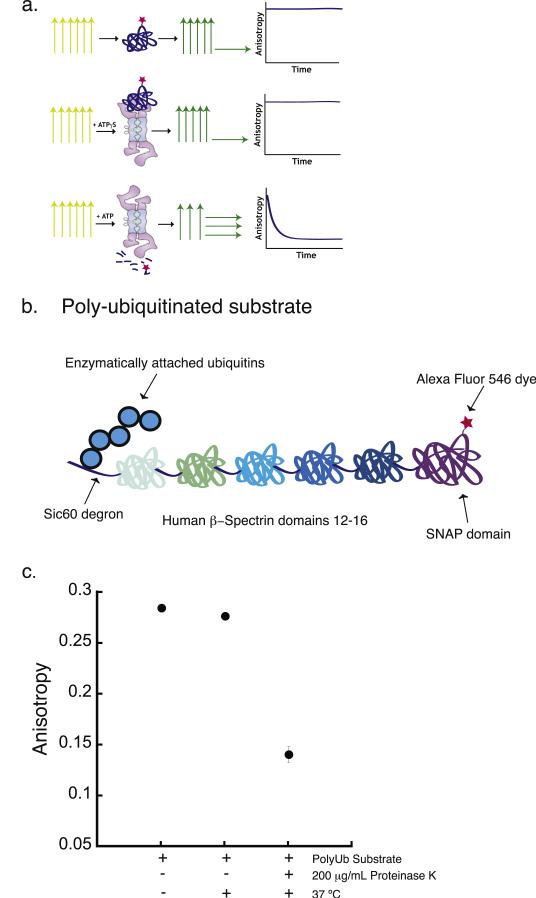
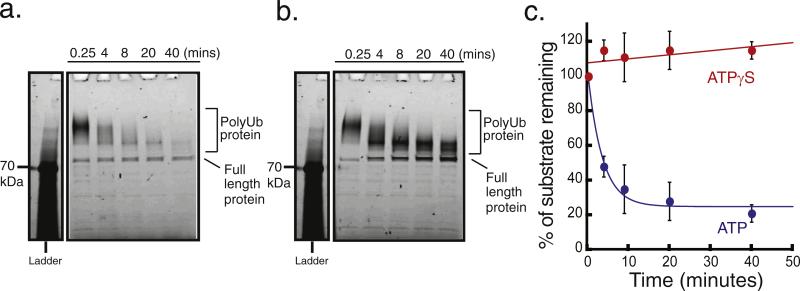
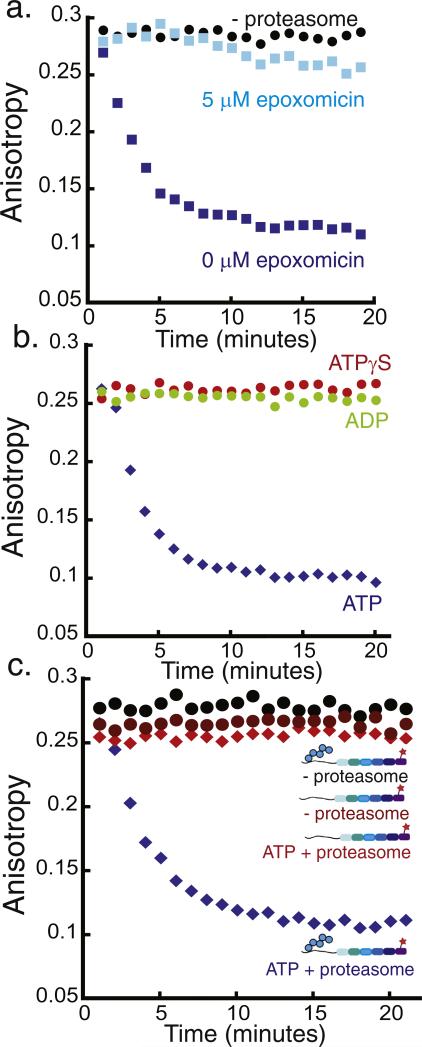
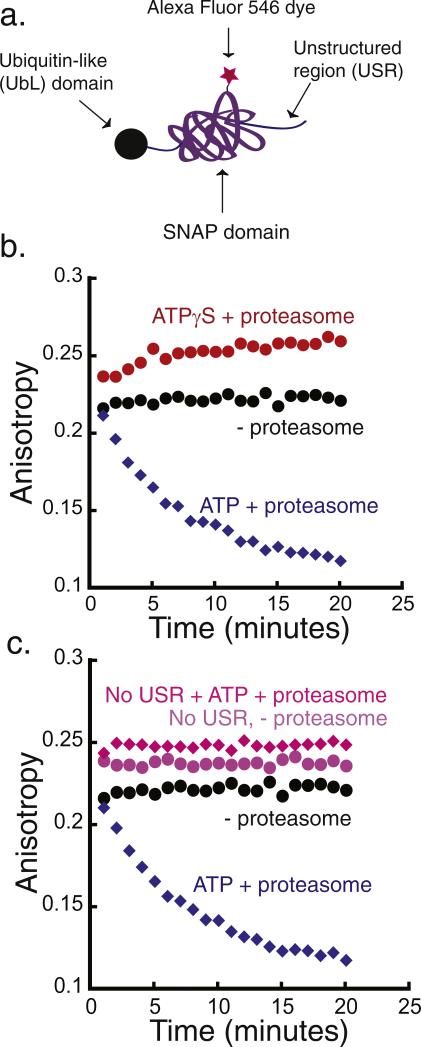
The 26S proteasome is the molecular machine at the center of the ubiquitin proteasome system and is responsible for adjusting the concentrations of many cellular proteins. It is a drug target in several human diseases, and assays for the characterization of modulators of its activity are valuable. The 26S proteasome consists of two components: a core particle, which contains the proteolytic sites, and regulatory caps, which contain substrate receptors and substrate processing enzymes, including six ATPases. Current high-throughput assays of proteasome activity use synthetic fluorogenic peptide substrates that report directly on the proteolytic activity of the proteasome, but not on the activities of the proteasome caps that are responsible for protein recognition and unfolding. Here, we describe a simple and robust assay for the activity of the entire 26S proteasome using fluorescence anisotropy to follow the degradation of fluorescently labeled protein substrates. We describe two implementations of the assay in a high-throughput format and show that it meets the expected requirement of ATP hydrolysis and the presence of a canonical degradation signal or degron in the target protein.

Keywords: 26S proteasome; Fluorescence anisotropy; High-throughput degradation assay; Protein degradation; Ubiquitin proteasome system (UPS).


Figures

Fig. 1
Fig. 1
Proteasomal degradation assay based on fluorescence anisotropy measurement. (a) Cartoon of the experimental design of the proteasomal degradation assay based on the measurement of bulk steady-state fluorescence anisotropy. The three rows represent three different assay conditions. The top row shows the dye-labeled substrate alone, the middle row shows dye-labeled substrate in the presence of protea-some and the nonhydrolyzed ATP analogue ATPγS, and the bottom row shows dye-labeled substrate in the presence of proteasome and ATP. Under each of these conditions, the sample is excited with polarized light, represented by the yellow vertical arrows. The fluorescence emission from the sample and its polarization are represented by the green and yellow horizontal and vertical arrows. The graphical representations in the rightmost column indicate the expected experimental results when the anisotropy of the fluorescence signal emitted from the substrate is monitored over the time course of the degradation reaction. (b) Schematic representation of a polyubiquitinated substrate used for the degradation assay. The substrate is composed of a 60-amino acid unstructured region derived from yeast Sic1 at the N terminus (Sic60), followed by five domains from the human β-spectrin protein and finally a SNAP-tag domain at the C terminus. The Sic60 sequence acts as the degron and provides the polyubiquitination signal as well as the initiation region for proteasomal degradation. The SNAP-tag domain allows site-specific labeling of the substrate with a fluorescent dye. (c) Fluorescence anisotropy of the polyubiquitinated substrate before and after 2 h incubation at 37 °C in the absence or presence of 200 μg/mL proteinase K. Error bars show the standard error of the mean anisotropy obtained in four separate experiments.
Fig. 2
Fig. 2
Proteasomal degradation of the polyubiquitinated substrate monitored by SDS-PAGE. Degradation of the polyubiquitinated substrate by the proteasome in the presence of ATP or ATPγS, analyzed by SDS-PAGE and protein detection by a laser gel scanner (Typhoon 9400, GE). 20 nM substrate was incubated with 50 nM proteasome at 30 °C in the presence of (a) 2 mM ATP or (b) 2 mM ATPγS. Aliquots were taken at the times indicated and added to a stop buffer that contained SDS in tris-glycine buffer. The first time point was taken at 0.25 min. The first lane shows molecular weight standards, with the 70 kDa band being visualized using the Typhoon Imager. (c) Quantification of polyubiquitinated substrate degradation in the presence of ATP (blue circles) or ATPγS (red circles). The graph plots the amount of protein remaining as the percentage of protein present at 0.25 min. Protein amounts were estimated by integrating dye fluorescence intensity in the region from the top of the diffuse band representing ubiquitinated protein to the bottom of the band representing full-length unmodified protein. Error bars show the standard error of the percentage of fluorescence intensity remaining in three separate experiments.
Fig. 3
Fig. 3
Monitoring 26S proteasome activity by fluorescence anisotropy. Degradation of the polyubiquitinated Alexa Fluor 546-labeled substrate by purified yeast proteasome as monitored by fluorescence anisotropy measurements. The degradation reaction was monitored at room temperature over 20 min by performing anisotropy readings every minute. One representative experiment is shown in each graph, and the decay rate constants obtained from the exponential fits to repeat experiments can be found in Supplementary Materials Table S2. The graphs plot fluorescence anisotropy against time. (a) Degradation of approximately 20 nM polyubiquitinated substrate in the presence of 2 mM ATP and 50 nM proteasome (blue squares), 50 nM proteasome + 5 μM epoxomicin (light blue squares), or no proteasome (black circles). (b) Degradation of approximately 20 nM polyubiquitinated substrate by 50 nM proteasome and 2 mM ATP (blue diamonds), 2 mM ADP (green circles), or 2 mM ATPγS (red circles). (c) Degradation of approximately 20 nM polyubiquitinated substrate in the presence of 2 mM ATP and 50 nM proteasome (blue diamonds), degradation of approximately 20 nM substrate lacking the polyubiquitin modification by 50 nM proteasome (red diamonds), and incubation of approximately 20 nM polyubiquitinated substrate without proteasome (black circles).
Fig. 4
Fig. 4
Degradation of a simplified model protein. (a) Schematic representation of a model substrate that is targeted to the proteasome by a ubiquitin-like (UbL) domain from S. cerevisiae Rad23 protein. The substrate consists of the UbL domain at its N terminus, followed by the SNAP-tag and a 40-amino acid-long unstructured region at the C terminus that functions as the proteasome initiation site (UbL-SNAP-40-His6). (b) Degradation of UbL-SNAP-40-His6 by purified yeast proteasome monitored by fluorescence anisotropy. The degradation reaction was monitored at room temperature over 20 min, taking an anisotropy reading every minute. Incubation of 20 nM substrate in the presence of 2 mM ATP and 50 nM proteasome (blue diamonds), of 20 nM substrate in the presence of 2 mM ATPγS and 50 nM proteasome (red circles), and of 20 nM substrate alone (black circles). (c) Degradation reaction of UbL substrate with (UbL-SNAP-40-His6) and without (UbL-SNAP-His6) a C-terminal unstructured region. Experiments are as in (b): 20 nM of UbL-SNAP-40-His6 with 50 nM proteasome and 2 mM ATP (blue diamonds), 20 nM UbL-SNAP-His6 with 50 nM proteasome and 2 mM ATP (pink diamonds), 20 nM substrate UbL-SNAP-40-His6 alone (black circles), and 20 nM UbL-SNAP-His6 alone (light purple circles).
Fig. 5
Fig. 5
Michaelis–Menten analysis of initial proteasomal protein degradation rates of UbL-SNAP-40-His6 or the polyubiquitinated substrate monitored by fluorescence anisotropy at room temperature. (a) Degradation rates in nM/min were determined in the presence of 2 nM or 5 nM proteasome for eight UbL-SNAP-40-His6 substrate concentrations ranging from 10 to 544 nM. Each point represents the average of initial rates from three to nine separate experiments and error bars represent the standard error of the mean. The kcat values for degradation by 2 and 5 nM proteasome were 0.55 ± 0.14 and 0.85 ± 0.19 min −1, respectively. KM was estimated as 91 ± 76 nM for degradation by 2 nM proteasome and 187 ± 101 nM for degradation by 5 nM proteasome. (b) Degradation rates in nM/min were determined for the polyubiquitinated substrate at five substrate concentrations at 2 nM or 5 nM proteasome concentration. Each point represents average initial rates from at least three experiments and error bars represent the standard error of the mean. The kcat values for degradation by the 2 and 5 nM proteasome were 1.1 ± 0.3 and 1.2 ± 0.2 min −1, respectively. KM was estimated as 13 ± 11 nM at 2 nM proteasome and 29 ± 10 nM at 5 nM proteasome.

References

    1. Finley D, Chen X, Walters KJ. Gates, channels, and switches: elements of the proteasome machine. Trends Biochem. Sci. 2015;41:77–93. - PMC - PubMed
    1. Murata S, Yashiroda H, Tanaka K. Molecular mechanisms of proteasome assembly. Nat. Rev. Mol. Cell Biol. 2009;10:104–115. - PubMed
    1. Beck F, Unverdorben P, Bohn S, Schweitzer A, Pfeifer G, Sakata E, Nickell S, Plitzko JM, Villa E, Baumeister W, Forster F. Near-atomic resolution structural model of the yeast 26S proteasome. Proc. Natl. Acad. Sci. U. S. A. 2012;109:14870–14875. - PMC - PubMed
    1. Groll M, Bajorek M, Kohler A, Moroder L, Rubin DM, Huber R, Glickman MH, Finley D. A gated channel into the proteasome core particle. Nat. Struct. Biol. 2000;7:1062–1067. - PubMed
    1. Lander GC, Estrin E, Matyskiela ME, Bashore C, Nogales E, Martin A. Complete subunit architecture of the proteasome regulatory particle. Nature. 2012;482:186–191. - PMC - PubMed

MeSH terms

Substances

LinkOut - more resources