

Virulence determinants associated with the Asian community-associated methicillin-resistant Staphylococcus aureus lineage ST59
- PMID: 27296890
- PMCID: PMC4906288
- DOI: 10.1038/srep27899
Virulence determinants associated with the Asian community-associated methicillin-resistant Staphylococcus aureus lineage ST59
Abstract
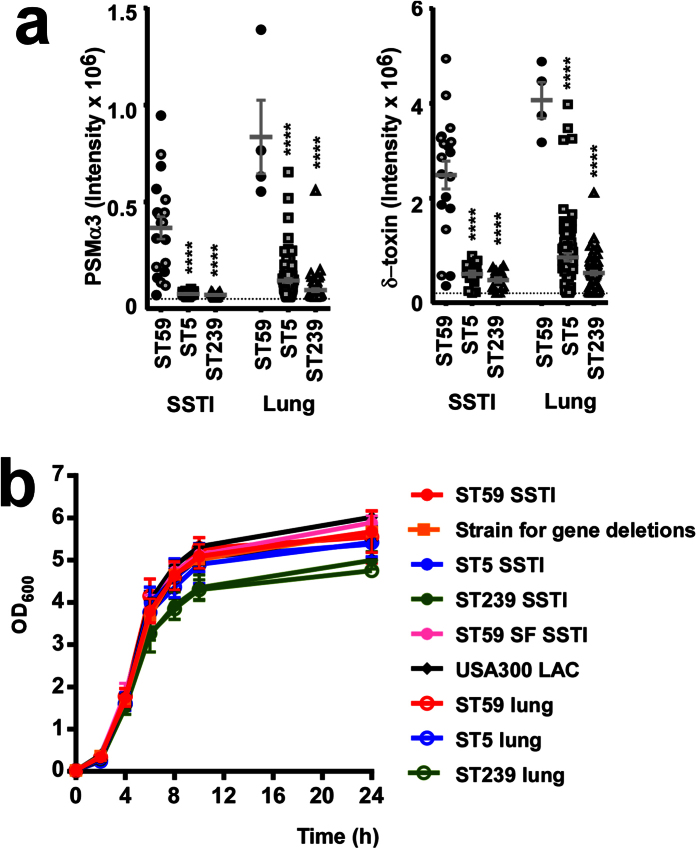
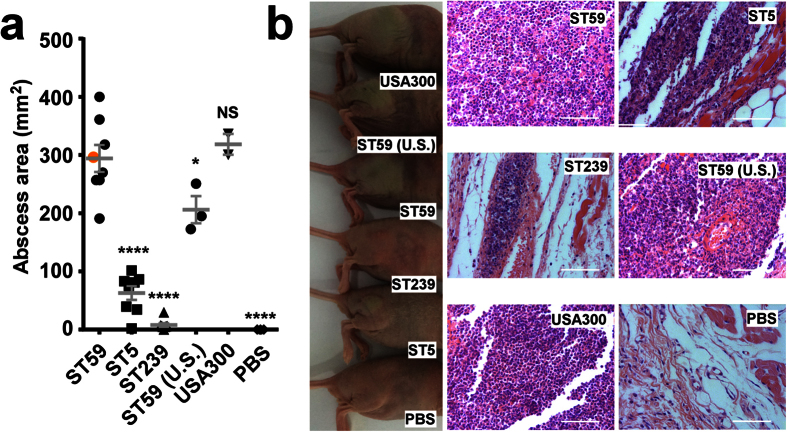
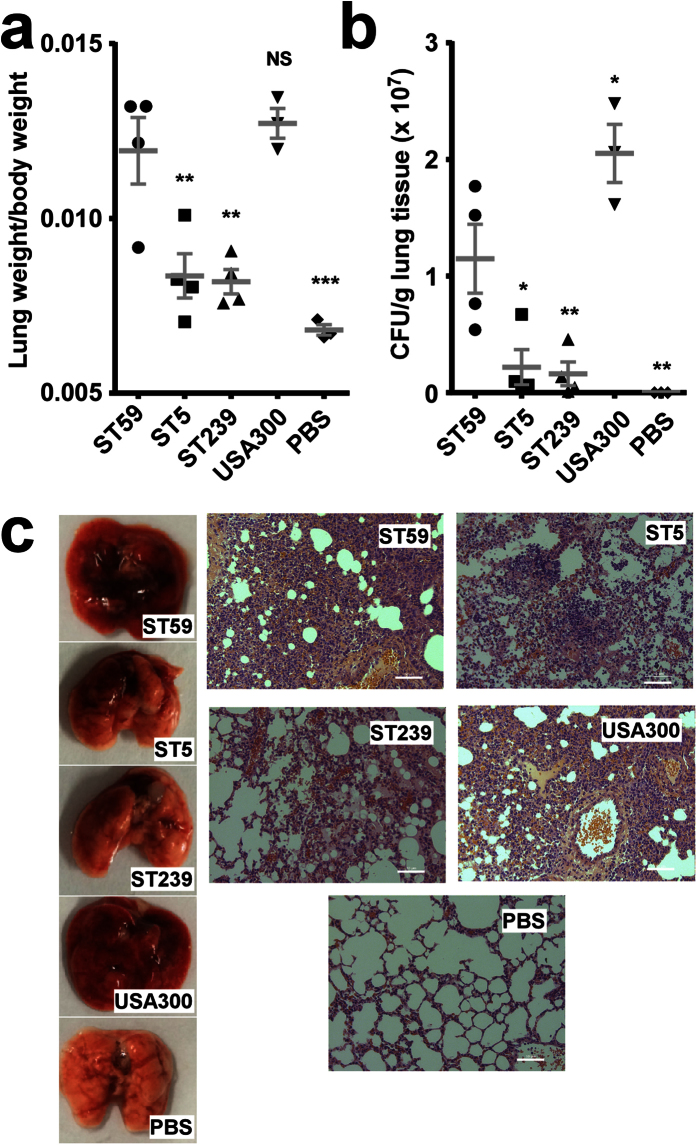
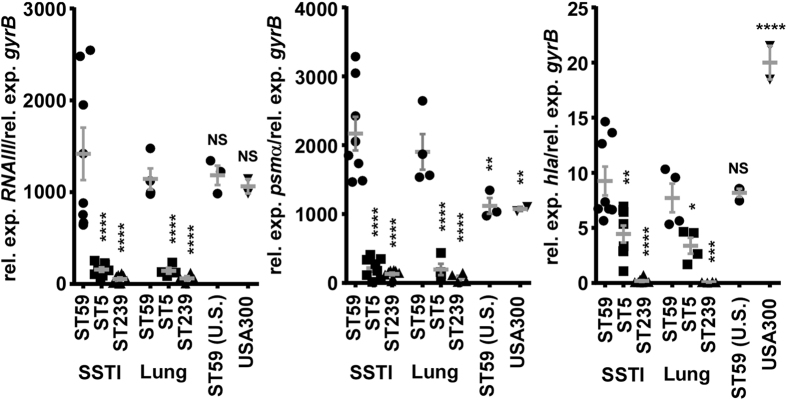
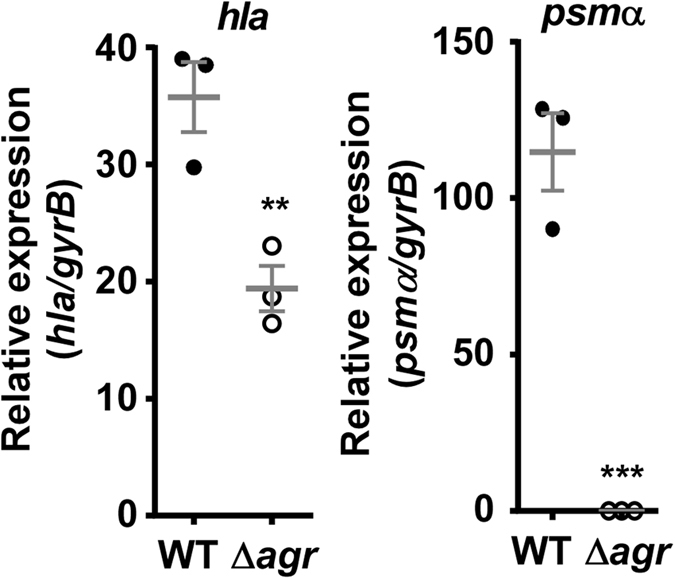
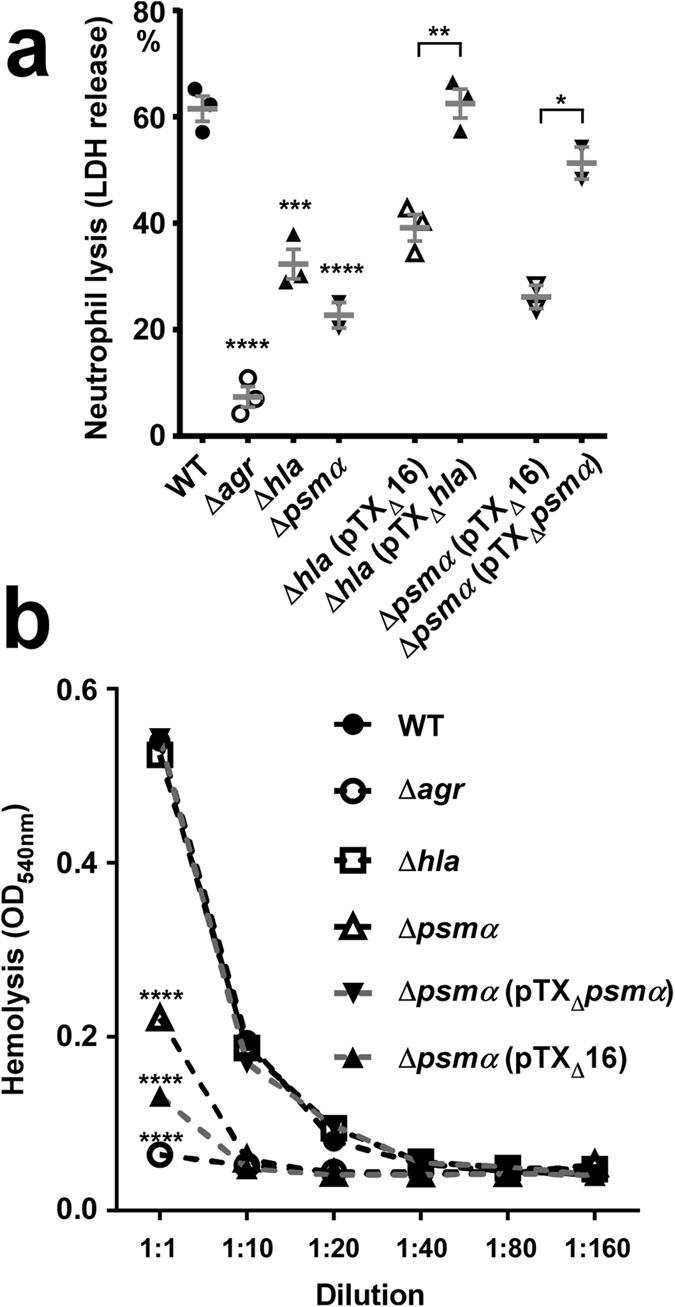
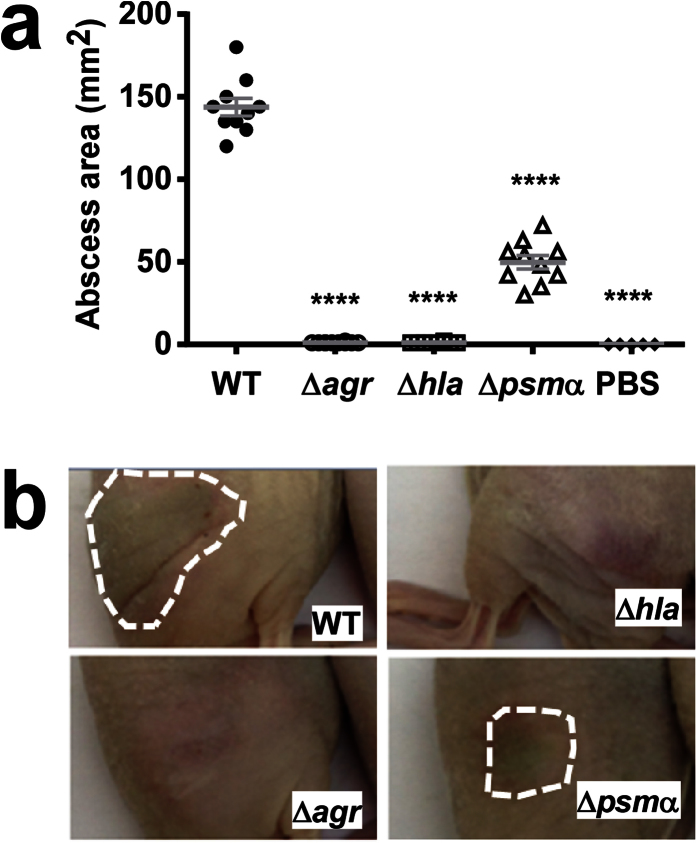
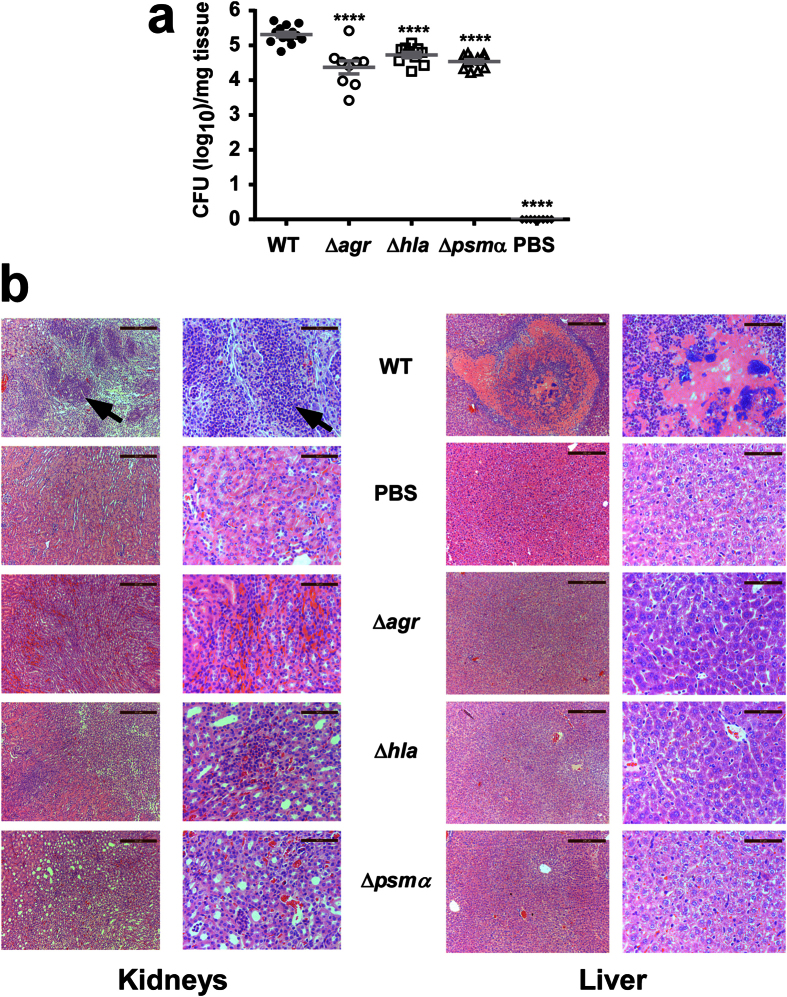
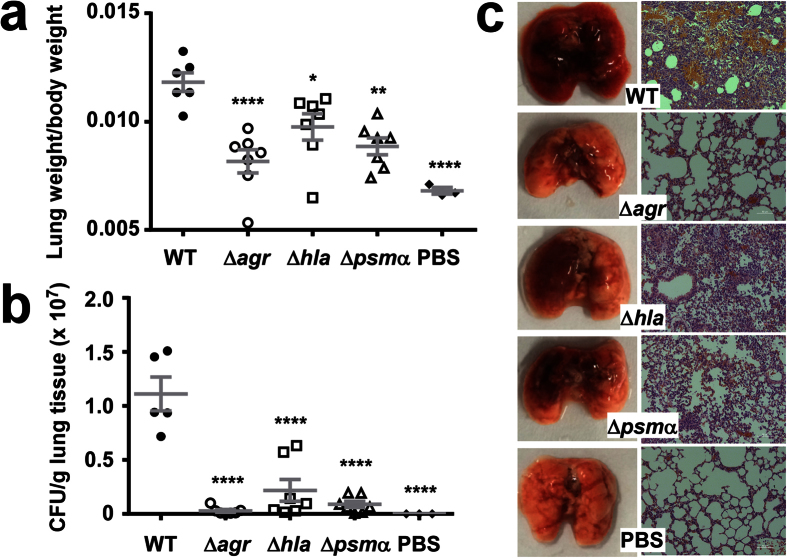
Understanding virulence is vital for the development of novel therapeutics to target infections with community-associated methicillin-resistant Staphylococcus aureus (CA-MRSA), which cause an ongoing epidemic in the United States and are on a global rise. However, what defines virulence particularly of global CA-MRSA lineages is poorly understood. Threatening a vast population, the predominant Asian CA-MRSA lineage ST59 is of major epidemiological importance. However, there have been no molecular analyses using defined virulence gene deletion mutants in that lineage as of yet. Here, we compared virulence in skin, lung, and blood infection models of ST59 CA-MRSA isolates with geographically matched hospital-associated MRSA isolates. We selected a representative ST59 CA-MRSA isolate based on toxin expression and virulence characteristics, and produced isogenic gene deletion mutants of important CA-MRSA virulence determinants (α-toxin, PSM α, Agr) in that isolate for in-vitro and in-vivo analyses. Our results demonstrate strongly enhanced virulence of ST59 CA-MRSA over hospital-associated lineages, supporting the notion that enhanced virulence is characteristic for CA-MRSA. Furthermore, they show strong and significant contribution of Agr, α-toxin, and PSMα to pathogenesis of ST59 CA-MRSA skin, lung, and blood infection, emphasizing the value of drug development efforts targeted toward those virulence determinants.
Conflict of interest statement
The authors declare no competing financial interests.
Figures
Similar articles
-
Hyperexpression of α-hemolysin explains enhanced virulence of sequence type 93 community-associated methicillin-resistant Staphylococcus aureus.BMC Microbiol. 2014 Feb 10;14:31. doi: 10.1186/1471-2180-14-31. BMC Microbiol. 2014. PMID: 24512075 Free PMC article.
-
Comparison of virulence-related determinants between the ST59-t437 and ST239-t030 genotypes of methicillin-resistant Staphylococcus aureus.BMC Microbiol. 2021 Oct 2;21(1):264. doi: 10.1186/s12866-021-02329-5. BMC Microbiol. 2021. PMID: 34600473 Free PMC article.
-
Molecular characteristics of community-acquired methicillin-resistant Staphylococcus aureus in Hokkaido, northern main island of Japan: identification of sequence types 6 and 59 Panton-Valentine leucocidin-positive community-acquired methicillin-resistant Staphylococcus aureus.Microb Drug Resist. 2011 Jun;17(2):241-50. doi: 10.1089/mdr.2010.0136. Epub 2011 Mar 13. Microb Drug Resist. 2011. PMID: 21395449
-
Community-associated meticillin-resistant Staphylococcus aureus in children in Taiwan, 2000s.Int J Antimicrob Agents. 2011 Jul;38(1):2-8. doi: 10.1016/j.ijantimicag.2011.01.011. Epub 2011 Mar 11. Int J Antimicrob Agents. 2011. PMID: 21397461 Review.
-
An update on community-associated MRSA virulence.Curr Opin Pharmacol. 2009 Oct;9(5):545-51. doi: 10.1016/j.coph.2009.07.009. Epub 2009 Aug 31. Curr Opin Pharmacol. 2009. PMID: 19726228 Review.
Cited by
-
Phenotypic and Genomic Comparison of Staphylococcus aureus Highlight Virulence and Host Adaptation Favoring the Success of Epidemic Clones.mSystems. 2022 Dec 20;7(6):e0083122. doi: 10.1128/msystems.00831-22. Epub 2022 Nov 21. mSystems. 2022. PMID: 36409083 Free PMC article.
-
Pathogenicity and virulence of Staphylococcus aureus.Virulence. 2021 Dec;12(1):547-569. doi: 10.1080/21505594.2021.1878688. Virulence. 2021. PMID: 33522395 Free PMC article. Review.
-
Comparative Genomic Analysis Provides Insights into the Evolution and Genetic Diversity of Community-Genotype Sequence Type 72 Staphylococcus aureus Isolates.mSystems. 2021 Oct 26;6(5):e0098621. doi: 10.1128/mSystems.00986-21. Epub 2021 Sep 7. mSystems. 2021. PMID: 34491085 Free PMC article.
-
Breast Milk Is a Potential Reservoir for Livestock-Associated Staphylococcus aureus and Community-Associated Staphylococcus aureus in Shanghai, China.Front Microbiol. 2018 Jan 11;8:2639. doi: 10.3389/fmicb.2017.02639. eCollection 2017. Front Microbiol. 2018. PMID: 29375508 Free PMC article.
-
A high-throughput cytotoxicity screening platform reveals agr-independent mutations in bacteraemia-associated Staphylococcus aureus that promote intracellular persistence.Elife. 2023 Jun 8;12:e84778. doi: 10.7554/eLife.84778. Elife. 2023. PMID: 37289634 Free PMC article.
References
-
- Otto M. Basis of virulence in community-associated methicillin-resistant Staphylococcus aureus. Annu Rev Microbiol 64, 143–162 (2010). - PubMed
-
- Herold B. C. et al.. Community-acquired methicillin-resistant Staphylococcus aureus in children with no identified predisposing risk. Jama 279, 593–598 (1998). - PubMed
-
- Klevens R. M. et al.. Invasive methicillin-resistant Staphylococcus aureus infections in the United States. Jama 298, 1763–1771 (2007). - PubMed
-
- Daum R. S. et al.. A novel methicillin-resistance cassette in community-acquired methicillin-resistant Staphylococcus aureus isolates of diverse genetic backgrounds. J Infect Dis 186, 1344–1347 (2002). - PubMed
Publication types
MeSH terms
Substances
Grants and funding
LinkOut - more resources
Full Text Sources
Other Literature Sources
Medical
Miscellaneous
