. 2016 Aug;171(4):2516-35.
doi: 10.1104/pp.16.00370. Epub 2016 Jun 13.

Lack of FTSH4 Protease Affects Protein Carbonylation, Mitochondrial Morphology, and Phospholipid Content in Mitochondria of Arabidopsis: New Insights into a Complex Interplay

Affiliations

Lack of FTSH4 Protease Affects Protein Carbonylation, Mitochondrial Morphology, and Phospholipid Content in Mitochondria of Arabidopsis: New Insights into a Complex Interplay

Elwira Smakowska et al. Plant Physiol. 2016 Aug.

Erratum in

  • CORRECTION: Vol. 171: 2516-2535, 2016.
    [No authors listed] [No authors listed] Plant Physiol. 2016 Oct;172(2):1352. doi: 10.1104/pp.16.01303. Plant Physiol. 2016. PMID: 27694396 Free PMC article. No abstract available.

Abstract

FTSH4 is one of the inner membrane-embedded ATP-dependent metalloproteases in mitochondria of Arabidopsis (Arabidopsis thaliana). In mutants impaired to express FTSH4, carbonylated proteins accumulated and leaf morphology was altered when grown under a short-day photoperiod, at 22°C, and a long-day photoperiod, at 30°C. To provide better insight into the function of FTSH4, we compared the mitochondrial proteomes and oxyproteomes of two ftsh4 mutants and wild-type plants grown under conditions inducing the phenotypic alterations. Numerous proteins from various submitochondrial compartments were observed to be carbonylated in the ftsh4 mutants, indicating a widespread oxidative stress. One of the reasons for the accumulation of carbonylated proteins in ftsh4 was the limited ATP-dependent proteolytic capacity of ftsh4 mitochondria, arising from insufficient ATP amount, probably as a result of an impaired oxidative phosphorylation (OXPHOS), especially complex V. In ftsh4, we further observed giant, spherical mitochondria coexisting among normal ones. Both effects, the increased number of abnormal mitochondria and the decreased stability/activity of the OXPHOS complexes, were probably caused by the lower amount of the mitochondrial membrane phospholipid cardiolipin. We postulate that the reduced cardiolipin content in ftsh4 mitochondria leads to perturbations within the OXPHOS complexes, generating more reactive oxygen species and less ATP, and to the deregulation of mitochondrial dynamics, causing in consequence the accumulation of oxidative damage.


Figures

Figure 1.
Figure 1.
Morphology of ftsh4 and wild-type (WT) plants growing under LD at 30°C. A, Two-week-old wild-type and ftsh4 plants grown on agar plates. B, Delay time (in days) in leaf emergence of ftsh4-1 and ftsh4-2 compared with the wild type. Plants were staged as described by Boyes et al. (2001). C, Rosette diameter of plants grown in soil at the indicated time points after sowing. Mean values ± sd from three measurements are shown. Significant differences are indicated by asterisks (one-sample Student’s t test; *, P < 0.05). D, Five-week-old rosette leaves of plants grown in soil.
Figure 2.
Figure 2.
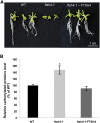
A, Morphology of 2-week-old wild-type (WT), ftsh4-1, and ftsh4-1-FTSH4 (revertant) seedlings grown under LD at 30°C on agar plates. B, Carbonylated proteins in a total protein extract of the above genotypes. Immunodetection with anti-DNP antibodies and quantification of carbonylated proteins in total protein extract, separated by one-dimensional gel electrophoresis, are shown. Anti-DNP signals from entire lanes were quantified densitometrically. In each experiment, the values for the relative carbonylated protein amount were calculated as a percentage of the value determined for the wild-type plants (set to 100%). Mean values ± sd from at least three independent experiments are shown. Statistically significant differences in abundance between wild-type, ftsh4-1, and ftsh4-1-FtsH4 plants are indicated by asterisks (one-sample Student’s t test; *, P < 0.05).
Figure 3.
Figure 3.
Comparison of mitochondrial carbonylated proteins from wild-type (WT; left) and ftsh4-1 (right) plants growing in LD at 30°C. Proteins separated by IEF/SDS two-dimensional gel electrophoresis were transferred on polyvinylidene difluoride (PVDF) membranes to subsequently detect carbonylated proteins using the OxyBlot technique. Arrowheads indicate protein spots accumulating in ftsh4 mitochondria, which are identified in all tested setups. Protein spots are listed in Table II and Supplemental Table S2.
Figure 4.
Figure 4.
Relative transcript levels for selected genes encoding mitochondrial proteins in ftsh4-1 and ftsh4-2 mutants growing in LD at 30°C compared with wild-type (WT) plants. A, Levels of transcripts for genes encoding proteins identified by DIGE analysis. B, Levels of transcripts for genes encoding proteins usually up-regulated by oxidative stress. The relative abundance of transcripts is expressed as log2 ratios. Mean values ± sd from at least three independent experiments are shown. The dotted lines indicate cutoff values ± 0.5 (log2) of the ratio corresponding to the threshold levels for significant up- and down-regulation of the transcripts in ftsh4. Full names of genes are given in Table I and Supplemental Table S1. TCA cycle, Tricarboxylic acid cycle.
Figure 5.
Figure 5.
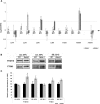
A, Relative transcript levels for genes encoding mitochondrial ATP-dependent proteases in ftsh4-1 and ftsh4-2 mutants grown in LD at 22°C and LD at 30°C compared with wild-type (WT) plants. The relative abundance of transcripts is expressed as log2 ratios. Mean values ± sd from at least three independent experiments are shown. The dotted lines indicate cutoff values ± 0.5 (log2) of the ratio corresponding to the threshold levels for significant up- and down-regulation of the transcripts in ftsh4. B, Representative images of the immunodetection of selected mitochondrial proteases in the ftsh4-1 mutant compared with wild-type plants growing in LD at 22°C, LD at 30°C, or SD at 22°C. C, Densitometric quantification of immunoblots presented in B. The intensity of bands was estimated using ImageQuant software (Molecular Dynamics). Data for ftsh4-1 are expressed as percentages of the value for wild-type plants. Mean values ± sd from at least three experiments are shown. Significant differences in abundance between the wild type and the ftsh4-1 mutant are indicated by asterisks (one-sample Student’s t test; *, P < 0.05).
Figure 6.
Figure 6.
Amounts and activities of respiratory complexes (A–C) and the level of ATP (D) in ftsh4 and wild-type (WT) plants. Mitochondria were isolated from 3-week-old wild-type and mutant plants (ftsh4-1 and ftsh4-2) growing hydroponically in LD at 22°C and LD at 30°C. A and B, Coomassie Brilliant Blue (CBB) and in-gel activity staining of complex I (C I) and complex V (C V) after BN-PAGE. C, Quantification of the activities of complexes I and V. The intensity of bands was estimated by densitometric analysis using ImageQuant software (Molecular Dynamics). Relative complex activity from mutant mitochondria was calculated as a percentage of that in wild-type plants. Differences in activity between the wild type and mutants are in all cases statistically significant (one-sample Student’s t test; P < 0.05). Mean values ± sd from three experiments are shown. D, ATP contents in wild-type and ftsh4 mitochondria. Mitochondria were isolated from 3-week-old wild-type, ftsh4-1, and ftsh4-2 seedlings grown under LD at 30°C. The ATP concentration was determined as described in “Materials and Methods.” An unpaired Student’s t test was used to estimate the P values: *, P < 0.05. Error bars correspond to sd (n = 6).
Figure 7.
Figure 7.
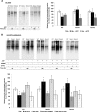
In vitro carbonylated protein degradation in wild-type (WT) and ftsh4 mitochondria. Immunodetection of carbonylated proteins separated by one-dimensional gel electrophoresis was estimated with anti-DNP antibodies. Anti-DNP signals from entire lanes were quantified densitometrically. Mean values ± sd from three experiments are shown. A, Mitochondria were isolated from 2-week-old wild-type, ftsh4-1, and ftsh4-2 seedlings grown under LD at 30°C and incubated at 22°C for 16 h in the absence or presence of 3.5 mm ATP. An unpaired Student’s t test was used to estimate the P values: *, P < 0.05. B, Mitochondria were isolated from 2-week-old wild-type, ftsh4-1, and ftsh4-2 seedlings grown under LD at 22°C and incubated at 22°C for 16 h in the presence of 5 mm succinate and 8 μm antimycin A, with or without of 3.5 mm ATP. For the protease inhibitor assay, inhibitors of Ser proteases (2 mm AEBSF) and metalloproteases (25 mm ortho-phenanthroline [O-Phe]) were added to the incubation medium. Mean values ± sd from three experiments are shown. An unpaired Student’s t test was used to estimate the P values: *, P < 0.05.
Figure 8.
Figure 8.
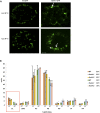
Mitochondrial morphology and class of lipids involved in CL biosynthesis, differing in ftsh4. A, Mitochondrial morphology was observed by scanning single protoplasts expressing GFP targeted to mitochondria of the wild type (WT) and ftsh4-1 using a Zeiss LSM 510 Meta confocal microscope. Giant mitochondria are highlighted with white arrows. The star indicates a spherical mitochondrion displaying reduced GFP fluorescence, pointing out an occurrence of oxidative stress. Bar = 5 µm. B, Lipids of the wild type, ftsh4-1, and ftsh4-2 grown under optimal (22°C) and moderately elevated (30°C) temperatures were measured by mass spectrometry. Lipid classes are shown in mol % of total lipids in the sample and are sums of individually quantified lipid species. An unpaired Student’s t test was used to calculate the P values: *, P < 0.05. Error bars correspond to sd (n = 3). DAG, Diacylglycerol; PA, phosphatidic acid; PC, phosphatidylcholine; PG, phosphatidylglycerol; PI, phosphatidylinositol. Only selected classes are shown; for the complete data set, see Supplemental Figure S4.
Figure 9.
Figure 9.
Hypothetical scenario of the events leading to the accumulation of carbonylated proteins in mitochondria of Arabidopsis in the absence of FTSH4. The direction of short green arrows specifies change in the abundance of CL, complex I (CI), complex V (CV), ROS, ATP, and carbonylated proteins in the absence of FTSH4. Black lines ending with arrowheads indicate activating effects, while perpendicular lines indicate inhibiting effects. The decreased content of CL as well as the absence of the chaperone-like activity of FTSH4 lead to lower stability/activity of complexes I and V, which in turn results in the accumulation of ROS and the decrease of ATP, respectively. The lower concentration of ATP restricts the activity of mitochondrial ATP-dependent proteases, which are not able to degrade all carbonylated proteins accumulating as a result of the elevated ROS level. The lower content of CL further restricts fission, which in turn causes the appearance of giant mitochondria and also blocks mitophagy, which is important to eliminate mitochondria damaged by oxidative stress. IMM, Inner mitochondrial membrane; IMS, intermembrane space of mitochondria; OMM, mitochondrial outer membrane; PHB, prohibitin.

References

    1. Anand R, Langer T, Baker MJ (2013) Proteolytic control of mitochondrial function and morphogenesis. Biochim Biophys Acta 1833: 195–204 - PubMed
    1. Araújo WL, Ishizaki K, Nunes-Nesi A, Larson TR, Tohge T, Krahnert I, Witt S, Obata T, Schauer N, Graham IA, et al. (2010) Identification of the 2-hydroxyglutarate and isovaleryl-CoA dehydrogenases as alternative electron donors linking lysine catabolism to the electron transport chain of Arabidopsis mitochondria. Plant Cell 22: 1549–1563 - PMC - PubMed
    1. Araújo WL, Tohge T, Ishizaki K, Leaver CJ, Fernie AR (2011) Protein degradation: an alternative respiratory substrate for stressed plants. Trends Plant Sci 16: 489–498 - PubMed
    1. Augustin S, Nolden M, Müller S, Hardt O, Arnold I, Langer T (2005) Characterization of peptides released from mitochondria: evidence for constant proteolysis and peptide efflux. J Biol Chem 280: 2691–2699 - PubMed
    1. Baker MJ, Mooga VP, Guiard B, Langer T, Ryan MT, Stojanovski D (2012) Impaired folding of the mitochondrial small TIM chaperones induces clearance by the i-AAA protease. J Mol Biol 424: 227–239 - PubMed

Publication types

MeSH terms

LinkOut - more resources