. 2016 Aug 18;128(7):934-47.
doi: 10.1182/blood-2015-12-687814. Epub 2016 Jun 13.

High-content screening identifies kinase inhibitors that overcome venetoclax resistance in activated CLL cells

Affiliations

High-content screening identifies kinase inhibitors that overcome venetoclax resistance in activated CLL cells

Sina Oppermann et al. Blood. .

Abstract

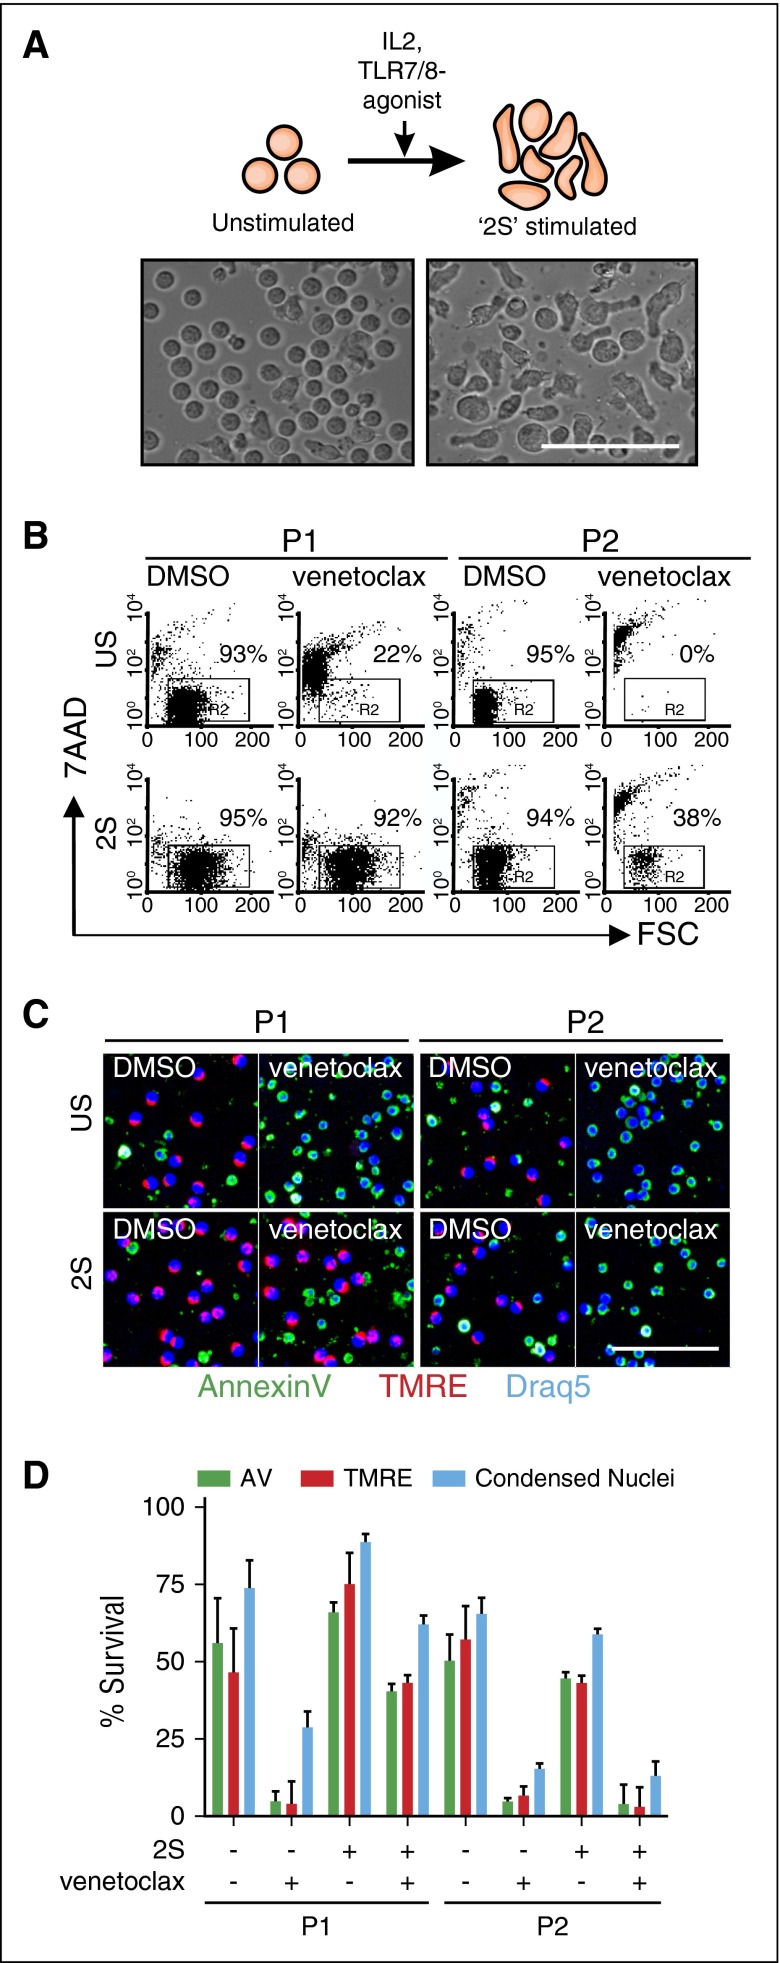
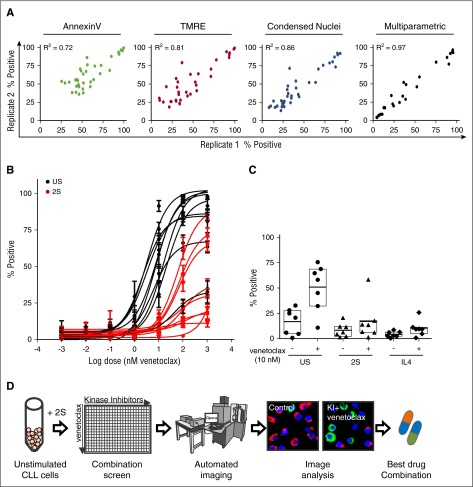
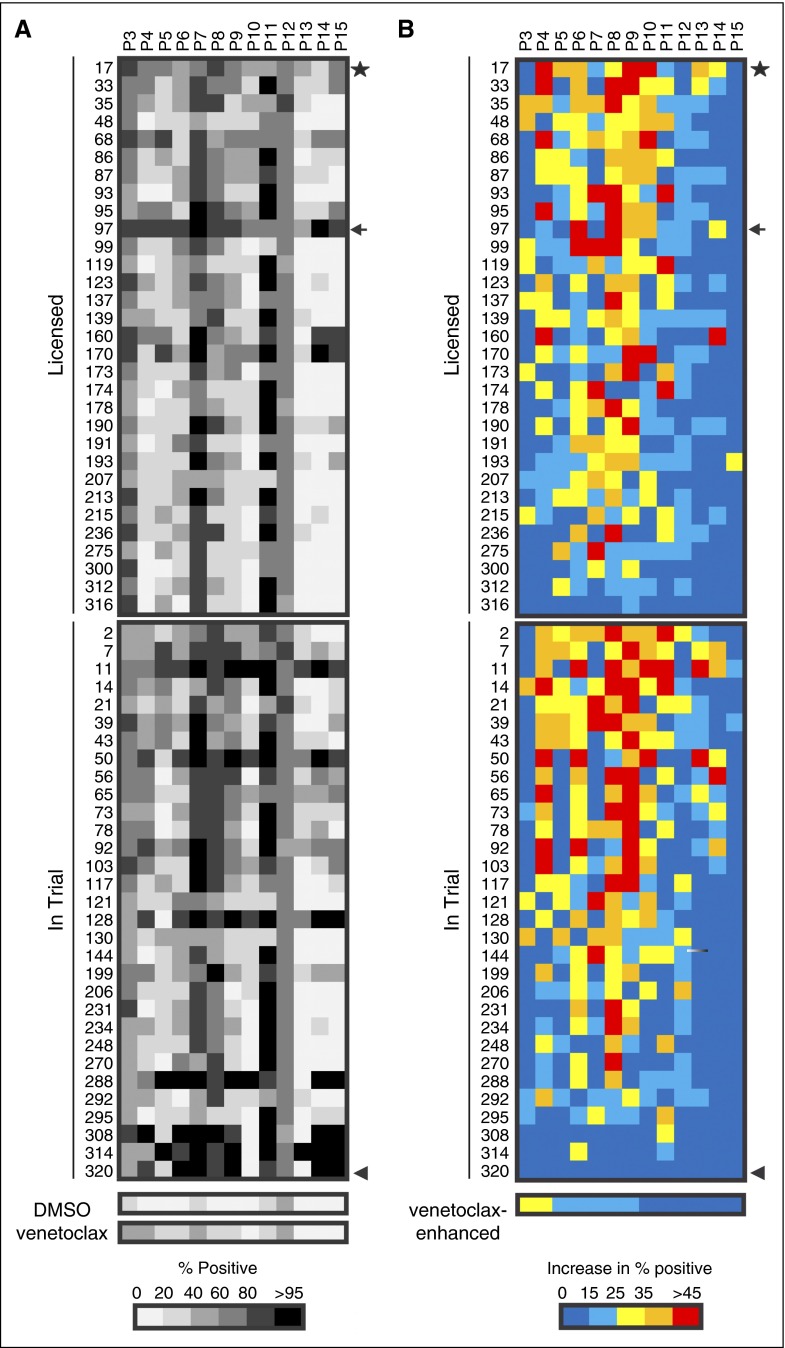
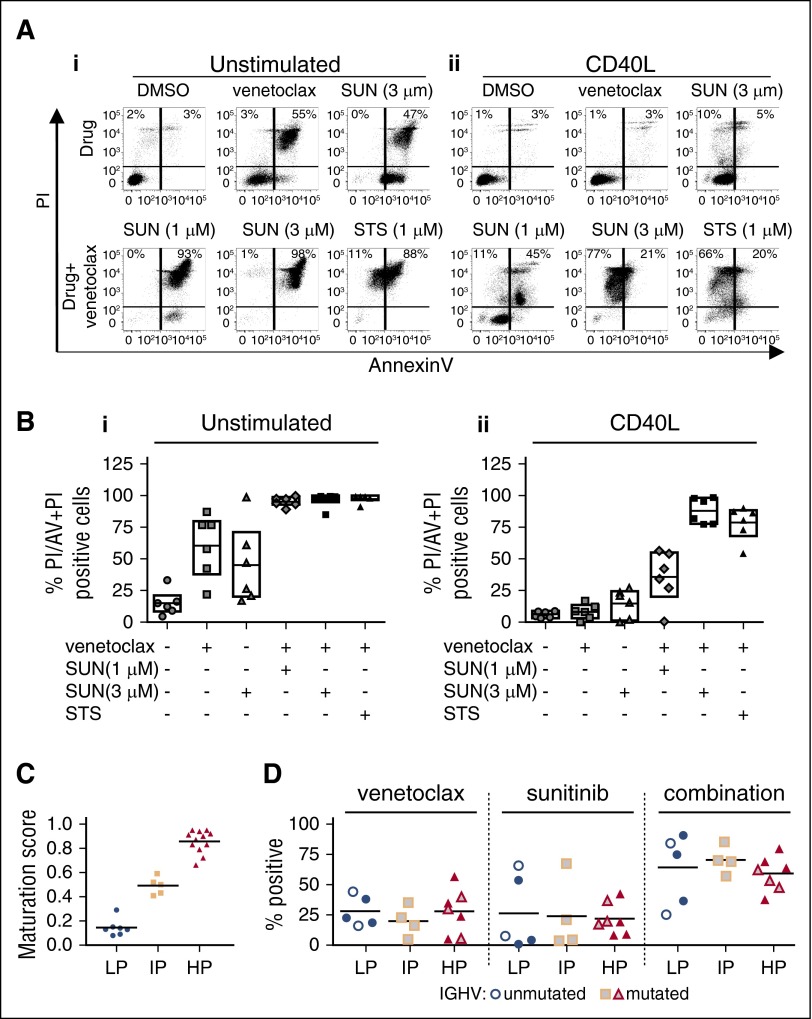
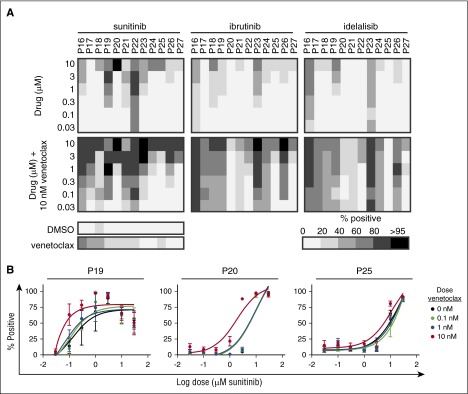
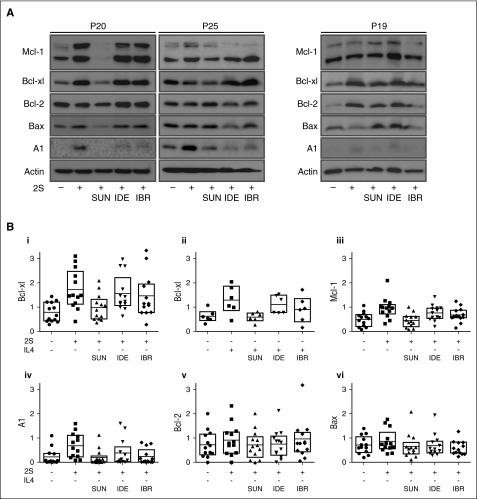
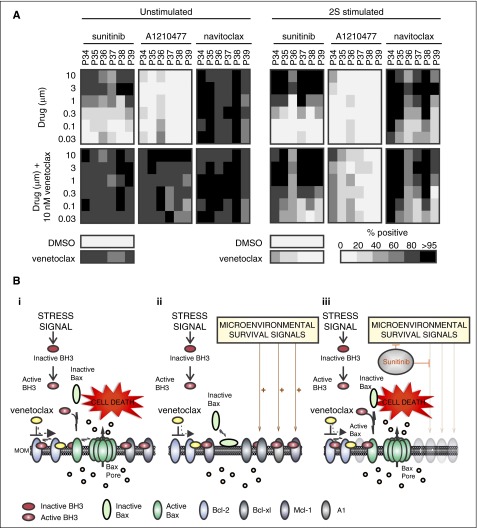
Novel agents such as the Bcl-2 inhibitor venetoclax (ABT-199) are changing treatment paradigms for chronic lymphocytic leukemia (CLL) but important problems remain. Although some patients exhibit deep and durable responses to venetoclax as a single agent, other patients harbor subpopulations of resistant leukemia cells that mediate disease recurrence. One hypothesis for the origin of resistance to venetoclax is by kinase-mediated survival signals encountered in proliferation centers that may be unique for individual patients. An in vitro microenvironment model was developed with primary CLL cells that could be incorporated into an automated high-content microscopy-based screen of kinase inhibitors (KIs) to identify agents that may improve venetoclax therapy in a personalized manner. Marked interpatient variability was noted for which KIs were effective; nevertheless, sunitinib was identified as the most common clinically available KI effective in overcoming venetoclax resistance. Examination of the underlying mechanisms indicated that venetoclax resistance may be induced by microenvironmental signals that upregulate antiapoptotic Bcl-xl, Mcl-1, and A1, which can be counteracted more efficiently by sunitinib than by ibrutinib or idelalisib. Although patient-specific drug responses are common, for many patients, combination therapy with sunitinib may significantly improve the therapeutic efficacy of venetoclax.


Figures

Figure 1
Figure 1
Resistance to venetoclax induced by microenvironmental signals. (A) Schematic model of CLL cell activation by the tumor microenvironment and corresponding bright-field images. CLL cells derived from peripheral blood (unstimulated [US]) change morphology and proliferate in vitro in response to IL2 (500 U/mL) and the Toll-like receptor-7/8 agonist Resiquimod (1 µg/mL) (“2S” stimulated). Phase-contrast micrographs of cells incubated and imaged (EVOS FL automicroscope [Life Technologies] with a 40× LPlan FLPH objective [AMG EP4683]) in serum-free AIM-V culture media (scale bar, 50 μm). (B) Flow cytometric analysis of cell 7-aminoactinomycin D (7AAD) staining (viability) for US (top panel) and 2S cells (2S; bottom panel) from 2 representative patients (P1, P2) cultured with or without venetoclax (10 nM) for 48 hours after addition of drug. The percentages of viable cells that exclude 7AAD (7AAD, enclosed box R2) are shown in the dot plots as numbers. (C) Image-based detection of cell death and survival. US (top panels) and 2S-stimulated (2S; bottom panels) CLL cells from the patients in panel B were cultured with DMSO as a negative control or with venetoclax (10 nM) as indicated. After 72-hour incubation, cells were stained with standard fluorescence dyes for detection of apoptotic cell death (Annexin V conjugated to Alexa Fluor 488, green), mitochondrial membrane potential (TMRE, red), and nuclear size and morphology (Draq5, blue). Automated confocal fluorescence microscopy (Opera QEHS high-content screening system; PerkinElmer) was used to acquire 3 images from each well for 4 replicate wells of a 384-well imaging plate using a 20× 0.45 numerical aperture (NA) air lens at 37°C and 5% CO2. Representative images are shown (scale bar, 50 μm). (D) Cell survival determined by automated analysis of micrographs such as those in (C) for each of unstimulated (–2S) and stimulated cells (+2S) with or without venetoclax (10 nM) as indicated. Viability was defined by either the absence of Annexin V staining intensity (green bars), the presence of TMRE staining intensity (red bars), or the absence of condensed nuclei stained by Draq5 (blue bars). Error bars ± standard deviation (std dev), n = 12 fields of view (FOV). AV, Annexin V; FSC, forward scatter.
Figure 2
Figure 2
Multiparametric image analysis and high-content screening enables automated analysis of cell viability for CLL patients’ cells exposed to KIs and venetoclax alone and in combination. (A) Correlation of technical replicates for 2S cells from 1 representative patient treated with negative control (DMSO), positive control (STS + venetoclax), and a panel of drugs. Comparison of fluorescence intensity or area threshold analyses to identify positive (dead) cells based on loss of lipid asymmetry (Annexin V, green), loss of mitochondrial membrane potential (TMRE, red), and nuclear condensation (Condensed Nuclei, blue) with a multiparametric classifier (black). Images of cells were acquired as described in Figure 1C. For threshold analysis, cells were classified as in Figure 1D; for multiparametric analysis, cells were classified as nonviable (percentage positive) if they were more similar to the positive control (STS + venetoclax treated) training group than the negative control (DMSO) group based on 8 quantified image features using a random forest classifier. (B) Patient-specific dose response fit for venetoclax (1 pM to 1 µM) in unstimulated (C, black) and 2S CLL cells (2S, red) assessed by multiparametric analysis as in the description of panel A. Data for 9 representative patients were fit using nonlinear least squares with GraphPadPrism 5.03 (GraphPad Software) as mean ± standard deviation (std dev) for cell images from 8 micrographs per condition. (C) Microenvironment-induced resistance to venetoclax is independent of model. Response to 10 nM venetoclax for 72 hours was measured for unstimulated and 2S- or IL4-stimulated CLL cells from 7 patients. Drug response assessed by multiparametric analysis of cells classified as percentage positive as described in panel A. (D) Schematic overview of image-based high-content drug screening in primary CLL cells. Patient-derived CLL cells were stimulated with 2S media, seeded into 384-well plates and treated with 320 KIs at a screening concentration of 1 µM with or without venetoclax (10 nM). Negative (DMSO) and positive controls (STS + venetoclax) used for training of the classifier were included in each plate. Automated fluorescence imaging was performed as described in Figure 1.
Figure 3
Figure 3
Identification of KIs currently licensed or in trial that overcome resistance to venetoclax in 2S-stimulated cells from individual patients. Heatmaps of (A) total cytotoxicity expressed as percentage positive (classified similarity to STS + venetoclax control) and (B) venetoclax-enhanced cytotoxicity expressed as an increase in percentage positive for 2S-stimulated CLL cells from 13 patients incubated with KIs that are licensed or in clinical trials (1 μM) in combination with venetoclax (10 nM), as indicated. Rows indicate individual KIs; columns indicate different patient samples. The grayscale bar shows percentage of cells classified as positive as indicated at the bottom in panel A, and the color bar indicates venetoclax-enhanced percentage positive in panel B. A combination of KI and venetoclax is considered to be effective if venetoclax increases the percentage-positive classification by >25% above the value for KI alone, corresponding to a mean total kill of 63% in screen positives (yellow [B]). A combination of KI and venetoclax was considered to be highly effective if addition of venetoclax increased the amount of cell death by >45% (red [B]), corresponding to a total kill of >80% for the drug combination (A). The controls below the heatmaps show percentage-positive cells for the negative control (DMSO) and venetoclax alone in panel A, and venetoclax-enhanced percentage-positive cells compared with DMSO (ie, the difference between venetoclax and DMSO alone) in panel B, for individual patients. The columns are sorted in decreasing order of venetoclax-enhanced percentage-positive compared with DMSO; rows are ranked according to frequency of effective KI-venetoclax combinations. For combinations with the same frequency, the rows were further sorted based on the average value for venetoclax-enhanced effect across positive screens. Results are shown for 62 of the 320 KIs (results for all KIs are in supplemental Figure 2). Sunitinib (★) was identified for further analysis as the licensed compound with a high frequency (8 of 13 patient samples) and degree of venetoclax-enhanced kill (mean value of 45% enhanced kill in screen positives). The arrow and arrowhead refer to dasatinib and alvocidib, respectively (see “Discussion” for more details). Patient samples were analyzed by fluorescence-based high-content screening for percentage positive as described in Figure 2. The 10 nM dose of venetoclax was selected for screening as it was the highest concentration that exhibited minimal activity against 2S-stimulated CLL cells (Figure 2B-C).
Figure 4
Figure 4
Coculture of primary CLL cells promotes resistance to venetoclax that was overcome by sunitinib independent of IGHV mutation status. Primary CLL cells from 6 patients were cultured in suspension (unstimulated) or in coculture with bone marrow stromal cells (OP9) expressing human CD40L (CD40L) and treated with the indicated concentrations of venetoclax, sunitinib (SUN) alone or in combination or as a positive cell death control with STS and venetoclax. Drug response was determined by flow cytometric analysis of Annexin V (AV) and propidium iodide (PI)-stained CLL cells 48 hours after drug treatment. (A) Dot plots are shown for unstimulated suspension CLL cells (i) and CD40L-stimulated CLL cells (ii) for 1 representative patient. Numbers in dot blots indicate percentages of PI+ cells (top left quadrant) and Annexin V + PI++ cells (top right quadrant). (B) Percentage of PI/Annexin V + PI+ cells for unstimulated CLL cells (i) and CD40L-stimulated CLL cells (ii) from 6 patients 48 hours after the indicated drug treatment. Cells double stained with Annexin V and PI (AV + PI, top right in dot blots) or PI+ cells (top left corner in dot blots) were counted as nonviable. Cells positive for only Annexin V (bottom right corner) were excluded due to possible interference from sunitinib fluorescence. On average, venetoclax induced only 8% cell kill (n = 6) in CD40-cocultured cells compared with 60% cell kill in unstimulated cells. Sunitinib (3 µM) increased the total kill to >80%. Similar results were obtained for cells cocultured with OP9 stromal cells (supplemental Figure 3). (C) DNA methylation maturation scores for 24 CLL samples separated into methylation subtypes as assessed by MassARRAY. Consensus clustering of DNA methylation levels of a panel of 6 genes was used to classify 3 clusters of CLL cases based on their degree of DNA methylation maturation (blue: low [LP-CLL]; yellow: intermediate [IP-CLL]; and red: high [HP-CLL]) programmed CLL (LP-CLL, n = 7; IP-CLL, n = 5; HP-CLL, n = 12). (D) Drug response to venetoclax (10 nM), sunitinib (1 µM) alone or in combination in 2S-stimulated CLL cells from 16 patients separated by DNA methylation subgroup as in panel C and IGHV mutation status. Gray filled symbols, mutated IGHV; white filled symbols, unmutated IGHV; solid color symbols, IGHV status data not available. IGHV sequence homology of <98% vs germline was considered as mutated. Percentage positive indicates percentage of dead cells determined by multiparametric image analysis as described in Figure 2. Data for CLL cells cocultured with OP9 control stromal cell lines are shown in supplemental Figure 2.
Figure 5
Figure 5
Sunitinib is more efficient than idelalisib or ibrutinib in killing 2S-stimulated CLL cells in combination with venetoclax. 2S-stimulated CLL cells from 12 patients were treated with sunitinib, ibrutinib, or idelalisib alone or in combination with venetoclax, as indicated. Drug response was measured as described in Figure 2. (A) Dose-response heatmap of total cytotoxicity expressed as percentage-positive cells for cell death induced by sunitinib, ibrutinib, and idelalisib as single agents (top panels) and in combination with venetoclax (10 nM) (bottom panels). The shade indicates the mean for all the cells in 8 micrographs for each condition according to the grayscale bar shown below. Individual patient samples are shown in columns and drug concentrations in rows. Cell death (percentage positive) in negative control (DMSO) and for venetoclax (10 nM) as single agents are shown as bars below the heatmaps for individual patients. Across 12 patients, the average single-agent activity for 1 µM sunitinib, ibrutinib, and idelalisib was 24%, 15%, and 19%, respectively. (B) Dose-response data fit by nonlinear least squares for sunitinib alone (black dots and line) and in combination with the indicated concentrations of venetoclax (colored lines) for cells from 3 patients (numbers above the panels) analyzed as in panel A. Points are mean ± standard deviation (std dev), n = 8 FOV.
Figure 6
Figure 6
Microenvironment survival signals induce patient-specific changes in expression of Bcl-2 family proteins that was prevented by sunitinib but not ibrutinib or idelalisib. Comparison of protein levels for unstimulated CLL cells (−) and 2S- or IL4-stimulated cells (+) before and after treatment with 1 µM sunitinib (SUN), idelalisib (IDE), and ibrutinib (IBR). Protein lysates for stimulated patient cells (n = 13 for 2S stimulation, n = 6 for IL4 stimulation) collected 18 to 20 hours after drug treatment were analyzed by immunoblotting using antibodies to the antigens indicated. (A) Representative results for patients P20, P25, and P19. (B) Quantification of relative protein levels for Bcl-xl (i-ii), Mcl-1 (iii), A1 (iv), Bcl-2 (v), and Bax (vi) by analysis of chemiluminescence signals recorded using a CCD camera corrected to the intensities obtained with the β-actin antibody using NIH ImageJ 1.48p software. Data are for 13 patients in subpanels i, iii, iv, v, and vi and 6 patients in subpanel ii; boxes indicate 25th to 75th percentile with the mean indicated as a line. For sunitinib treatment in 2S-stimulated cells, 21 patients were analyzed by immunoblotting (data not shown, significance tests in supplemental Table 2).
Figure 7
Figure 7
Resistance in 2S-stimulated cells is mainly mediated by Bcl-xl. (A) Dose-response heatmap of total cytotoxicity expressed as percentage-positive cells for cell death induced by sunitinib, A1210477, and navitoclax as single agents (top panels) and in combination with venetoclax (10 nM) (bottom panels) in unstimulated and 2S-stimulated cells from 6 patients. Drug response was determined by multiparametric analysis as described in Figure 2. The shade indicates the mean for all the cells in 8 micrographs for each condition according to the grayscale bar shown below. Columns are individual patient samples and rows are drug concentrations. Cell death (percentage positive) in negative control (DMSO) and for venetoclax (10 nM) as a single agent are shown as bars below the heatmaps. (B) Model illustrating potential cellular responses to venetoclax and sunitinib. (i) Apoptotic response of unstimulated CLL cells treated with venetoclax. Bcl-2 family proteins control cell death by regulating the permeabilization of the mitochondrial outer membrane (MOM) through a series of competitive binding interactions among themselves. For illustrative purposes, inhibition of BH3 proteins (mode 2) is shown although the process is predicted to be similar for activated Bax bound to and inhibited by antiapoptotic proteins (mode 1). Upon receiving an apoptotic stress signal, inactive proapoptotic BH3 proteins (red) are activated (red and white) and migrate to mitochondria where they are either bound by 1 of the antiapoptotic proteins (Bcl-2, Bcl-xl, Mcl-1, or A1) or trigger apoptosis by binding to inactive Bax (light green) and activating it at the membrane (dark green). Activated Bax oligomerizes and permeabilizes the MOM, enabling release of proapoptotic proteins including cytochrome c, endonuclease G, and Smac (orange circles) from the mitochondrial intermembrane space into the cytoplasm to activate the effector caspases that execute the cell. Venetoclax (yellow) binds Bcl-2 displacing an activator BH3 protein, allowing the downstream activation of Bax, permeabilization of MOM, and cell death. (ii) Apoptotic response of CLL cells stimulated by microenvironment. Microenvironmental survival signals increase expression of the antiapoptotic Bcl-2 family members Bcl-xl, Mcl-1, and A1 that are not targeted by venetoclax and/or the downregulation of the proapoptotic protein Bax. The excess antiapoptotic proteins bind active BH3 proteins displaced from Bcl-2 by venetoclax preventing them from activating Bax thereby inhibiting apoptosis. (iii) Sunitinib turns off microenvironmental prosurvival signals preventing increased expression of the antiapoptotic proteins other than Bcl-2 and thereby restoring sensitivity to venetoclax.

References

    1. Meads MB, Hazlehurst LA, Dalton WS. The bone marrow microenvironment as a tumor sanctuary and contributor to drug resistance. Clin Cancer Res. 2008;14(9):2519–2526. - PubMed
    1. Burger JA, Tsukada N, Burger M, Zvaifler NJ, Dell’Aquila M, Kipps TJ. Blood-derived nurse-like cells protect chronic lymphocytic leukemia B cells from spontaneous apoptosis through stromal cell-derived factor-1. Blood. 2000;96(8):2655–2663. - PubMed
    1. Kurtova AV, Balakrishnan K, Chen R, et al. Diverse marrow stromal cells protect CLL cells from spontaneous and drug-induced apoptosis: development of a reliable and reproducible system to assess stromal cell adhesion-mediated drug resistance. Blood. 2009;114(20):4441–4450. - PMC - PubMed
    1. Vogler M, Butterworth M, Majid A, et al. Concurrent up-regulation of BCL-XL and BCL2A1 induces approximately 1000-fold resistance to ABT-737 in chronic lymphocytic leukemia. Blood. 2009;113(18):4403–4413. - PubMed
    1. Brahmbhatt H, Oppermann S, Osterlund EJ, Leber B, Andrews DW. Molecular pathways: leveraging the BCL-2 interactome to kill cancer cells--mitochondrial outer membrane permeabilization and beyond. Clin Cancer Res. 2015;21(12):2671–2676. - PubMed

MeSH terms