. 2016 Jun 14:6:27705.
doi: 10.1038/srep27705.

AtDOF5.4/OBP4, a DOF Transcription Factor Gene that Negatively Regulates Cell Cycle Progression and Cell Expansion in Arabidopsis thaliana

Affiliations

AtDOF5.4/OBP4, a DOF Transcription Factor Gene that Negatively Regulates Cell Cycle Progression and Cell Expansion in Arabidopsis thaliana

Peipei Xu et al. Sci Rep. .

Abstract

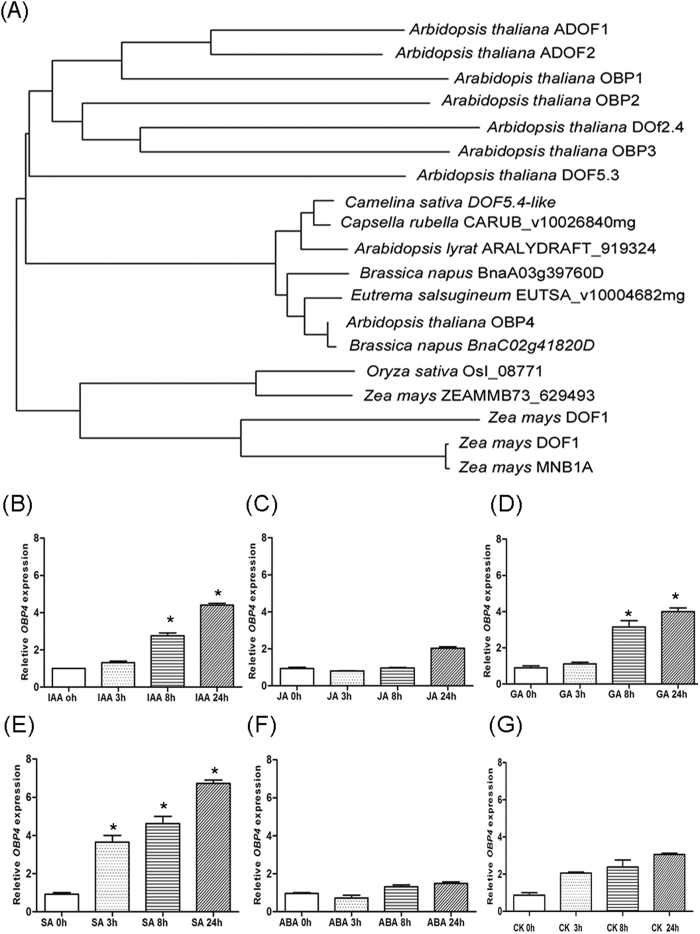
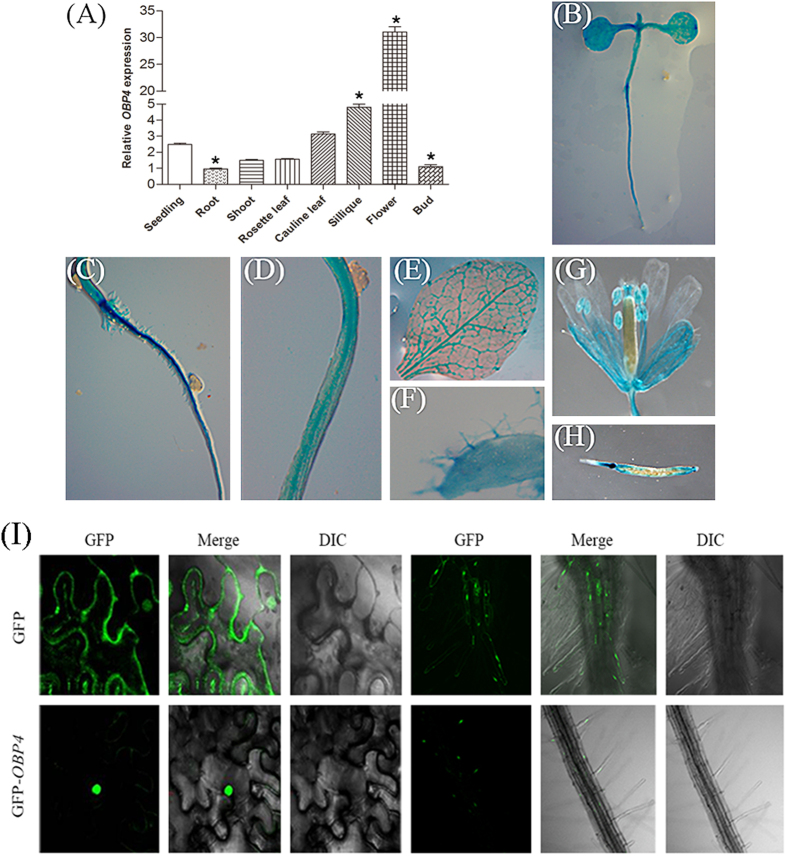
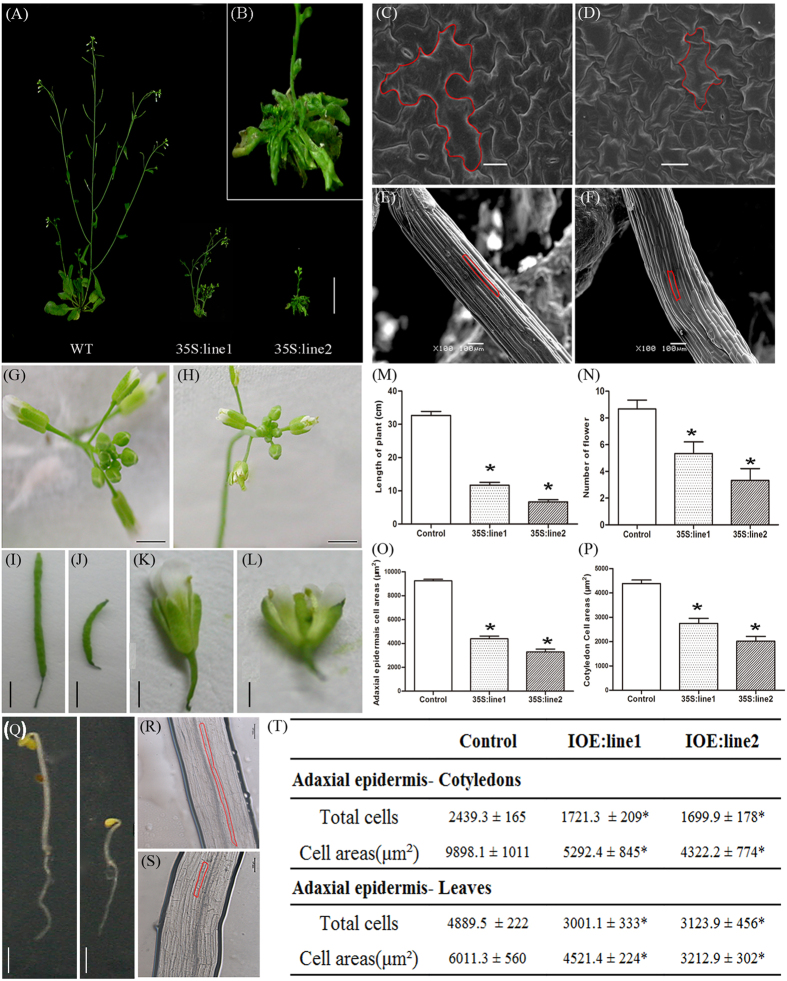
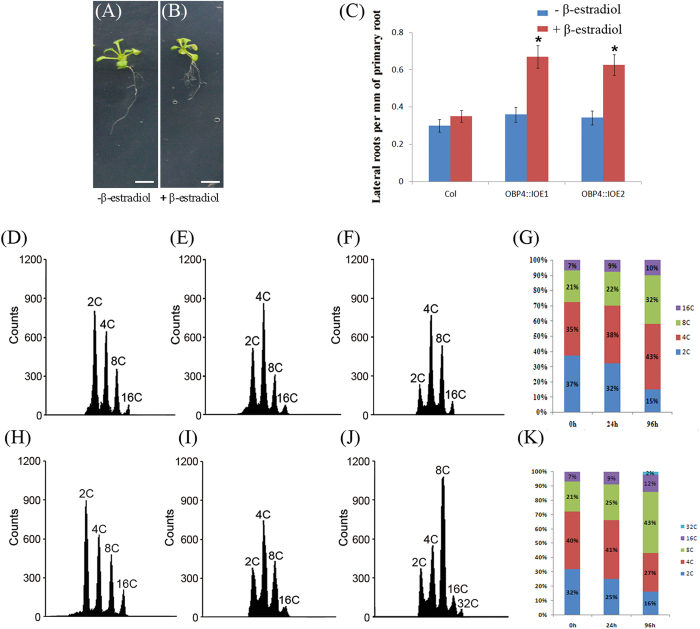
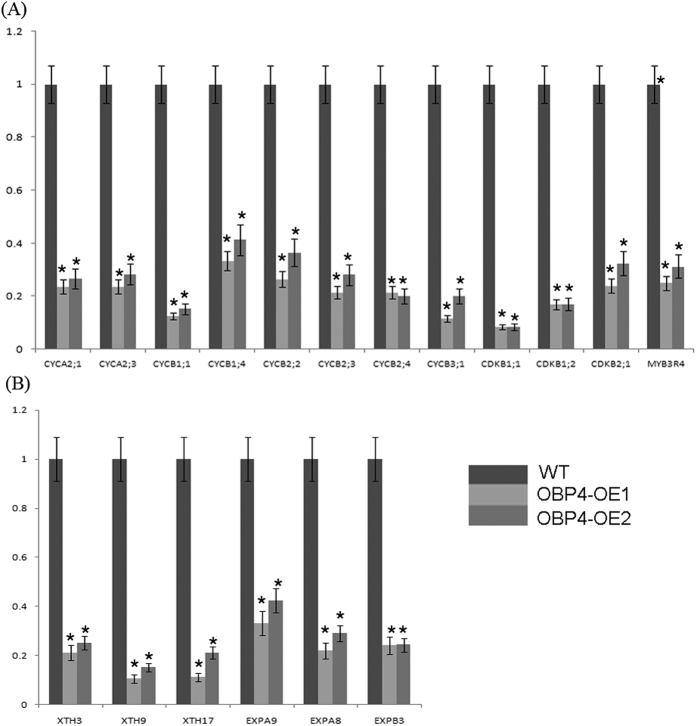
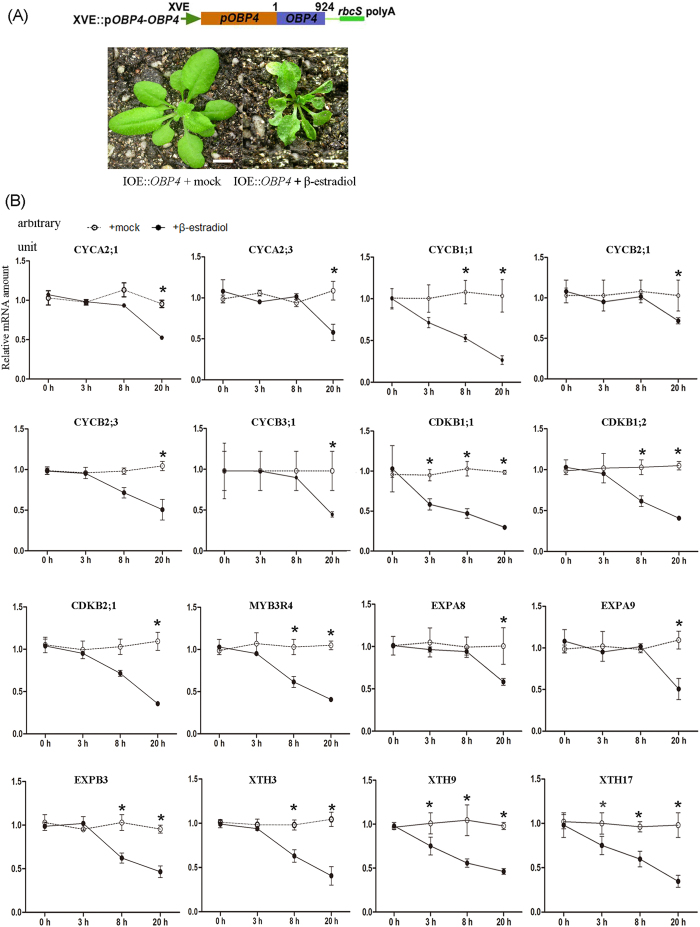
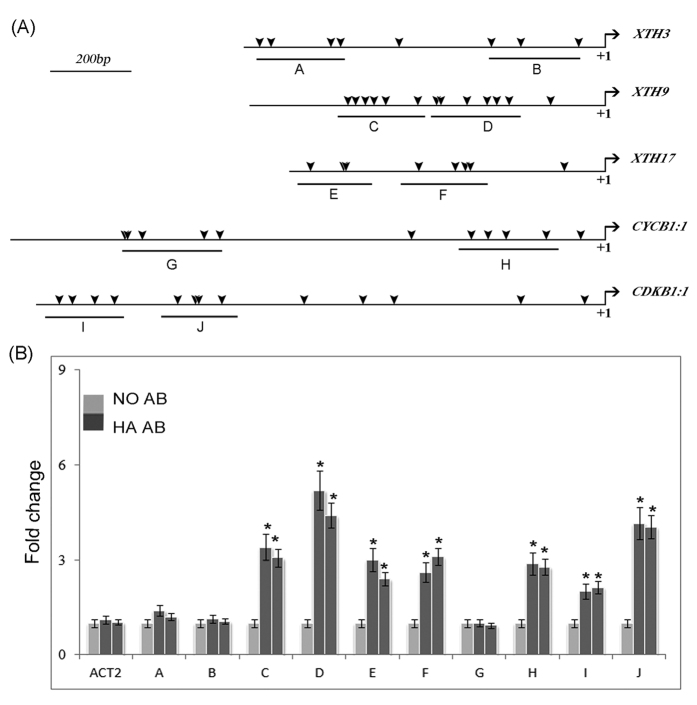
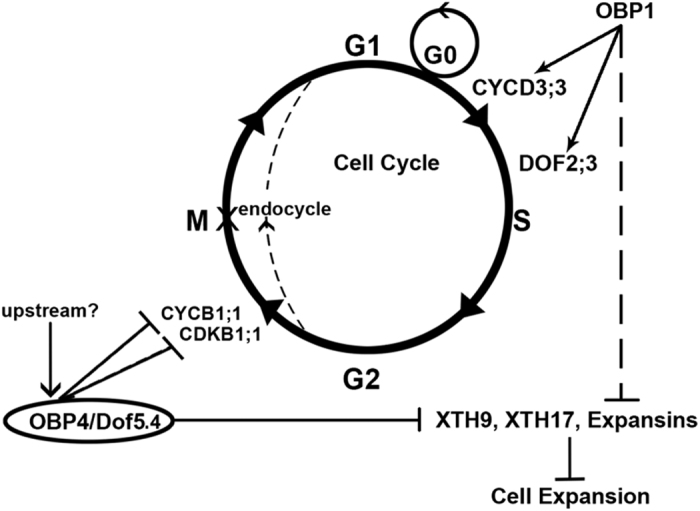
In contrast to animals, plant development involves continuous organ formation, which requires strict regulation of cell proliferation. The core cell cycle machinery is conserved across plants and animals, but plants have developed new mechanisms that precisely regulate cell proliferation in response to internal and external stimuli. Here, we report that the DOF transcription factor OBP4 negatively regulates cell proliferation and expansion. OBP4 is a nuclear protein. Constitutive and inducible overexpression of OBP4 reduced the cell size and number, resulting in dwarf plants. Inducible overexpression of OBP4 in Arabidopsis also promoted early endocycle onset and inhibited cell expansion, while inducible overexpression of OBP4 fused to the VP16 activation domain in Arabidopsis delayed endocycle onset and promoted plant growth. Furthermore, gene expression analysis showed that cell cycle regulators and cell wall expansion factors were largely down-regulated in the OBP4 overexpression lines. Short-term inducible analysis coupled with in vivo ChIP assays indicated that OBP4 targets the CyclinB1;1, CDKB1;1 and XTH genes. These results strongly suggest that OBP4 is a negative regulator of cell cycle progression and cell growth. These findings increase our understanding of the transcriptional regulation of the cell cycle in plants.


Figures

Figure 1
Figure 1. Homologous alignment and analysis of OBP4 levels.
(A) Phylogenetic comparison of DOF protein sequences from Arabidopsis thaliana, Brassica napus, Oryza sativa, Capsella rubella, Camelina sativa and Eutrema salsugineum in the database. Alignments were made by ClustalW2 and MEGA5.1 software using the default parameters and excluding positions with gaps. To determine OBP4 expression in response to hormone treatment, eight-day-old seedlings were transferred to fresh medium (mock), or medium that contained (B) IAA (0.25 μM) (C) GA (0.25 μM) (D) JA (0.25 μM) (E) SA (0.5 μM) (F) ABA (0.1 μM) or (G) CK (0.1 μM) for the indicated period. RNA was then isolated from whole seedlings and analysed. Three biological and technical replicates were used. Asterisks indicate significant differences, p < 0.05.
Figure 2
Figure 2. Tissue and cell cycle-dependent OBP4 expression patterns and subcellular localization.
(A) qPCR analysis of OBP4 gene expression level. (BG) GUS promoter analysis of OBP4 tissue-specific expression. (B) Seedling at 6 days after germination. (C) Roots. (D) Hypocotyls. (E) Rosette leaves. (F) Trichome. (G) Sepal of flower and anther. (H) Siliques. (I) Subcellular localization of the vector control and OBP4 in tobacco epidermal cells and transgenic Arabidopsis root cells. DIC, differential interference contrast, referring to bright-field images of the cells. Asterisks indicate significant differences, p < 0.05.
Figure 3
Figure 3. Phenotypes of transgenic plants overexpressing OBP4.
Six-week-old (A) wild-type and (B) 35 S::OBP4 plants grown under long-day conditions. The heights of the inflorescence stems of at least 7 plants were measured. (M) The plant height and (N) the flower number of the wild-type and 35 S::OBP4 plants. Two-week-old adaxial epidermis of and basal part of hypocotyls from (C,E) wild-type and (D,F) 35 S::OBP4 leaves were visualized by scanning electron microscopy. The red outlines indicate the cell boundary of one epidermal cell. Cell area analysis of (O) epidermal cells and (P) cotyledon cells. The bars represent the SD. Inflorescence morphology of (G) wild-type and (H) 35 S::OBP4 plants. Silique analysis of (I) wild-type and (J) 35 S::OBP4 plants. Flower morphology of (K) wild-type and (b) 35 S::OBP4 plants. (Q) Seedlings of control (left) and pER8::OBP4 (right) plants grown on MS medium supplied with 20 μM estradiol in the dark. Hypocotyls of (S) control and (R) pER8::OBP4 dark-grown seedlings (Scale bar = 100 μm). The red outlines indicate the cell boundary of one hypocotyl cell. (T) Analysis of epidermal cells of cotyledons and the fourth rosette leaf of wild-type and pER8::OBP4 plants (data are the mean ± SD, n = 7). Scale bars = 5 cm in (A,B); 0.4 cm in (K,L); 0.3 cm in (G–J); 100 μm in (C-F). Asterisks indicate significant differences, p < 0.05.
Figure 4
Figure 4. Flow cytometric analysis of cell cycle progression.
(A–C) Plant phenotypes in two induced OBP4 overexpression lines (pER8 line 1, pER8 line 2). The images are from the mid-portion of each root of 13-day-old plants grown on MS solid medium (A) without or (B) with 20 μm estradiol induction for 5 days. Scale bar = 0.5 cm. (C) The root lengths and lateral root number were measured before and after induction. Flow cytometric analysis of wild-type (D–G) and pER8::OBP4 (H–K) in DAG 7, DAG 8, and DAG 11 seedlings after 0, 1, and 4 days of 20 μm estradiol induction, respectively. 2 C, 4 C, 8 C, 16 C and 32 C represent the DAPI signals that correspond to nuclei with different DNA contents. Flow cytometric analysis was repeated three times. The average ( ± SD) from more than 5 seedlings for each time point is presented. Asterisks indicate significant differences, p < 0.05.
Figure 5
Figure 5. OBP4 regulates the expression of core cell cycle genes and cell expansion factors.
(A) Using qRT-PCR analysis, we confirmed that the cyclin genes CYCA2;1, CYCA2;4, CYCB1;1, CYCB1;4, CYCB2;2, CYCB2;3, CYCB2;4, CYCB3;1, CDKB1;1, CDKB1;2, CDKB2;1 and a G2-specific regulator, MYB3R4, were repressed strongly in OBP4-OE plants. (B) The cell expansion factor genes XHT3, XTH9, XTH17, EXPA9, EXPA8 and EXPB3 were strongly repressed in OBP4-OE. Expression levels were normalized to ACTIN2 expression as an internal control. The values shown are the means ± SD. Experiments were performed three times. Asterisks indicate significant differences, p < 0.05.
Figure 6
Figure 6. Search for immediate downstream genes of OBP4 using an estradiol-inducible transgenic plant.
(A) pER8::ProOBP4::OBP4 construct. The OBP4 gene was driven by the OBP4 promoter. The pER8 plant is shown before and after β-estradiol treatment. Leaf development was partly inhibited by estradiol induction in the seedlings. Scale bar = 0.5 cm. (B) Time-course induction analysis of the 10 cell cycle-related genes and 6 cell wall modification genes performed using real-time RT-PCR analysis. pER8::ProOBP4::OBP4 plant after a single addition of estradiol (20 μm). RNA samples were extracted from pER8::ProOBP4::OBP4 leaves at 0, 3, 8, or 20 h after mock (circles) or estradiol (dots) treatment. Vertical axis indicates the relative mRNA amount after β-estradiol treatment. Horizontal axis indicates the time after treatment. The bars indicate the SD. Asterisks indicate significant differences, p < 0.05.
Figure 7
Figure 7. ChIP analysis to verify OBP4 target genes.
(A) The sequence regions used for ChIP assays are marked in the gene promoters (A–K, top panel). DOF binding motifs are indicated as arrowheads. (B) pER8::OBP4::HA-1 and pER8::OBP4::HA-2 transgenic plants grown on MS-agar plates for 2 weeks were used for ChIP assays (bottom panel). The enrichment shown was calculated as the DNA level of each fragment in the β-estradiol-treated sample divided by that in the DMSO-treated sample. Anti-HA antibody was used to precipitate OBP4-HA. Three measurements were averaged for individual assays. Bars indicate the SD. The values in Col-0 plants were set to 1 after normalization to ACT2 for qPCR analysis. Asterisks indicate significant differences, p < 0.05.
Figure 8
Figure 8. Model of OBP4 function in cell cycle regulation and cell expansion.
Model of the OBP4 and OBP1 regulatory network. We inferred that the cell cycle regulators CYCB1;1 and CDKB1;1 and the cell expansion factors XTH9 and XTH17 are OBP4 target genes. We also showed that OBP4 negatively affects both cell cycle progression and cell expansion. OBP4 overexpression resulted in arrested development of Arabidopsis plants, with fewer and smaller cells. While OBP1 positively regulates CYCD3;3 and DOF2.3. OBP1 negatively affects cell expansion. The dotted line indicates entry to endoreplication.

Similar articles

Cited by

References

    1. Aggarwal P. et al.. The TCP4 transcription factor of Arabidopsis blocks cell division in yeast at G1–>S transition. Biochem Biophys Res Commun 410, 276–281 (2011). - PubMed
    1. Bernstein H. S. & Coughlin S. R. A mammalian homolog of fission yeast Cdc5 regulates G2 progression and mitotic entry. Journal of Biological Chemistry 273, 4666–4671 (1998). - PubMed
    1. Boudolf V. et al.. B1-type cyclin-dependent kinases are essential for the formation of stomatal complexes in Arabidopsis thaliana. Plant Cell 16, 945–955 (2004a). - PMC - PubMed
    1. Boudolf V. et al.. CDKB1;1 forms a functional complex with CYCA2;3 to suppress endocycle onset. Plant Physiol 150, 1482–1493 (2009). - PMC - PubMed
    1. Boudolf V. et al.. The plant-specific cyclin-dependent kinase CDKB1;1 and transcription factor E2Fa-DPa control the balance of mitotically dividing and endoreduplicating cells in Arabidopsis. Plant Cell 16, 2683–2692 (2004b). - PMC - PubMed

Publication types

MeSH terms

LinkOut - more resources