. 2016 Jul 29;291(31):16375-89.
doi: 10.1074/jbc.M116.735431. Epub 2016 Jun 13.

Ligand Binding Ensembles Determine Graded Agonist Efficacies at a G Protein-coupled Receptor

Affiliations

Ligand Binding Ensembles Determine Graded Agonist Efficacies at a G Protein-coupled Receptor

Andreas Bock et al. J Biol Chem. .

Abstract

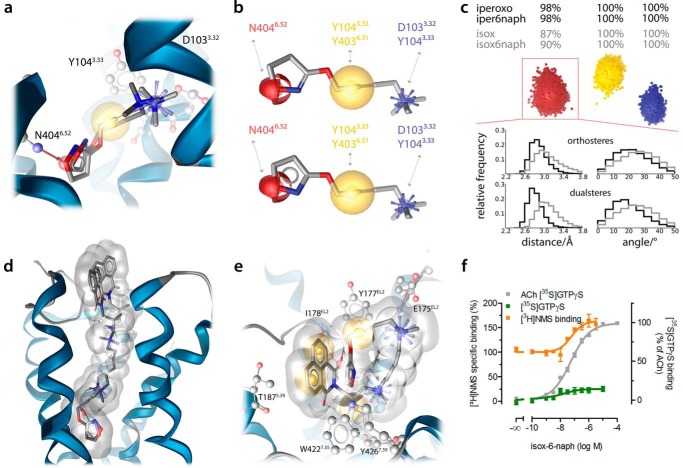
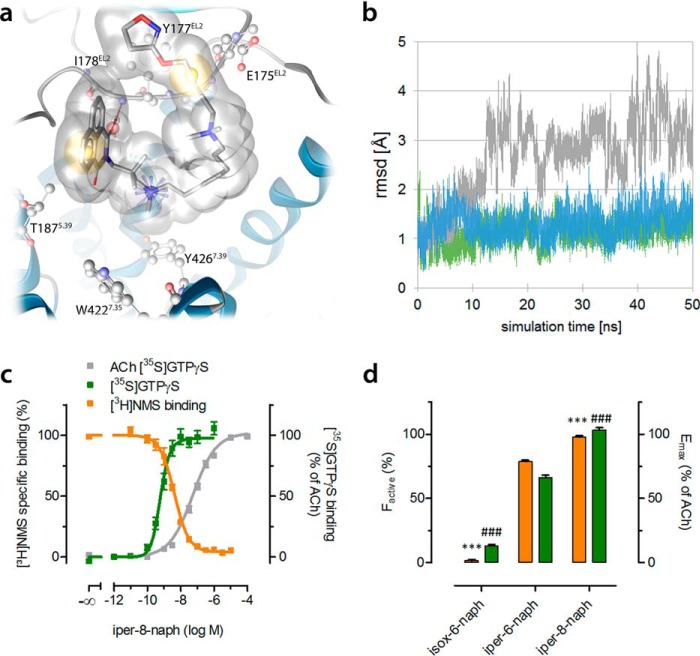
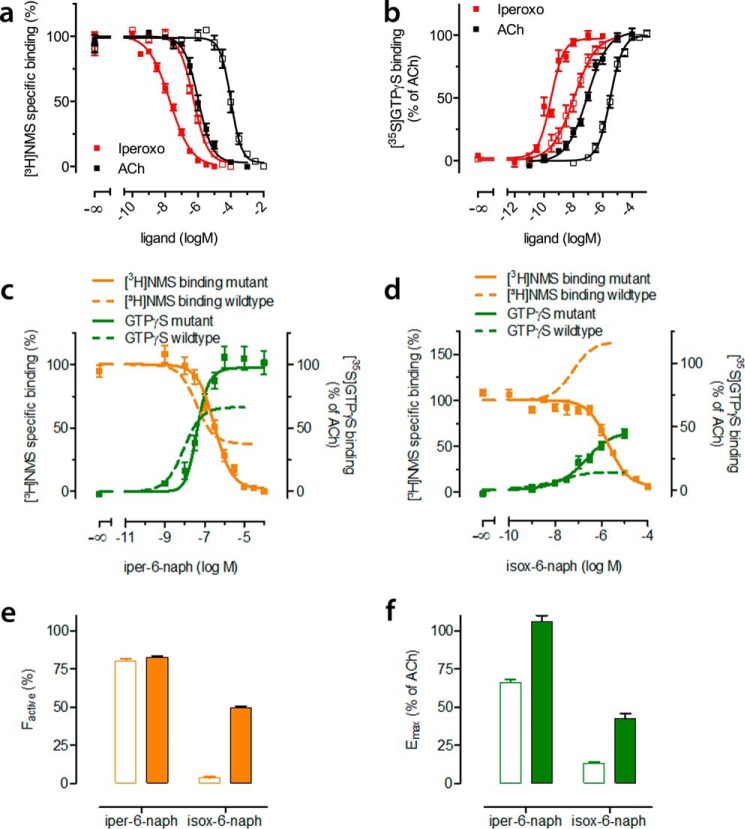
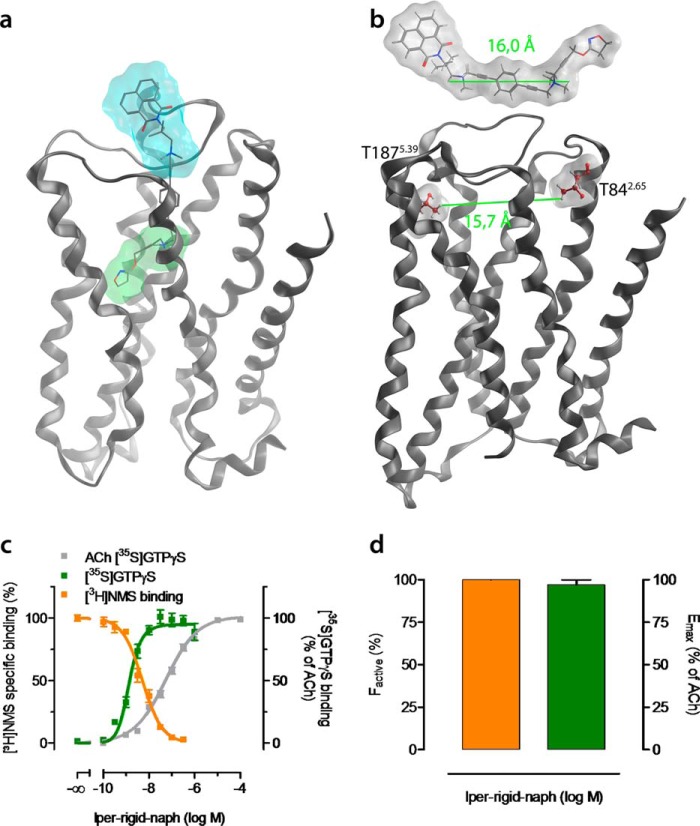
G protein-coupled receptors constitute the largest family of membrane receptors and modulate almost every physiological process in humans. Binding of agonists to G protein-coupled receptors induces a shift from inactive to active receptor conformations. Biophysical studies of the dynamic equilibrium of receptors suggest that a portion of receptors can remain in inactive states even in the presence of saturating concentrations of agonist and G protein mimetic. However, the molecular details of agonist-bound inactive receptors are poorly understood. Here we use the model of bitopic orthosteric/allosteric (i.e. dualsteric) agonists for muscarinic M2 receptors to demonstrate the existence and function of such inactive agonist·receptor complexes on a molecular level. Using all-atom molecular dynamics simulations, dynophores (i.e. a combination of static three-dimensional pharmacophores and molecular dynamics-based conformational sampling), ligand design, and receptor mutagenesis, we show that inactive agonist·receptor complexes can result from agonist binding to the allosteric vestibule alone, whereas the dualsteric binding mode produces active receptors. Each agonist forms a distinct ligand binding ensemble, and different agonist efficacies depend on the fraction of purely allosteric (i.e. inactive) versus dualsteric (i.e. active) binding modes. We propose that this concept may explain why agonist·receptor complexes can be inactive and that adopting multiple binding modes may be generalized also to small agonists where binding modes will be only subtly different and confined to only one binding site.

Keywords: G protein-coupled receptor (GPCR); chemical biology; drug design; dualsteric ligands; dynamic ligand binding; dynophores; ligand binding ensembles; molecular dynamics; molecular pharmacology; partial agonist.


Figures

FIGURE 1.
FIGURE 1.
Iper-6-naph adopts two distinct binding modes. a, theory of dynamic ligand binding. The partial agonist iper-6-naph consists of two pharmacophores, one active (green triangle) and one inactive (blue square) moiety connected by a flexible linker (black zigzag line). Dynamic ligands may bind to a receptor population in two distinct orientations, the dualsteric binding pose and the purely allosteric binding pose (see the receptor on the left and right sides, respectively). In the dualsteric pose, the active moiety binds to the orthosteric binding site (green ellipsoid), and the inactive moiety binds to the allosteric binding site (cyan ellipsoid). Receptors bound to iper-6-naph in the dualsteric pose induce receptor activation. In the purely allosteric binding pose, iper-6-naph resides entirely in the allosteric binding site, precluding receptor activation. b–d, equilibrium binding of iper-6-naph (b), the allosteric ligand 6-naph (c), and the orthosteric agonist iperoxo (d) competing against the orthosteric probe [3H]NMS to M2AChRs from CHO membranes in HEPES buffer (filled squares) and in Na+/K+/Pi buffer (open squares). Total binding in the absence of test compounds was set to 100%. Data are means ± S.E. from at least four independent experiments conducted in triplicate. Error bars represent S.E.
FIGURE 2.
FIGURE 2.
Remodeling of the tyrosine lid. a, transmembrane view of the active M2AChR crystal structure with the orthosteric agonist iperoxo (green surface) and the positive allosteric modulator LY2119620 (cyan surface). The tyrosine lid that separates the orthosteric and allosteric binding sites is shown in red. Allosteric key residues are shown in orange. b, top view snapshots from an MD simulation of the iperoxo-bound crystal structure unveil the conformational flexibility of the tyrosine lid, especially tyrosine Tyr-4267.39. c, based on the sampling of side chain conformations, the tyrosine lid was remodeled for binding mode investigations on dualsteric agonists.
FIGURE 3.
FIGURE 3.
Structural characteristics of a ligand binding ensemble. Transmembrane view of representative conformations of M2AChR complexes with the dynamic ligand iper-6-naph (a and c) in two distinct binding orientations, dualsteric (a) and purely allosteric (c). The boxed parts of a and c illustrate in more detail ligand-receptor interactions by three-dimensional pharmacophores. Yellow spheres indicate lipophilic contacts, red arrows indicate hydrogen bond acceptors, the purple disk represents a π-stacking interaction, and positively charged centers are shown as blue spheres. b, comparison of iperoxo in its co-crystallized conformation (dark gray) with the orthosteric part of iper-6-naph from an MD simulation (light gray). d, comparison of the binding orientation in the allosteric vestibule of naphmethonium (dark gray) with iper-6-naph (light gray) with key residues for allosteric ligand binding. e, effects of iper-6-naph on [3H]NMS equilibrium binding in HEPES buffer (orange curve) and iper-6-naph-induced M2AChR-mediated G protein activation measured as incorporation of [35S]GTPγS into membranes of CHO-M2AChR cells (green curve). ACh-stimulated [35S]GTPγS binding (gray curve) defined the maximum effect of the system (set to 100%). Basal [35S]GTPγS binding in the absence of ligands was set to 0%. [3H]NMS and [35S]GTPγS binding were plotted on the left and right ordinates, respectively. Data represent mean ± S.E. from four to eight independent experiments conducted in triplicate. f, the fractional population of active agonist·receptor complexes (factive; orange bar) and the overall efficacy of iper-6-naph (Emax; green bar) were plotted on the left and right ordinates, respectively. factive was retrieved by fitting all data points in e globally to an operational model of agonism for dynamic ligands (see “Experimental Procedures”). Error bars represent S.E.
FIGURE 4.
FIGURE 4.
Molecular structures of all chemical probes.
FIGURE 5.
FIGURE 5.
Decrease of agonist efficacy is due to the preference for the purely allosteric binding mode. a, comparison of iperoxo in its co-crystallized conformation (dark gray) with isox from an MD simulation (light gray). The yellow spheres indicate lipophilic contacts, the red sphere indicates a hydrogen bond acceptor, and the positively charged center is shown as a blue star. b, similar pharmacophoric features of iperoxo (above) and isox (below) with key residues for ligand binding. The yellow spheres indicate lipophilic contacts, the red sphere indicates a hydrogen bond acceptor, and the positively charged center is shown as a blue star. c, the combination of three-dimensional pharmacophores and MD simulations led to the new concept of dynophores (dynamic pharmacophores) that are able to reflect time-dependent changes in the interaction pattern of ligands. The yellow cloud indicates lipophilic contacts, the red cloud indicates a hydrogen bond acceptor, and the positively charged center is shown as a blue cloud. Whereas the positively charged center and the lipophilic contacts could be observed in all frames of the MD simulation, the hydrogen bond acceptor feature was present in almost all frames (98%) for iperoxo and iper-6-naph but only in 87% of all frames for isox and 90% for isox-6-naph. Below, relative frequencies of distance and angle of the hydrogen bond acceptor. Curves for iperoxo and iper-6-naph are shown in black; curves for isox and isox-6-naph are shown in gray. d, the dualsteric binding modes of iper-6-naph (dark gray) and isox-6-naph (light gray) are highly similar. e, three-dimensional pharmacophore analyses of isox-6-naph in the purely allosteric binding mode. Note that isox-6-naph forms an intramolecular π-π stacking interaction between the isoxazole moiety and the allosteric ring system. f, effects of isox-6-naph on [3H]NMS equilibrium binding in HEPES buffer (orange curve) and G protein activation (green curve). [3H]NMS and [35S]GTPγS binding data were plotted on the left and right ordinates, respectively. Data represent mean ± S.E. from four to seven independent experiments conducted in triplicate. Error bars represent S.E.
FIGURE 6.
FIGURE 6.
Increase of agonist efficacy is due to the preference for the dualsteric binding mode. a, three-dimensional pharmacophore analysis of iper-8-naph in the purely allosteric binding mode. Yellow spheres indicate lipophilic contacts, red arrows indicate hydrogen bond acceptors, and positively charged centers are shown as blue spheres. b, deviation of heavy atoms during 50 ns of MD simulation. Whereas isox-6-naph (blue curve) and iper-6-naph (green curve) remain in their orientation, iper-8-naph (gray curve) poorly fits into the allosteric vestibule. c, effect of iper-8-naph on [3H]NMS equilibrium binding in HEPES buffer (orange curves) and G protein activation (green curves). [3H]NMS and [35S]GTPγS binding were plotted on the left and right ordinates, respectively. Data represent mean ± S.E. from four to seven independent experiments conducted in triplicate. d, the fractional population of active agonist receptor·complexes (factive) stabilized by the indicated dynamic ligands (orange bars) and their overall efficacy (Emax; green bars) relative to ACh were plotted on the left and right ordinates, respectively. factive was retrieved by fitting all data points in Figs. 5f and 6c globally to an operational model of agonism for dynamic ligands. *** and ###, significantly different from iper-6-naph with regard to factive and Emax, respectively (p < 0.001, one-way analysis of variance and Bonferroni's multiple comparison test). Error bars represent S.E.
FIGURE 7.
FIGURE 7.
Mutational disruption of an allosteric center increases the fraction of active ligand·receptor complexes. a, equilibrium binding of ACh and iperoxo to hM2 wild type (filled squares) and triple mutant receptors (open squares) competing against the orthosteric probe [3H]NMS. Total binding in the absence of test compounds was set to 100%. Data are means ± S.E. from at least three independent experiments conducted in triplicate. b, [35S]GTPγS binding mediated by hM2 wild type (filled squares) and triple mutant receptors (open squares) reflects receptor activation induced by ACh and iperoxo. [35S]GTPγS binding in the absence of ligand was set to 0%, and maximal ligand-induced [35S]GTPγS binding was set to 100%. Data are means ± S.E. from at least four independent experiments conducted in triplicate. c and d, displacement of [3H]NMS equilibrium binding (orange curves) by iper-6-naph (c) and isox-6-naph (d) in HEPES buffer and G protein activation (green curves). For comparison, [3H]NMS equilibrium and [35S]GTPγS binding data from wild type CHO-M2AChR cells are shown in orange and green dashed lines, respectively. [3H]NMS and [35S]GTPγS binding were plotted on the left and right ordinates, respectively. Data in c and d represent mean ± S.E. from four to eight independent experiments conducted in triplicate. e, the fractional population of active M2AChRs (factive) stabilized by the indicated dynamic ligands at hM2 wild type (empty bars) and hM2 triple mutant (filled bars) receptors. f, maximal agonist efficacies (Emax) relative to Ach of the indicated ligands at wild type (empty bars) and allosteric triple mutant (filled bars) receptors. Error bars represent S.E.
FIGURE 8.
FIGURE 8.
Rational design of a full agonist with exclusive dualsteric binding topography. a, transmembrane view of a representative conformation of the M2AChR in complex with iper-rigid-naph in the dualsteric binding mode taken from a 50-ns MD simulation. Agonistic moieties are shown with a green surface; antagonistic moieties are shown with a cyan surface. b, iper-rigid-naph cannot bind in a purely allosteric mode like iper-6-naph (Fig. 3c) because of the rigidified linker that is not able to enter the allosteric binding site. The maximum dilatation of the allosteric vestibule is shown as the distance between Thr-842.65 and Thr-1875.39 (lower green line in b). This conformational constraint allows iper-rigid-naph to only bind in the dualsteric mode. c, effects of iper-rigid-naph on [3H]NMS equilibrium binding in HEPES buffer (orange curve) and iper-rigid-naph-induced G protein activation (green curve). [3H]NMS and [35S]GTPγS binding are plotted on the left and right ordinates, respectively. Data are mean ± S.E. from five to nine independent experiments conducted in triplicate. d, the fractional population of active M2AChRs (factive) stabilized by iper-rigid-naph (orange bar) and its maximal efficacy (Emax; green bar) relative to ACh were plotted on the left and right ordinates, respectively. factive was retrieved by fitting all data points in c globally to an operational model of agonism for dynamic ligands (see “Experimental Procedures”). Error bars represent S.E.

References

    1. Fredriksson R., Lagerström M. C., Lundin L.-G., and Schiöth H. B. (2003) The G-protein-coupled receptors in the human genome form five main families. Phylogenetic analysis, paralogon groups, and fingerprints. Mol. Pharmacol. 63, 1256–1272 - PubMed
    1. Rosenbaum D. M., Rasmussen S. G., and Kobilka B. K. (2009) The structure and function of G-protein-coupled receptors. Nature 459, 356–363 - PMC - PubMed
    1. Katritch V., Cherezov V., and Stevens R. C. (2013) Structure-function of the G protein-coupled receptor superfamily. Annu. Rev. Pharmacol. Toxicol. 53, 531–556 - PMC - PubMed
    1. Venkatakrishnan A. J., Deupi X., Lebon G., Tate C. G., Schertler G. F., and Babu M. M. (2013) Molecular signatures of G-protein-coupled receptors. Nature 494, 185–194 - PubMed
    1. Ritter S. L., and Hall R. A. (2009) Fine-tuning of GPCR activity by receptor-interacting proteins. Nat. Rev. Mol. Cell Biol. 10, 819–830 - PMC - PubMed