. 2016 Jun 20;213(6):679-92.
doi: 10.1083/jcb.201601099. Epub 2016 Jun 13.

Divergent regulation of functionally distinct γ-tubulin complexes during differentiation

Affiliations

Divergent regulation of functionally distinct γ-tubulin complexes during differentiation

Andrew Muroyama et al. J Cell Biol. .

Abstract

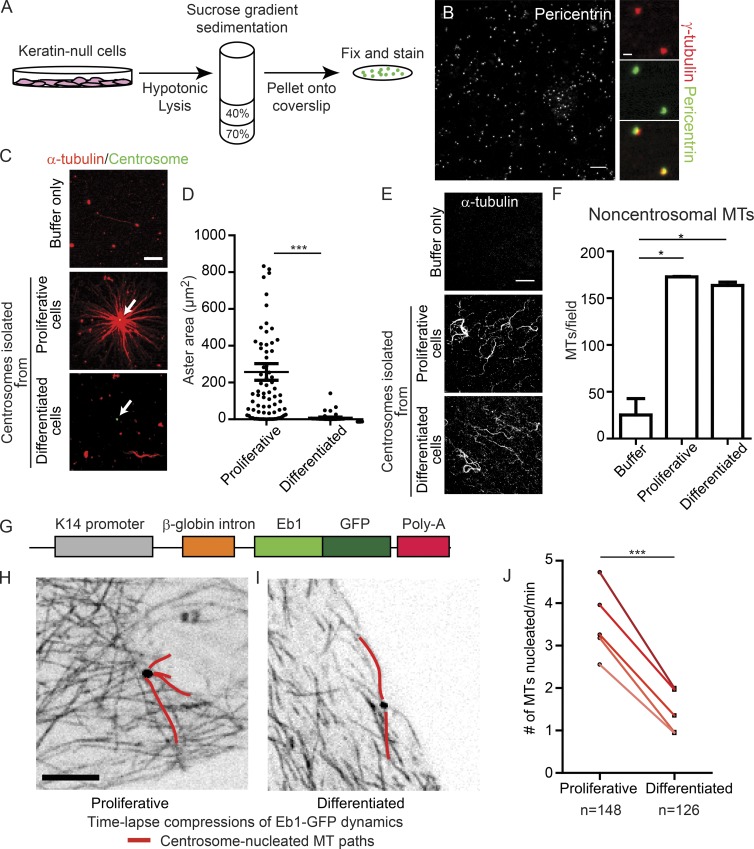
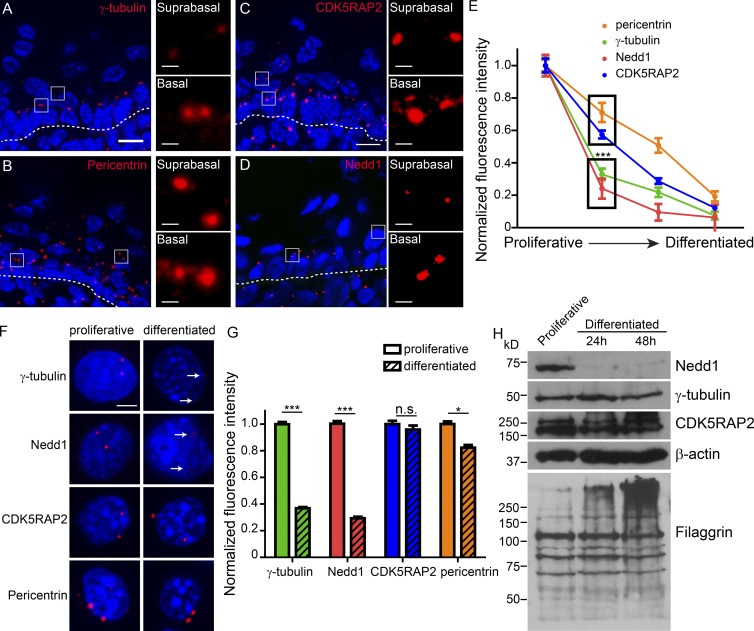
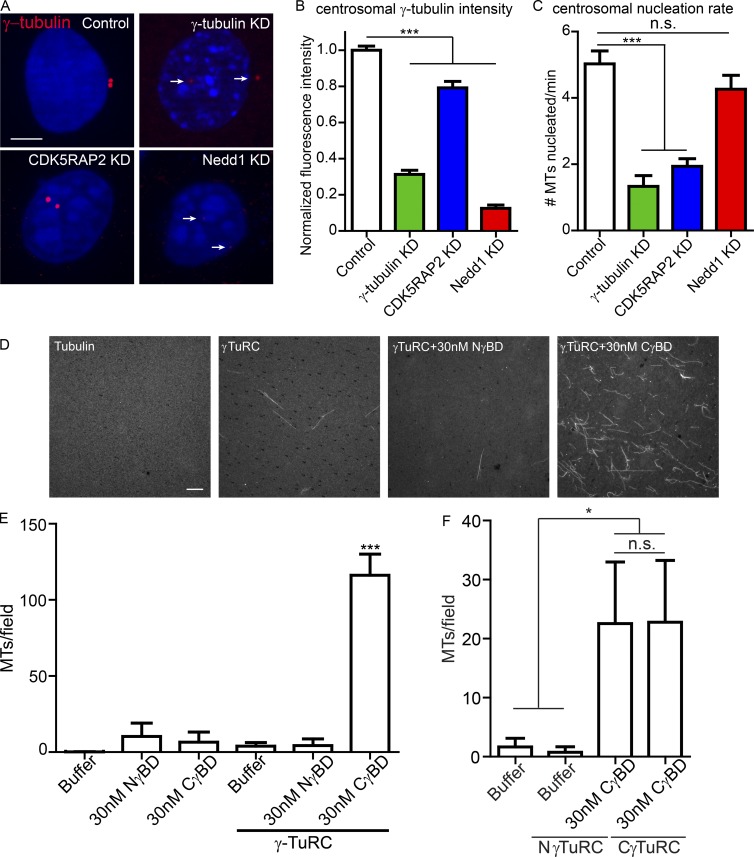
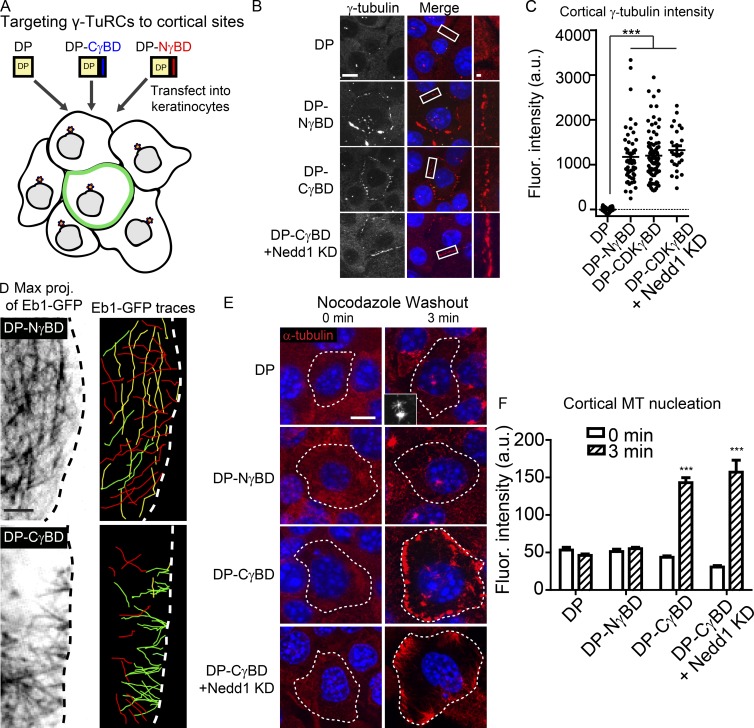
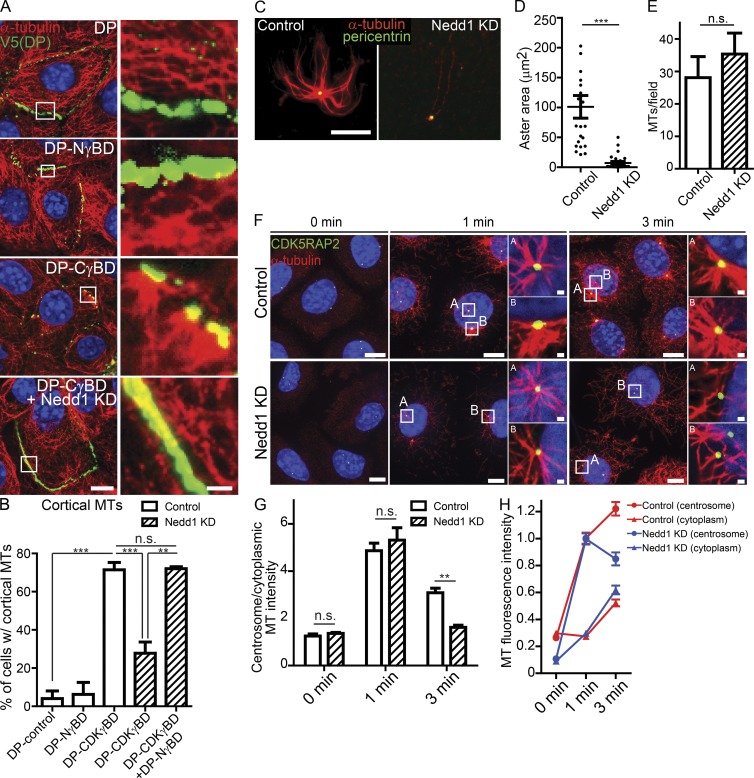
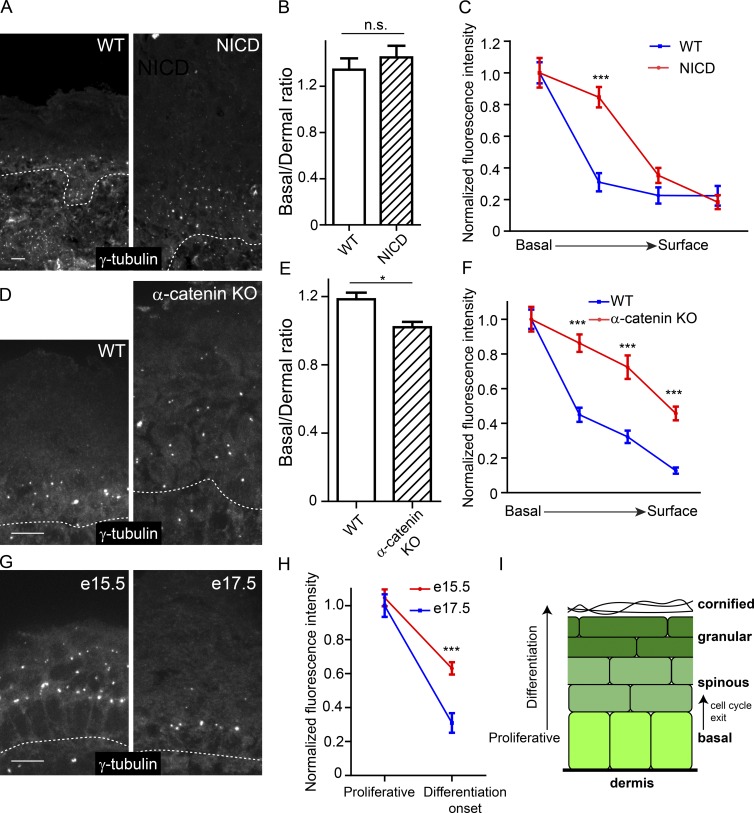
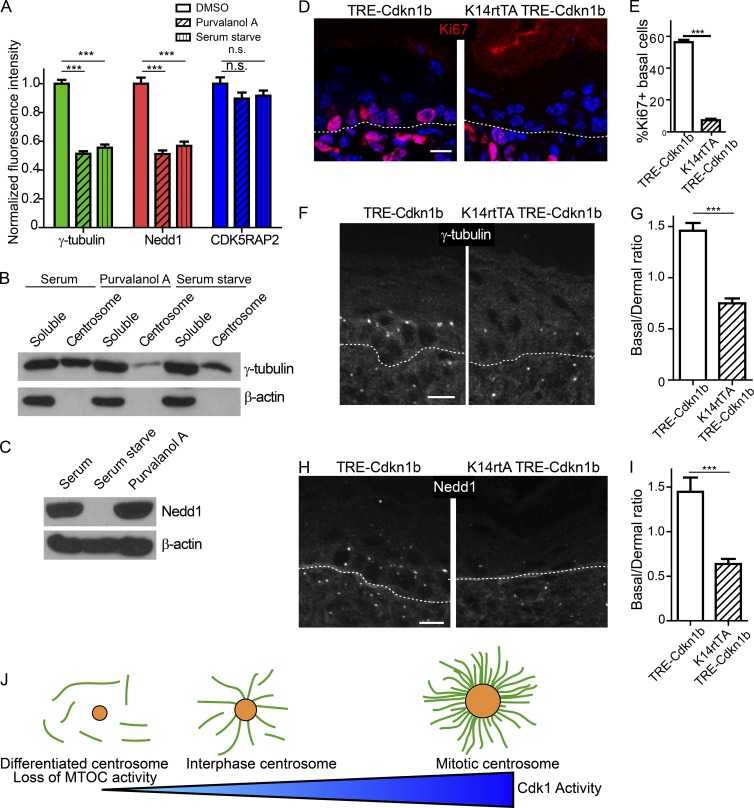
Differentiation induces the formation of noncentrosomal microtubule arrays in diverse tissues. The formation of these arrays requires loss of microtubule-organizing activity (MTOC) at the centrosome, but the mechanisms regulating this transition remain largely unexplored. Here, we use the robust loss of centrosomal MTOC activity in the epidermis to identify two pools of γ-tubulin that are biochemically and functionally distinct and differentially regulated. Nucleation-competent CDK5RAP2-γ-tubulin complexes were maintained at centrosomes upon initial epidermal differentiation. In contrast, Nedd1-γ-tubulin complexes did not promote nucleation but were required for anchoring of microtubules, a previously uncharacterized activity for this complex. Cell cycle exit specifically triggered loss of Nedd1-γ-tubulin complexes, providing a mechanistic link connecting MTOC activity and differentiation. Collectively, our studies demonstrate that distinct γ-tubulin complexes regulate different microtubule behaviors at the centrosome and show that differential regulation of these complexes drives loss of centrosomal MTOC activity.


Figures

Figure 1.
Figure 1.
Differentiated centrosomes lose MT-anchoring activity and have decreased nucleation activity. (A) Schematic of centrosome isolation from cultured keratin-null cells. (B) Field of isolated centrosomes stained for pericentrin. Bar, 10 µm. Images on the right show colocalization of γ-tubulin and pericentrin in isolated centrosomal puncta. Bar, 1 µm. (C) Representative images of MT assembly assays in the presence of buffer only, centrosomes from proliferative cells, and centrosomes from differentiated cells. Bar, 10 µm. White arrows indicate centrosomes. (D) Quantification of aster area surrounding purified centrosomes from proliferative and differentiated cells (n ≥ 54 centrosomes from three independent experiments). (E) Representative images of fields of free (noncentrosomal) MTs nucleated in reactions as in C. Bar, 10 µm. (F) Quantification of free (noncentrosomal) MTs in reactions as in C (n ≥ 9 fields from two independent experiments). (G) Diagram of construct used to generate Eb1-GFP expressing mice. (H and I) Compressions of Eb1-GFP movies in proliferative (H) or differentiation (I) keratinocytes derived from the Eb1-GFP transgenic mouse. Bar, 10 µm. (J) Quantification of centrosomal nucleation rate in proliferative and differentiated primary keratinocytes. Five separate replicates of paired samples derived from five independent mice are shown (n ≥ 126 centrosomes). A paired design was used because proliferative and differentiated centrosomes can be measured within the same dish. n.s., not significant; *, P < 0.05; **, P < 0.01; ***, P < 0.001. Data are presented as mean ± SEM.
Figure 2.
Figure 2.
Keratinocyte differentiation induces loss of centrosomal γ-tubulin and Nedd1. (A–D) Cryosections of neonatal mouse backskin were stained for centrosomal proteins, as indicated. Dashed lines represent the basement membrane separating underlying dermis from the epidermis. Insets of boxed regions show centrosomes at higher magnification. Bars: (main) 10 µm; (insets) 1 µm. (E) Quantification of fluorescence intensity of centrosomal proteins during epidermal differentiation. Proliferative indicates basal cells, the second time point is the first suprabasal cell layer, the third time point is upper spinous cells, and the fourth is granular cells. (F) Cultured mouse keratinocytes were grown under proliferative conditions or were induced to differentiate and then were stained for centrosomal proteins, as indicated. Arrows indicate low levels of residual centrosomal γ-tubulin and Nedd1 in differentiated keratinocytes. Bar, 5 µm. (G) Quantification of fluorescence intensity of centrosomal proteins in proliferative and differentiated cultured keratinocytes (n ≥ 280 centrosomes from three independent experiments). (H) Western blots of whole-cell lysates prepared from proliferative keratinocytes and keratinocytes at indicated time points after differentiation induction, blotted with antibodies as indicated. n.s., not significant; *, P < 0.05; ***, P < 0.001. Data are presented as mean ± SEM.
Figure 3.
Figure 3.
Nedd1/γ-TuRC and CDK5RAP2/γ-TuRC have different properties in vivo and in vitro. (A) Images of γ-tubulin in control proliferative keratinocytes and those with lentiviral-mediated knockdown of γ-tubulin, CDK5RAP2, or Nedd1. Arrows indicate centrosomes. Bar, 5 µm. (B) Quantification of centrosomal γ-tubulin levels in control, γ-tubulin KD, CDK5RAP2 KD, and Nedd1 KD cells (n ≥ 70 centrosomes from at least two independently derived cell lines for each condition). (C) Centrosomal MT nucleation rate in control, γ-tubulin KD, CDK5RAP2 KD, and Nedd1 KD cells (n ≥ 18 cells from at least two independent experiments). (D) Representative images of fields from MT assembly assays with tubulin alone, γ-TuRC alone, or purified γ-TuRCs incubated with the γ-tubulin binding domain of either Nedd1 or CDK5RAP2. Bar, 10 µm. (E) Quantification of MTs per field in the MT assembly assays, as indicated (n = 40 total random fields for each condition from two independent experiments). Data are presented as mean ± SEM. (F) γ-TuRCs purified by affinity for Nedd1 (NγTuRCs) or CDK5RAP2 (CγTuRCs) were used in MT assembly assays with addition of the γ-tubulin binding domain of CDK5RAP2, as indicated. Quantification of MTs per field in the MT assembly assays, as indicated (n = 15 random fields for each condition from three independent experiments). n.s., not significant; *, P < 0.05; ***, P < 0.001. Data are presented as mean ± SD.
Figure 4.
Figure 4.
CDK5RAP2, but not Nedd1, is sufficient to stimulate γ-TuRC–mediated MT nucleation in vivo. (A) Diagram of the experimental method. (B) γ-Tubulin localization in cells expressing DP alone, DP-NγBD, DP-CγBD, and DP-CγBD + Nedd1KD. Insets show zoomed in cortical regions. Bars: (main) 10 µm; (insets) 1 µm. (C) Quantification of cortical γ-tubulin levels in cells expressing DP, DP-NγBD, DP-CγBD (all n ≥ 50 cells from three independent experiments), and DP-CγBD + Nedd1KD (n = 25 cells from three independent experiments). (D) Compressions of movies (60 s) of GFP-Eb1 showing MT paths in cells expressing DP-NγBD or DP-CγBD (n ≥ 16 cells from three independent experiments). Images on the right are color coded by vectors of growth. Those growing toward the plasma membrane are red, those growing parallel to it are yellow, and those that are growing into the cytoplasm are green. (E) Representative images of transfected cells before and after nocodazole washout showing sites of MT nucleation. Inset shows centrosomal nucleation in control cells. Dotted line indicates the outline of the transfected cell. Bar, 10 µm. (F) Quantification of cortical α-tubulin intensity in control or DP-NγBD, DP-CγBD, or DP-CγBD + Nedd1KD cells 3 min after nocodazole washout (n = 23–92 cells from at least three independent experiments). ***, P < 0.001. Data are presented as mean ± SEM.
Figure 5.
Figure 5.
Nedd1 is required for MT anchoring. (A) Images of MT organization in control, DP-NγBD–, DP-CγBD–, or DP-CγBD + Nedd1KD–expressing cells under steady-state (nonperturbing) conditions. Insets show higher magnifications of cortical regions. Bars: (main) 10 µm; (insets) 2 µm. Note that cell junctions are acting as discrete MTOCs in DP-CγBD–expressing cells. (B) Quantification of the cortical MT-anchoring activity of cells expressing the DP fusion constructs. (C) Representative images of MT assembly assays using centrosomes purified from control and Nedd1 knockdown cells. Bar, 10 µm. (D) Quantification of MT aster area around control and Nedd1 knockdown centrosomes (n ≥ 23 centrosomes from two independent experiments). (E) Quantification of free (noncentrosomal) MTs nucleated by control and Nedd1 knockdown centrosomes (n = 3 independent experiments). (F) Representative images of control and Nedd1 KD cells at indicated time points after nocodazole washout. Insets show zoomed in centrosomes. Bars: (main) 10 µm; (insets) 1 µm. (G) Quantification of the ratio of α-tubulin intensity at the centrosome to intensity in the cytoplasm in control and Nedd1KD keratinocytes after nocodazole washout (n ≥ 146 centrosomes from three independent experiments). (H) Quantification of MT nucleation at the centrosome and cytoplasm after nocodazole washout in control and Nedd1 KD keratinocytes (n ≥ 146 centrosomes from three independent experiments). n.s., not significant; **, P < 0.01; ***, P < 0.001. Data are presented as mean ± SEM.
Figure 6.
Figure 6.
Centrosomal γ-tubulin levels correlate with cell-cycle status and not differentiation state. (A) Immunofluorescence localization of γ-tubulin in WT epidermis and epidermis expressing active Notch (NICD). (B) Quantification of the ratio of centrosomal γ-tubulin in basal cells versus underlying dermal cells (n = 2 control and NICD mice). (C) Quantification of γ-tubulin centrosomal localization from basal cells to terminally differentiated superficial cells. (D) Immunofluorescence localization of γ-tubulin in WT epidermis and α-catenin–null epidermis. (E) Quantification of the ratio of centrosomal γ-tubulin in basal cells verses underlying dermal cells (n = 2 control mice and n = 2 KO mice). (F) Quantification of γ-tubulin centrosomal localization from basal cells to superficial cells (n = 2 control mice and n = 2 KO mice). (G) Immunofluorescence localization of γ-tubulin in WT E15.5 and E17.5 epidermis. (H) Quantification of γ-tubulin centrosomal localization from basal cells and immediate suprabasal cells (n = 2 mice for each stage). Note that the data for the E17.5 mice are the WT data from the NICD mice in B. (I) Schematic of the epidermis showing the transition to a postmitotic state. n.s., not significant; *, P < 0.05; ***, P < 0.001. Data are presented as mean ± SEM. Bars, 10 µm. Dashed lines indicate the basement membrane.
Figure 7.
Figure 7.
Exit from the cell cycle induces centrosome composition changes. (A) Quantification of centrosomal levels of indicated proteins after serum starvation or Purvalanol A treatment (n ≥ 96 centrosomes from two independent experiments). (B) Western blots of γ-tubulin levels in cytoplasmic and centrosomal fractions from control, serum-starved, or Purvalanol A–treated cells. (C) Western blot of total levels of Nedd1 in control, serum-starved, or Purvalanol A–treated cells. (D) Backskin cryosections from postnatal day 1 K14rtTA TRE-Cdkn1b mice and littermate controls, stained for the proliferation marker Ki67. Dashed line marks the basement membrane. Note the loss of Ki67+ cells is specific to the epidermis. (E) Quantification of the percentage of Ki67+ basal cells in control and K14rtTA TRE-Cdkn1b mice (n = 3 mice of each genotype from two independent litters). (F) Immunofluorescence of γ-tubulin in backskins from control and K14rtTA TRE-Cdkn1b mice. (G) Quantification of the ratio of the fluorescence intensity of γ-tubulin on basal cell centrosomes to dermal centrosomes (n = 3 mice of each genotype from two independent litters). (H) Immunofluorescence of Nedd1 in backskins from control and K14rtTA TRE-Cdkn1b mice. (I) Quantification of the ratio of the fluorescence intensity of Nedd1 on basal cell centrosomes to dermal centrosomes (n = 3 mice each genotype from two independent litters). (J) Diagram of the effects of different levels of Cdk1 activity on centrosome morphology and function. Bars, 10 µm. n.s., not significant; ***, P < 0.001. Data are presented as mean ± SEM.

References

    1. Anders A., and Sawin K.E.. 2011. Microtubule stabilization in vivo by nucleation-incompetent γ-tubulin complex. J. Cell Sci. 124:1207–1213. 10.1242/jcs.083741 - DOI - PMC - PubMed
    1. Bartolini F., and Gundersen G.G.. 2006. Generation of noncentrosomal microtubule arrays. J. Cell Sci. 119:4155–4163. 10.1242/jcs.03227 - DOI - PubMed
    1. Blanpain C., Lowry W.E., Pasolli H.A., and Fuchs E.. 2006. Canonical notch signaling functions as a commitment switch in the epidermal lineage. Genes Dev. 20:3022–3035. 10.1101/gad.1477606 - DOI - PMC - PubMed
    1. Brodu V., Baffet A.D., Le Droguen P.M., Casanova J., and Guichet A.. 2010. A developmentally regulated two-step process generates a noncentrosomal microtubule network in Drosophila tracheal cells. Dev. Cell. 18:790–801. 10.1016/j.devcel.2010.03.015 - DOI - PubMed
    1. Choi Y.K., Liu P., Sze S.K., Dai C., and Qi R.Z.. 2010. CDK5RAP2 stimulates microtubule nucleation by the gamma-tubulin ring complex. J. Cell Biol. 191:1089–1095. 10.1083/jcb.201007030 - DOI - PMC - PubMed

Publication types