. 2016 Jun 1;30(11):1327-38.
doi: 10.1101/gad.280834.116.

S1-DRIP-seq identifies high expression and polyA tracts as major contributors to R-loop formation

Affiliations

S1-DRIP-seq identifies high expression and polyA tracts as major contributors to R-loop formation

Lamia Wahba et al. Genes Dev. .

Abstract

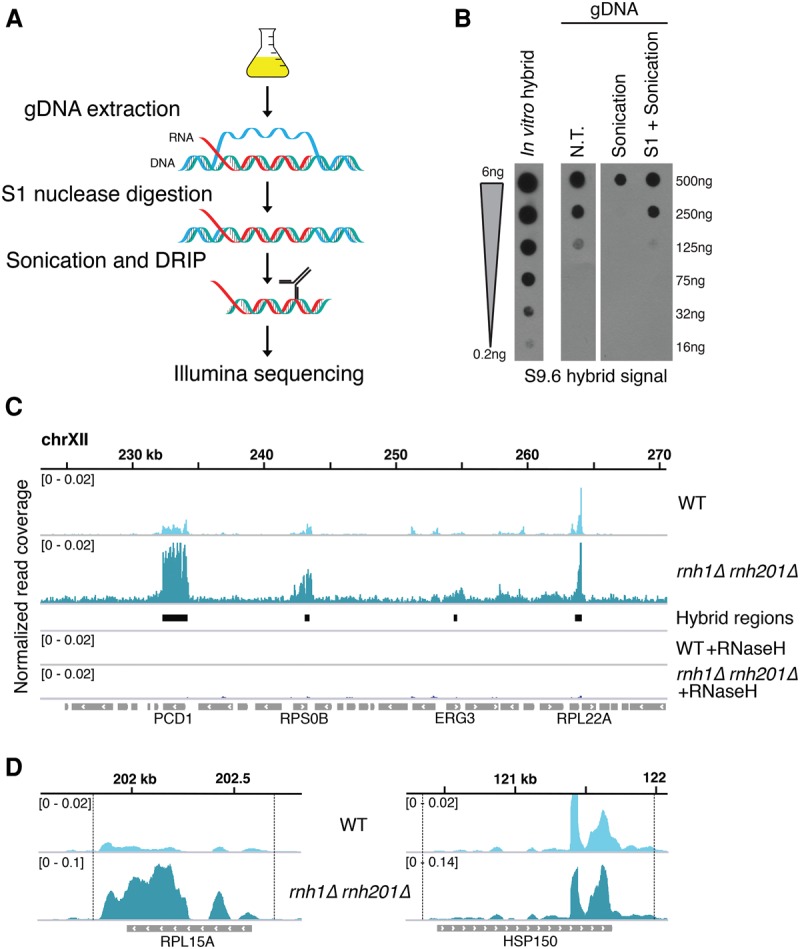
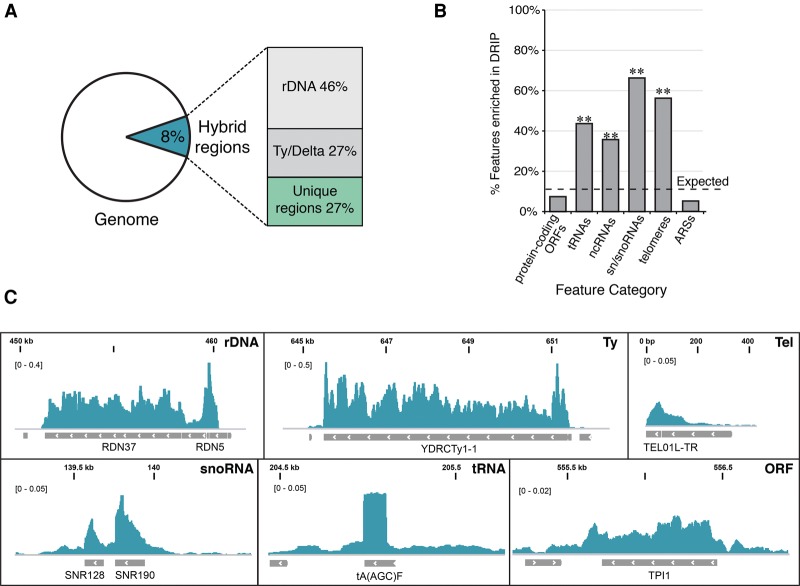
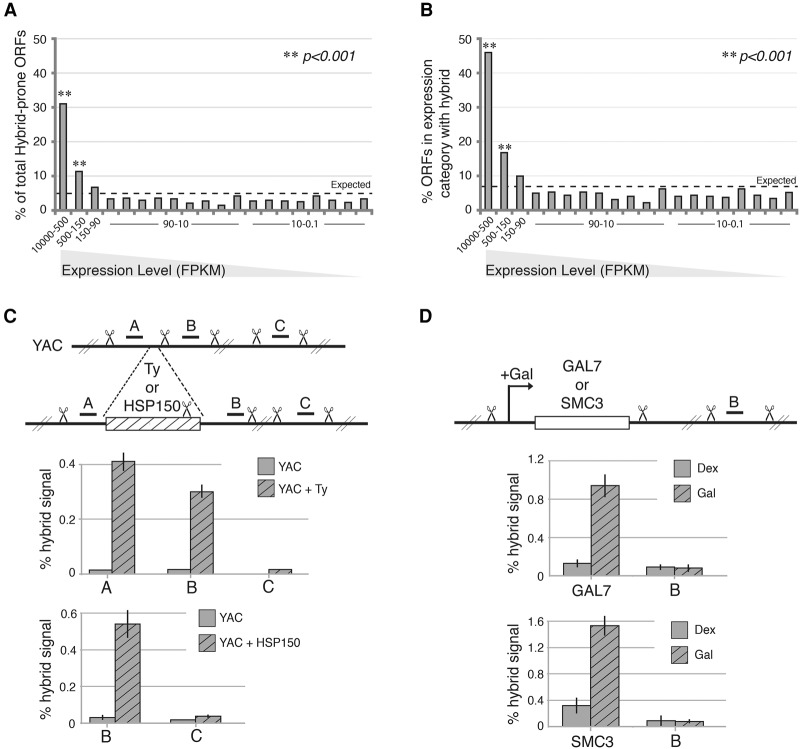
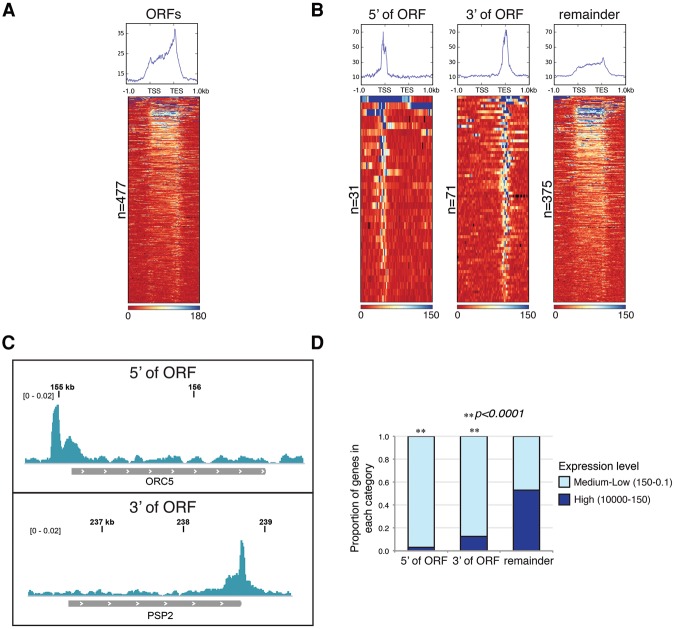
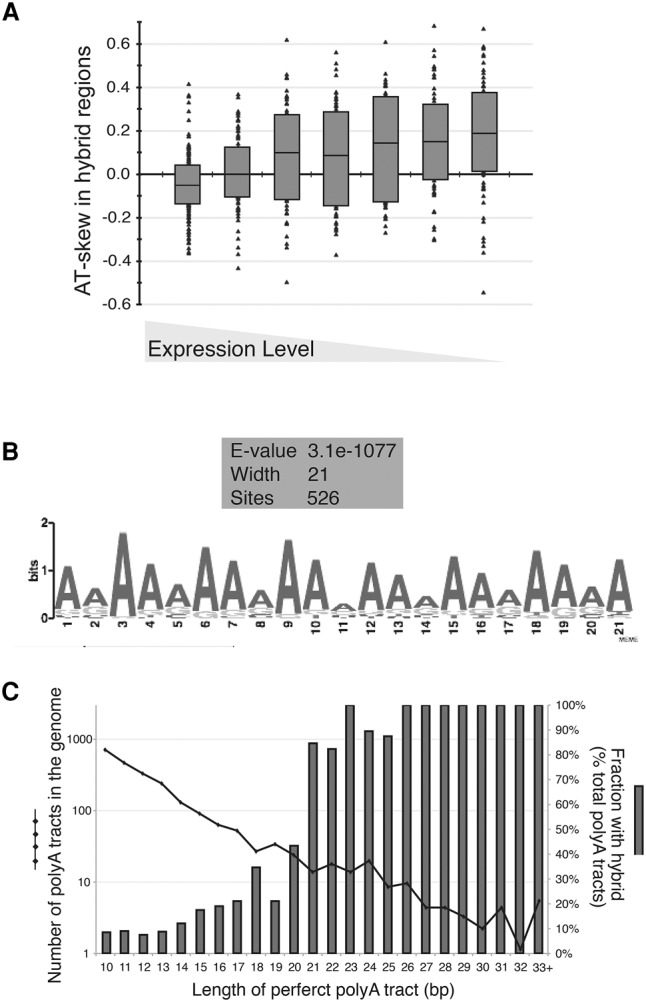
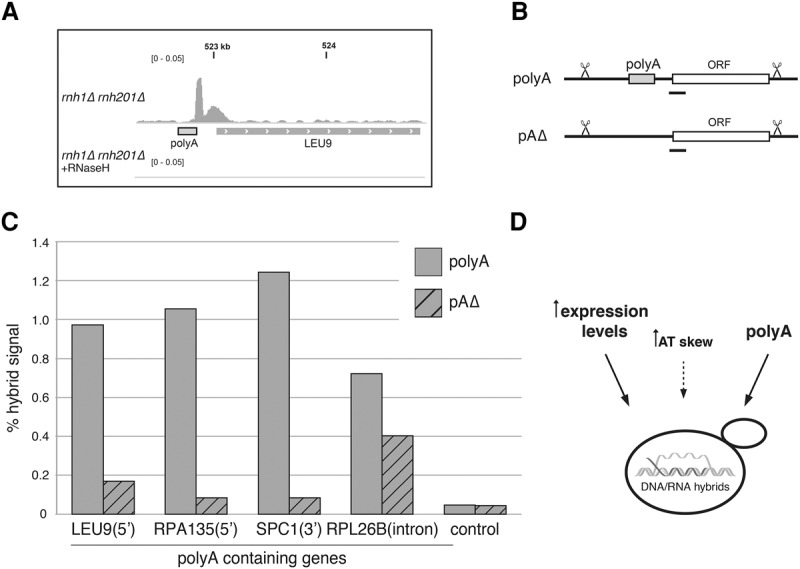
R loops form when transcripts hybridize to homologous DNA on chromosomes, yielding a DNA:RNA hybrid and a displaced DNA single strand. R loops impact the genome of many organisms, regulating chromosome stability, gene expression, and DNA repair. Understanding the parameters dictating R-loop formation in vivo has been hampered by the limited quantitative and spatial resolution of current genomic strategies for mapping R loops. We report a novel whole-genome method, S1-DRIP-seq (S1 nuclease DNA:RNA immunoprecipitation with deep sequencing), for mapping hybrid-prone regions in budding yeast Saccharomyces cerevisiae Using this methodology, we identified ∼800 hybrid-prone regions covering 8% of the genome. Given the pervasive transcription of the yeast genome, this result suggests that R-loop formation is dictated by characteristics of the DNA, RNA, and/or chromatin. We successfully identified two features highly predictive of hybrid formation: high transcription and long homopolymeric dA:dT tracts. These accounted for >60% of the hybrid regions found in the genome. We demonstrated that these two factors play a causal role in hybrid formation by genetic manipulation. Thus, the hybrid map generated by S1-DRIP-seq led to the identification of the first global genomic features causal for R-loop formation in yeast.

Keywords: DNA:RNA hybrids; R loops; RNase H; polyA tracts; transcription.


Figures

Figure 1.
Figure 1.
S1-DRIP-seq allows quantitative recovery and high-resolution mapping of R loops. (A) Overview of S1-DRIP-seq workflow. Genomic DNA (gDNA) was prepared from log phase cells. Hybrids were stabilized by treatment with S1 nuclease, which preferentially degraded single-stranded nucleic acids prior to sonication. Hybrids were then immunoprecipitated with S9.6 α-DNA:RNA hybrid antibody, and sequencing libraries were prepared. (B) Dot blot showing the effect of S1 treatment on genomic R loops. The first lane shows serial dilutions of an in vitro synthesized DNA:RNA hybrid. Yeast genomic DNA was either not treated (N.T.), sonicated (sonication), or treated with S1 nuclease prior to sonication (S1+Sonication), and serial dilutions were spotted and probed with the S9.6 antibody. (C) Snapshot of S1-DRIP-seq reads on chromosome XII (223,000–271,000). Normalized read coverage from wild type and rnh1Δ rnh201Δ are shown in the first and second rows, respectively, with the model-based analysis of ChIP-seq (MACS2)-identified hybrid regions denoted below. The forth and fifth rows show reads from wild-type (WT) and rnh1Δrnh201Δ genomic DNA treated with RNase H in vitro prior to immunoprecipitation. The sixth row shows features annotated in the Saccharomyces Genome Database, with features overlapping with hybrid regions indicated below. (D) Snapshots of two hybrid-associated features—RPL15A (left panel) and HSP150 (right panel)—from wild type and rnh1Δ rnh201Δ. Note the change in axes done to allow a better display of peak shapes in both wild type and rnh1Δrnh201Δ.
Figure 2.
Figure 2.
Genomic distribution of hybrid-prone regions. (A) The percentage of base pairs in the genome prone to hybrid formation in rnh1Δrnh201Δ and the breakdown relative to repetitive (rDNA and Ty/Delta) and nonrepetitive (unique) regions. (B) Hybrid-prone features. The proportion of major genome features identified as hybrid-prone. The dotted line indicates the proportion of all features identified as hybrid-prone (9.6%). P-values were generated by a one-tailed Fisher's test. (**) P < 0.001. (C) Snapshots of representative hybrid-enriched features from rnh1Δ rnh201Δ. From left to right and top to bottom: rDNA (RDN37-1, chromosome XII, 450,000–460,000), Ty element (YDRCTy1-1, chromosome IV, 645,000–652,000), telomere (TEL01L-TR, chromosome I, 0–400), small nucleolar RNA (snoRNA) (SNR128 and SNR190, chromosome X, 139,000–140,500), tRNA [tA(AGC)F, chromosome VI, 204,500–205,5000], and protein-coding ORF (TPI1, chromosome IV, 555,000–557,000).
Figure 3.
Figure 3.
High gene expression drives DNA:RNA hybrid formation. (A) The percentage of ORFs prone to hybrid formation in each expression category. Yeast ORFs were divided into 20 categories based on their expression (FPKM [fragments per kilobase per million mapped fragments]), and each bar indicates the percentage of all hybrid-prone ORFs found in each expression category. The dotted line at 5% indicates the value expected if the hybrid-containing ORFs were uniformly distributed. P-values were generated by a one-tailed Fisher's test. (B) The percentage of ORFs in each expression category that overlaps a hybrid. The dotted line is positioned at the expected value (7.4%). P-values were generated by a one-tailed Fisher's test. (C) Hybrid signal measured by DRIP-qPCR at ectopic highly expressed genes. Two different hybrid-forming regions—a Ty1 retrotransposon and HSP150 gene—cloned onto a yeast artificial chromosome (YAC) still form hybrids. “A” and “B” represent the amplicons in the flanking regions of the gene integration locus, while “C” is a control amplicon further downstream. (D) Hybrid signal measured by DRIP-qPCR upon gene overexpression. Induction of expression with galactose (Gal; hatched bars) promotes hybrid formation at the endogenous GAL7 gene and at the ectopic SMC3 locus when under the control of the Gal promoter. “B” represents a control amplicon showing background signal.
Figure 4.
Figure 4.
The distribution of hybrids at ORFs. (A) The distribution of hybrid signal at hybrid-prone genes in rnh1Δrnh201Δ. ORFs are aligned from transcription start site (TSS) to transcription end site (TES) and plotted ±1 kb. The metagene plot displays the median read counts over all hybrid-prone ORFs and reveals the accumulation of hybrids over the transcription unit, with a slightly higher signal near the 3′ end. The heat map displays the hybrid signal along individual ORFs, sorted according to total signal strength. (B) Hybrid-prone ORFs with asymmetric hybrid signals. Genes with asymmetric hybrid formation have a signal greater than twofold over gene average in the 5′-most or 3′-most 10% of the gene. Metagene plots and heat maps show the global median read count and the hybrid signal, respectively, at individual genes with 5′ and 3′ of ORF hybrids. The right panel shows the remaining hybrids that did not meet the criteria for the 5′ or 3′ of ORF category. (C) Asymmetric hybrid formation. Snapshots of representative ORFs with asymmetric hybrid signals 5′ of ORF (top panel) and 3′ of ORF (bottom panel) from rnh1Δ rnh201Δ. (D) The proportion of each asymmetric category and the remaining genes that is in either the highest two expression categories (high, FPKM of 1000–150) or all the remaining lower expressed categories (medium–low, FPKM of 150–0.1). P-values were generated by a χ2 test relative to the distribution for all hybrid-prone genes.
Figure 5.
Figure 5.
Positive AT skew and polyA tracts contribute to hybrid formation. (A) AT skew of ORF-associated hybrid regions. AT skew was calculated as (A − T)/(A + T) in each hybrid-prone region and was binned in the expression category of its associated ORF (expression categories were divided as 1, 2, 3–4, 5–8, 9–12, 13–16, and 17–20). Individual values are plotted along with the box plot showing the first quartile, median, and third quartile value for each expression category. (B) A common motif in hybrid-prone regions. The 779 identified hybrid-prone regions were analyzed by MEME for the presence of overrepresented motifs. MEME identified a 21-bp adenine-rich motif present in 526 of the 779 regions. (C) The occurrence of perfect polyA tracts and hybrids genome-wide. The length of the polyA tract is indicated on the X-axis. The number of polyAs of a given length present in the genome is represented by the black dotted line (left Y-axis), and the fraction overlapping a hybrid region is represented by the dark-gray bars (right Y-axis).
Figure 6.
Figure 6.
PolyA tracts directly affect hybrid formation. (A) PolyA-associated hybrid region. Snapshot of a representative polyA-associated hybrid 5′ of LEU9 showing the hybrid signal from rnh1Δ rnh201Δ (top) and rnh1Δrnh201Δ treated with RNase H in vitro (bottom). (B) Schematic of a locus containing a polyA tract (polyA) and a locus with a polyA tract seamlessly deleted (pAΔ). The locations of DRIP-qPCR amplicons are indicated with black bars. (C) Hybrid signal measured by DRIP-qPCR at polyA-containing genes. Hybrid signal was determined in rnh1Δrnh201Δ strains containing polyA tracts (solid bars) and deleted for the polyA (hatched bars) at the indicated genes. (D) Model of hybrid-promoting sequence features in yeast.

References

    1. Anders S, Huber W. 2010. Differential expression analysis for sequence count data. Genome Biol 11: R106. - PMC - PubMed
    1. Arudchandran A, Cerritelli S, Narimatsu S, Itaya M, Shin DY, Shimada Y, Crouch RJ. 2000. The absence of ribonuclease H1 or H2 alters the sensitivity of Saccharomyces cerevisiae to hydroxyurea, caffeine and ethyl methanesulphonate: implications for roles of RNases H in DNA replication and repair. Genes Cells 5: 789–802. - PubMed
    1. Balk B, Maicher A, Dees M, Klermund J, Luke-Glaser S, Bender K, Luke B. 2013. Telomeric RNA–DNA hybrids affect telomere-length dynamics and senescence. Nat Struct Mol Biol 20: 1199–1205. - PubMed
    1. Boguslawski SJ, Smith DE, Michalak MA, Mickelson KE, Yehle CO, Patterson WL, Carrico RJ. 1986. Characterization of monoclonal antibody to DNA.RNA and its application to immunodetection of hybrids. J Immunol Methods 89: 123–130. - PubMed
    1. Boque-Sastre R, Soler M, Oliveira-Mateos C, Portela A, Moutinho C, Sayols S, Villanueva A, Esteller M, Guil S. 2015. Head-to-head antisense transcription and R-loop formation promotes transcriptional activation. Proc Natl Acad Sci 112: 5785–5790. - PMC - PubMed