. 2016 Jun 28;113(26):E3764-72.
doi: 10.1073/pnas.1521749113. Epub 2016 Jun 13.

Activation of the molecular chaperone, sigma 1 receptor, preserves cone function in a murine model of inherited retinal degeneration

Affiliations

Activation of the molecular chaperone, sigma 1 receptor, preserves cone function in a murine model of inherited retinal degeneration

Jing Wang et al. Proc Natl Acad Sci U S A. .

Abstract

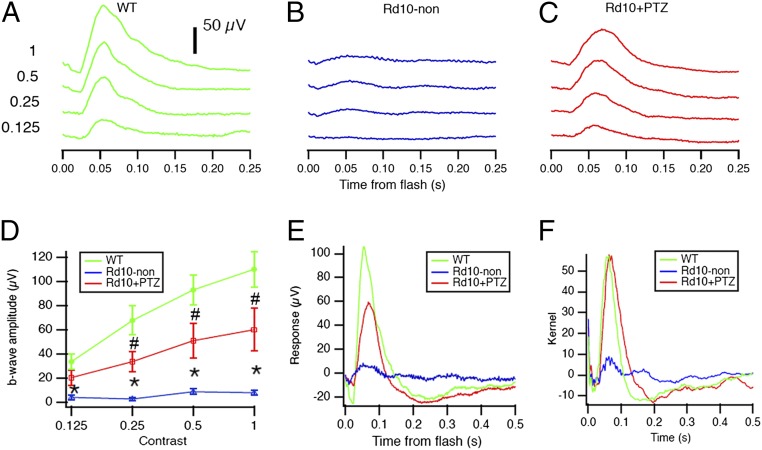
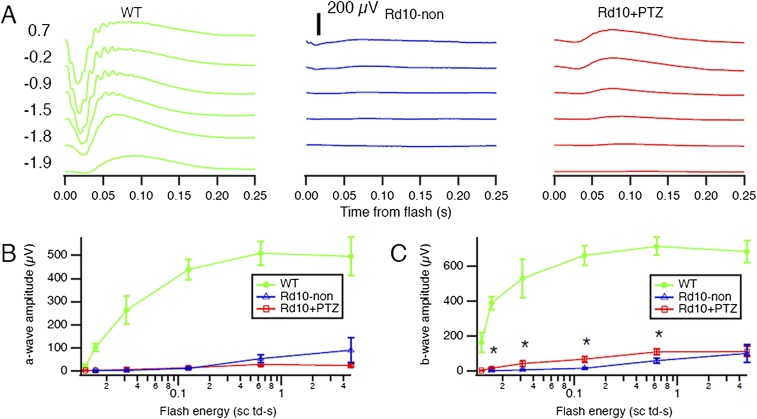
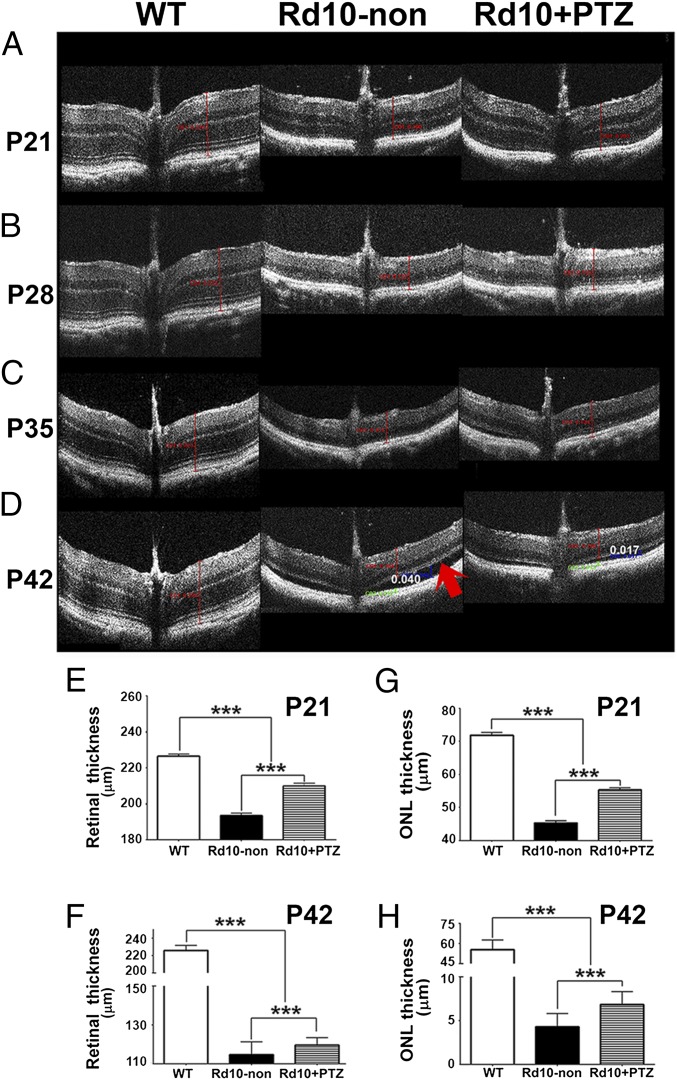
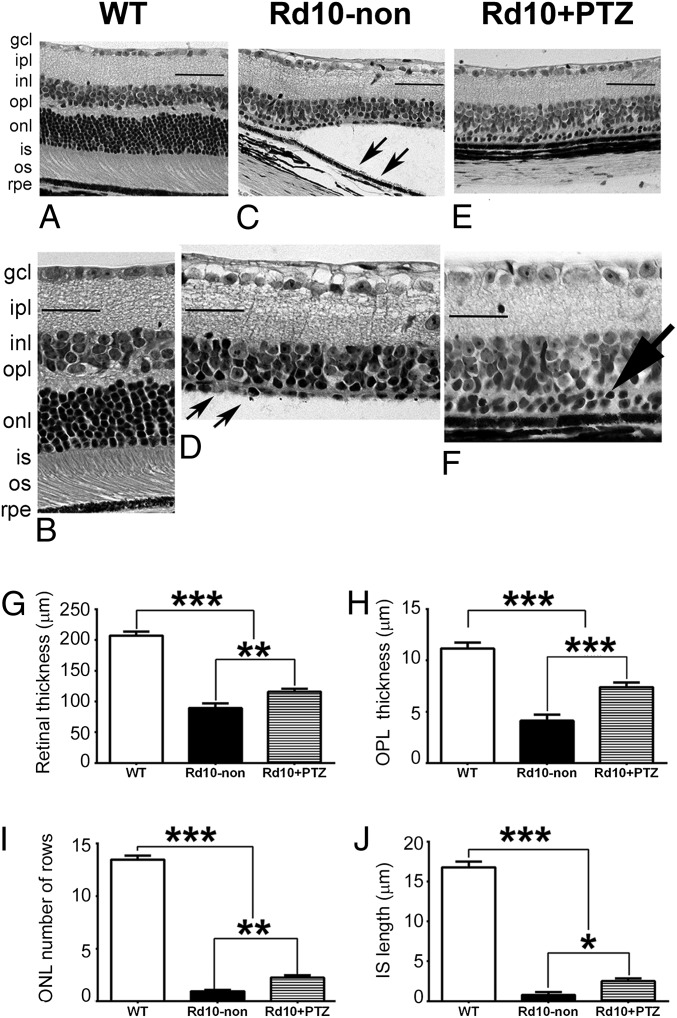
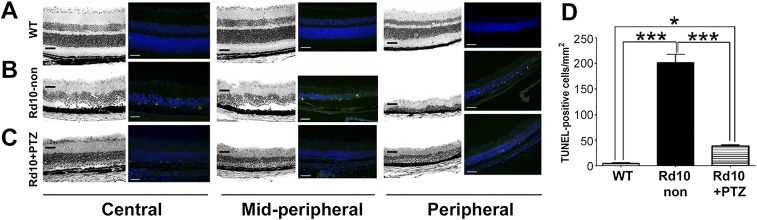
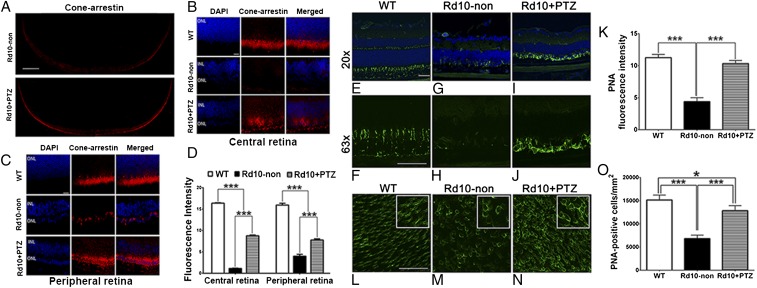
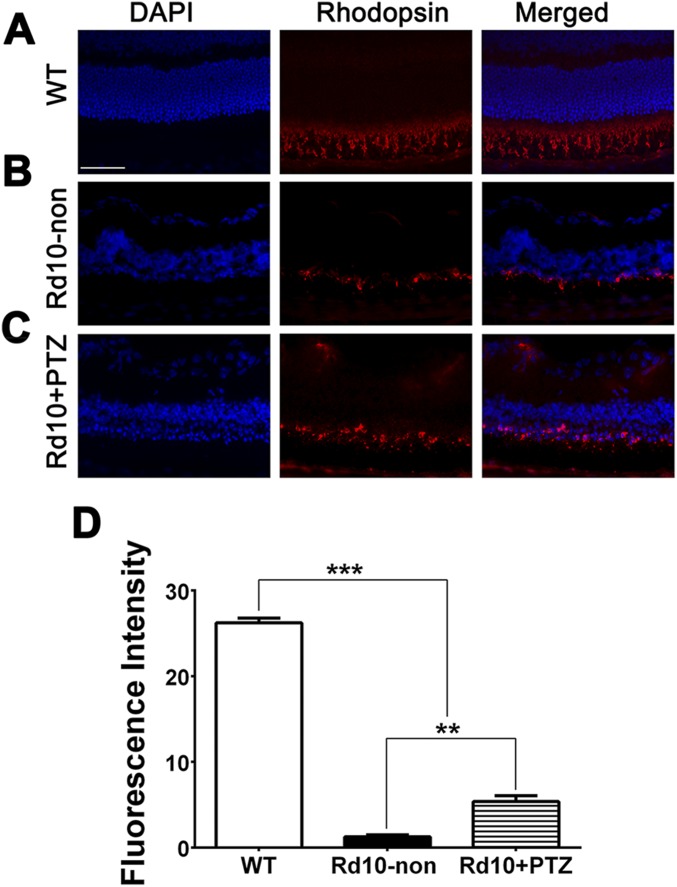
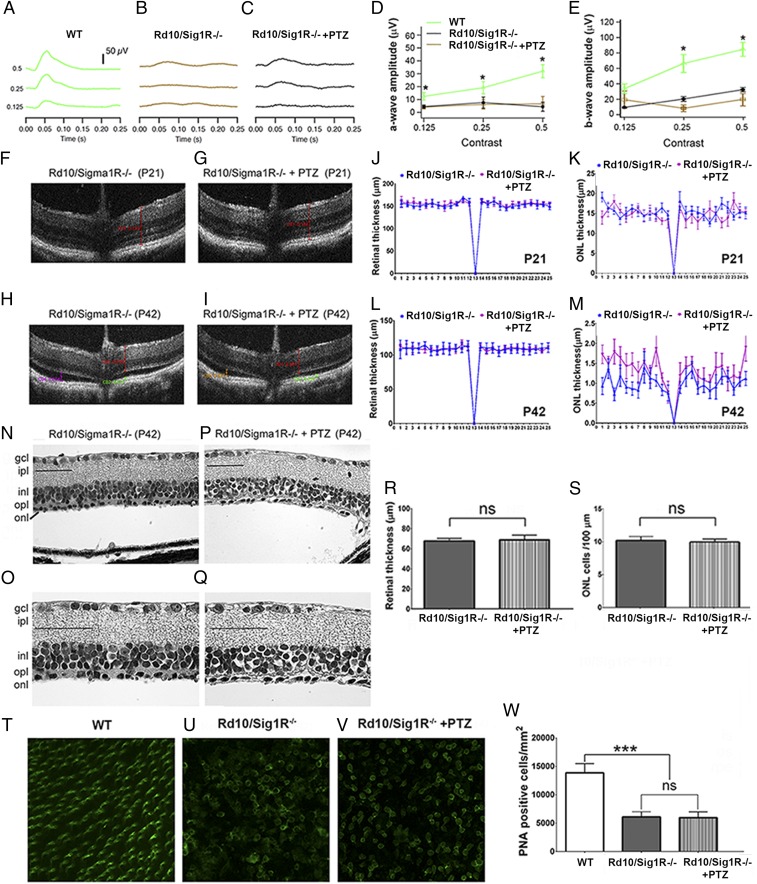
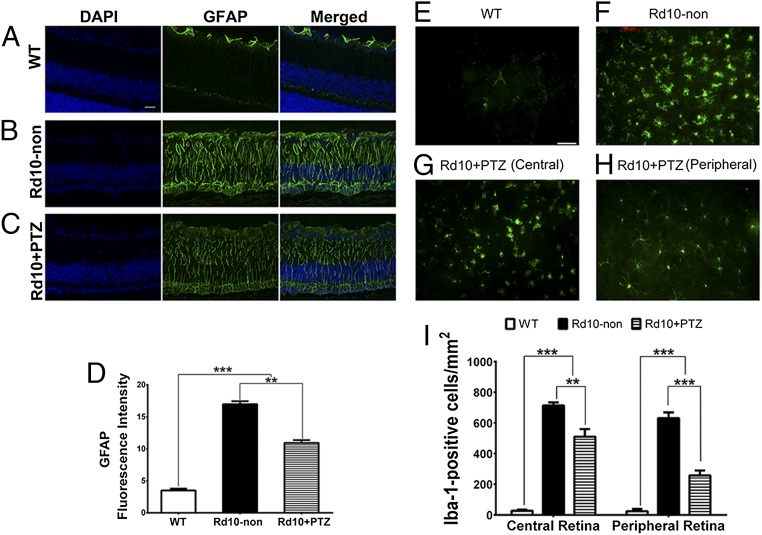
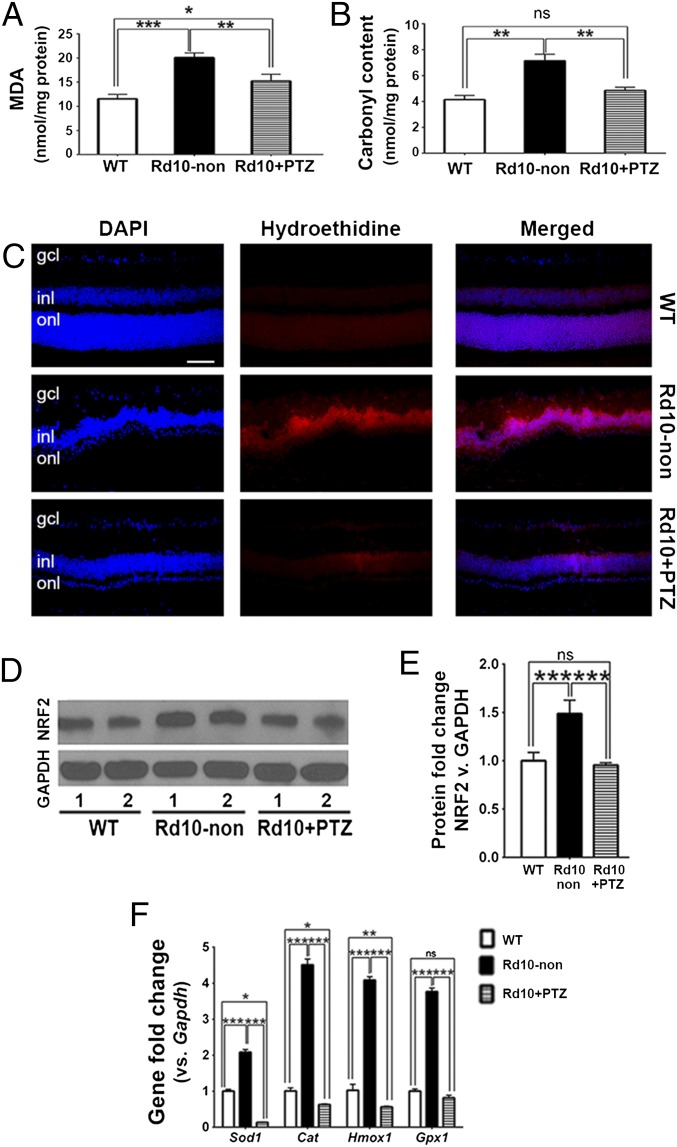
Retinal degenerative diseases are major causes of untreatable blindness, and novel approaches to treatment are being sought actively. Here we explored the activation of a unique protein, sigma 1 receptor (Sig1R), in the treatment of PRC loss because of its multifaceted role in cellular survival. We used Pde6β(rd10) (rd10) mice, which harbor a mutation in the rod-specific phosphodiesterase gene Pde6β and lose rod and cone photoreceptor cells (PRC) within the first 6 wk of life, as a model for severe retinal degeneration. Systemic administration of the high-affinity Sig1R ligand (+)-pentazocine [(+)-PTZ] to rd10 mice over several weeks led to the rescue of cone function as indicated by electroretinographic recordings using natural noise stimuli and preservation of cone cells upon spectral domain optical coherence tomography and retinal histological examination. The protective effect appears to result from the activation of Sig1R, because rd10/Sig1R(-/-) mice administered (+)-PTZ exhibited no cone preservation. (+)-PTZ treatment was associated with several beneficial cellular phenomena including attenuated reactive gliosis, reduced microglial activation, and decreased oxidative stress in mutant retinas. To our knowledge, this is the first report that activation of Sig1R attenuates inherited PRC loss. The findings may have far-reaching therapeutic implications for retinal neurodegenerative diseases.

Keywords: (+)-pentazocine; oxidative stress; photoreceptor; rd10 mouse; retinal neuroprotection.


Conflict of interest statement

The authors declare no conflict of interest.

Figures

Fig. 1.
Fig. 1.
Photopic ERG responses are improved significantly in rd10+PTZ mice. (AC) Averaged photopic responses to 5-ms flashes at a series of intensities (log photopic troland-seconds) are provided for WT (A), rd10-non (B), and rd10+PTZ (C) mice at P35. (D) Mean b-wave amplitudes of averaged photopic responses to 5-ms flashes above a fixed pedestal luminance of 0.105 lumens [four contrasts of the flash; contrast = (flash − pedestal)/pedestal luminance]. Data are the mean ± SEM of four assays using eyes from six to nine mice; *, significantly different from the WT and rd10+PTZ groups; #, significantly different from WT and rd10-non mice, P < 0.005. (E) Averaged responses to photopic flash of contrast = 1 (replotted after superimposition). (F) Averaged kernels derived from responses to natural noise stimuli. Green, WT mice; blue, rd10-non mice; red, rd10+PTZ mice. Numbers of mice tested are provided in Table S1.
Fig. S1.
Fig. S1.
Scotopic ERG in Pde6βrd10 (rd10) mice administered (+)-PTZ. (A) Averaged scotopic ERG responses to 5-ms flashes at a series of intensities in WT, rd10-non, and rd10+PTZ mice; intensities are units of log scotopic troland-seconds. (B) Mean a-wave amplitudes. (C) Mean b-wave amplitudes. Data are the mean ± SEM of assessments of six to nine mice (Table S1); *, significant difference between rd10+PTZ and rd10-non mice (P < 0.05).
Fig. 2.
Fig. 2.
Improved retinal structure observed in vivo in rd10+PTZ mice. (AD) Representative SD-OCT data obtained from WT mice, rd10-non mice, and rd10+PTZ mice at P21 (A), P28 (B), P35 (C), and P42 (D). The arrow in D indicates marked retinal detachment. (EH) Data from segmentation analysis for total retinal thickness at P21 (E) and P42 (F) and for ONL thickness at P21 (G) and P42 (H). ***P < 0.001. Data are the mean ± SEM of analyses in 4–10 mice per group at each age (Table S1).
Fig. 3.
Fig. 3.
PRCs are preserved in retinas of rd10-PTZ mice. (AF) Retinal sections of eyes embedded in JB-4 and stained with H&E from WT (A and B), rd10-non (C and D), and rd10+PTZ (E and F) mice. Note retinal detachment (arrows in C) and paucity of PRC in the ONL in rd10-non mice (arrows in D). In F two rows of PRC nuclei remain in the ONL of rd10+PTZ mice (large arrow). (GJ) Morphometric analyses of total retinal thickness (G), OPL thickness (H), ONL thickness, number of ONL rows (I), and inner segment thickness (J). gcl, ganglion cell layer; ipl, inner plexiform layer; inl, inner nuclear layer; opl, outer plexiform layer; onl, outer nuclear layer; is, inner segment; os, outer segment; rpe, retinal pigment epithelium. Data are the mean ± SEM of measurements from six to nine mice per group (Table S1); *P < 0.05; **P < 0.01; ***P < 0.001. (Scale bar: 50 μm.) Numbers of mice used in the analysis are provided in Table S1.
Fig. S2.
Fig. S2.
Detection of cell death by TUNEL analysis in Pde6βrd10 (rd10) mice administered (+)-PTZ. (AC) Representative photomicrographs of TUNEL analysis performed using cryosections from WT (A), rd10-non (B), and rd10+PTZ (C) mice at P42. H&E-stained sections are adjacent to TUNEL-stained sections for central, midperipheral, and peripheral retinal regions. (Scale bars: 50 μm.) (D) Quantification of TUNEL+ cells. Data are the mean ± SEM of three or four assays performed in sections from six to eight mice (Table S1); *P < 0.05, ***P < 0.001.
Fig. 4.
Fig. 4.
Many PRCs preserved in rd10-PTZ retinas are cones. (A) Retinal cross-sections of cone-arrestin labeling in rd10-non and rd10+PTZ mice. (B and C) Retinal cryosections subjected to cone-arrestin labeling of the central (B) and peripheral (C) retina of WT, rd10-non, and rd10+PTZ mice at P42. (D) Quantification of cone-arrestin fluorescence. (EJ) Cryosections subjected to PNA immunolabeling from retinas of WT (E and F), rd10–non (G and H), and rd10+PTZ (I and J) mice at P42. (K) Quantification of PNA fluorescence. (LN) Representative PNA-immunolabeled retinal flatmounts from WT (L), rd10-non (M), and rd10+PTZ (N) mice. (O) Quantification of PNA+ cells. Data are the mean ± SEM of three or four assays from six to eight mice (cryosections) and from 7–10 mice (flatmounts) (Table S1). *P < 0.05, ***P < 0.001. (Scale bars: 500 μm in A; 20 µm in B and C; 50 µm in EN.) Nuclei are labeled with DAPI (blue). Numbers of mice used in the analysis are provided in Table S1. Details about antibodies are provided in Table S2.
Fig. S3.
Fig. S3.
Immunofluorescent detection of rhodopsin in Pde6βrd10 (rd10) mice administered (+)-PTZ. (AC) Representative photomicrographs of retinal cryosections subjected to immunofluorescent detection of rhodopsin and counterstained with DAPI to label cell nuclei from WT (A), rd10-non (B), and rd10+PTZ (C) mice at P42. (Scale bar: 50 μm.) (D) Quantification of fluorescence intensity. Data are the mean ± SEM of three or four assays performed in sections from six to eight mice (Table S1); **P < 0.01; ***P < 0.001.
Fig. 5.
Fig. 5.
PRCs are not preserved in rd10/Sig1R−/− mice administered (+)-PTZ. (AC) ERGs of averaged photopic responses for WT (A), rd10/Sig1R−/−-non (B), and rd10/Sig1R−/−+PTZ (C) mice. (D and E) Mean photopic a-wave (D) and b-wave (E) amplitudes. *, WT data are significantly different from data from rd10/Sig1R−/−-non and rd10/Sig1R−/−+PTZ mice (P < 0.005). (FI) SD-OCT images of rd10/Sig1R−/−−non (F and H) and rd10/Sig1R−/−-PTZ (G and I) mice at P21 (F and G) and P42 (H and I). (JM) Thickness of whole retina (J and L) and the ONL (K and M) determined using DIVERS software at P21 (J and K) and P42 (L and M). Differences were not significant. (NQ) Retinal sections from rd10/Sig1R−/−-non (N and O) and rd10/Sig1R−/−+PTZ (P and Q) mice. Sections are embedded in JB-4 and stained with H&E. (Scale bars: 50 µm.) For abbreviations see the legend of Fig. 3. (R and S) Morphometric analysis of retinal thickness (R) and the number of ONL cells per100-µm retina length (S). (TV) PNA immunodetection in retinal flatmounts from WT (T), rd10/Sig1R−/−-non (U), and rd10/Sig1R−/−+PTZ (V) mice. (W) Quantification of PNA+ cells. ***P < 0.001; ns, not significant. Numbers of mice used in the analysis are provided Table S1.
Fig. 6.
Fig. 6.
Müller cell gliosis and microglial activation are attenuated in rd10-PTZ mice. (AC) Immunodetection of GFAP (green) in retinal cryosections from WT (A), rd10-non (B), and rd10+PTZ mice (C) at P42. Nuclei are labeled with DAPI (blue). (D) Quantitation of fluorescence intensity. (E and F) Retinal flatmounts from WT (E) and rd10-non (F) mice. (G and H) Retinal flatmounts immunolabeled with Iba-1 of central (G) and peripheral (H) retina from rd10+PTZ mice. (I) Quantitation of fluorescence intensity. Data are the mean ± SEM (three or four assays) from six to eight mice (Table S1). **P < 0.01; ***P < 0.001. (Scale bar: 50 μm.) Details about antibodies are provided in Table S2.
Fig. 7.
Fig. 7.
Oxidative stress is attenuated in rd10+PTZ mice. (A) Retinal lipid oxidation was quantified as the TBA level by measuring MDA. (B) Retinal protein oxidation measured as the carbonyl content of proteins using DNPH in WT, rd10-non, and rd10+PTZ mice. (C) Immunodetection of hydroethidine (red fluorescence upon reaction with superoxide species) in retinal cryosections of WT, rd10-non, and rd10+PTZ mice at P42. Nuclei are labeled with DAPI (blue). (Scale bar: 50 µm.) (D) Neural retinas harvested from WT, rd10-non, and rd10+PTZ mice at P42 were used for isolation of protein. Representative immunoblots detecting NRF2 are shown. GAPDH was the internal control. Lanes 1 and 2 are two independent samples from different mice. (E) Band densities, quantified densitometrically and expressed as fold change vs. GAPDH. (F) RNA was isolated from neural retinas and subjected to quantitative real-time RT-PCR analysis of Sod1, Cat, Hmox1, and Gpx1. Primer pairs are listed in Table S3. Data are the mean ± SEM of three or four assays. *P < 0.05; **P < 0.01; ***P < 0.001.

Similar articles

Cited by

References

    1. Dowling JE. Restoring vision to the blind: Introduction. Transl Vis Sci Technol. 2014;3(7):2. - PMC - PubMed
    1. Ran X, et al. ‘RetinoGenetics’: A comprehensive mutation database for genes related to inherited retinal degeneration. Database (Oxford) 2014;2014:2014. - PMC - PubMed
    1. Cuenca N, et al. Cellular responses following retinal injuries and therapeutic approaches for neurodegenerative diseases. Prog Retin Eye Res. 2014;43:17–75. - PubMed
    1. Komeima K, Rogers BS, Lu L, Campochiaro PA. Antioxidants reduce cone cell death in a model of retinitis pigmentosa. Proc Natl Acad Sci USA. 2006;103(30):11300–11305. - PMC - PubMed
    1. Zhang SX, Ma JH, Bhatta M, Fliesler SJ, Wang JJ. The unfolded protein response in retinal vascular diseases: Implications and therapeutic potential beyond protein folding. Prog Retin Eye Res. 2015;45:111–131. - PMC - PubMed

Publication types

MeSH terms

Substances