Review
. 2016 Jul 5;371(1698):20150232.
doi: 10.1098/rstb.2015.0232.

An ecometric analysis of the fossil mammal record of the Turkana Basin

Affiliations
Review

An ecometric analysis of the fossil mammal record of the Turkana Basin

Mikael Fortelius et al. Philos Trans R Soc Lond B Biol Sci. .

Abstract

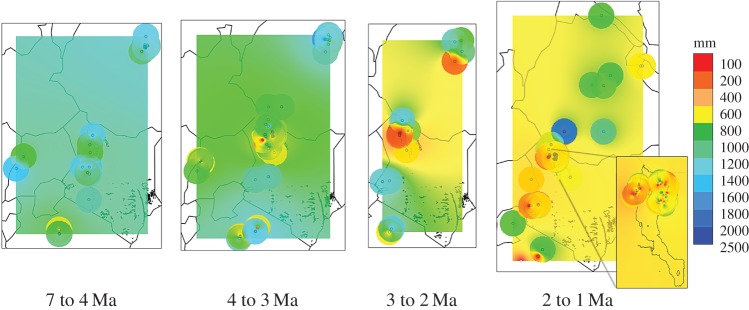
Although ecometric methods have been used to analyse fossil mammal faunas and environments of Eurasia and North America, such methods have not yet been applied to the rich fossil mammal record of eastern Africa. Here we report results from analysis of a combined dataset spanning east and west Turkana from Kenya between 7 and 1 million years ago (Ma). We provide temporally and spatially resolved estimates of temperature and precipitation and discuss their relationship to patterns of faunal change, and propose a new hypothesis to explain the lack of a temperature trend. We suggest that the regionally arid Turkana Basin may between 4 and 2 Ma have acted as a 'species factory', generating ecological adaptations in advance of the global trend. We show a persistent difference between the eastern and western sides of the Turkana Basin and suggest that the wetlands of the shallow eastern side could have provided additional humidity to the terrestrial ecosystems. Pending further research, a transient episode of faunal change centred at the time of the KBS Member (1.87-1.53 Ma), may be equally plausibly attributed to climate change or to a top-down ecological cascade initiated by the entry of technologically sophisticated humans.This article is part of the themed issue 'Major transitions in human evolution'.

Keywords: ecosystem change; fossil mammal; human origins; palaeoclimate; predictive modelling.


Figures

Figure 1.
Figure 1.
Visualization of the models for temperature and precipitation. Interpretation for all figures is as follows: given a ComLoc in question one measures mean HYP, mean LOP and then finds a point on the plot corresponding to the obtained measures. The colour-coding at this point gives an estimate for temperature or precipitation.
Figure 2.
Figure 2.
Regional distribution of ecometric estimates of mean annual precipitation (mm/yr) in eastern Africa during four intervals. Inset map shows distribution within the Turkana Basin for the last interval. GIS settings: inverse distance weighting with distance coefficient 2.0, radius 1: 1.0, radius 2: 1.0, resize width: 3000, resize height: 3000.
Figure 3.
Figure 3.
(ad) Estimates of mean annual temperature (°C) over time in the Turkana Basin using two different levels of aggregation (right–left) and two different models based on the dental ecometrics HYP and LOP (up–down). 95% CI for the fit are shown in orange; please note that a narrow interval does not imply confidence in the estimated value itself, only in the consistent performance of the model.
Figure 4.
Figure 4.
Estimates of mean annual precipitation (mm/yr) over time in the Turkana basin using two different levels of aggregation (right–left) and two different models based on the dental ecometrics HYP and LOP (up–down). 95% CIs for the fit are shown in orange.
Figure 5.
Figure 5.
Distribution of ecometric mean annual precipitation (regression model) from ComLocs in the Turkana Basin during four time intervals. The apparent precipitation minimum in the 3–2 Ma interval is partly owing to extremely low estimates from the Kalochoro Member of West Turkana. GIS settings: inverse distance weighting with distance coefficient 2.0, radius 1: 0.2, radius 2: 0.2, resize width: 1000, resize height: 1000.
Figure 6.
Figure 6.
Comparison of mean annual precipitation (mm/yr) between localities from the east and west sides of present-day lake Turkana over time, with the same models and fit as in figures 3 and 4.
Figure 7.
Figure 7.
Relationship of species detected to specimens collected in the analysed dataset, showing exceptionally high species/specimen ratio of the KBS Member. The fit is by cubic smoothing spline with 4 degrees of freedom.
Figure 8.
Figure 8.
Taxonomic distribution of individual specimens collected from the east-side Members before, during and after the ‘KBS event’. (a) Mean annual temperature, (b) mean annual precipitation, (c) relative proportions of species across taxa, and (d) relative proportions of specimens across taxa. Note transient minimum of carnivore and primate specimens during KBS time and corresponding maximum of bovid and perissodactyl specimens.
Figure 9.
Figure 9.
Comparison of turnover patterns in carnivorans and non-carnivorans in the Turkana basin. (a) Per capita origination showing earlier origination peak in carnivorans (2.2–1.9 Ma) than in non-carnivorans (1.9–1.6 Ma). Carnivoran origination peak at 3.4–3.1 is an artefact. (b): per capita extinctions showing carnivoran extinction peak at 2.8–2.5 Ma unmatched in non-carnivorans. Taking sampling into consideration suggests that this peak should be at 2.5–2.2 Ma (see Discussion for details). Solid line: carnivorans; dashed line: non-carnivorans.
Figure 10.
Figure 10.
(ad) Visualization of the modern-day data used for modelling.

References

    1. Coppens Y, Howell FC. 1976. Mammalian faunas of the Omo Group: distributional and biostratigraphic aspects. In Earliest man and environments in the Lake Rudolf Basin (eds Coppens Y, Howell FC, Isaac GL, Leakey REF), pp. 177–192. Chicago, IL: University of Chicago Press.
    1. Leakey MG, Leakey RE (eds). 1978. Koobi Fora research project, vol. 1. The fossil hominids and an introduction to their context, 1968–1974. Oxford, UK: Clarendon Press.
    1. Harris JM (ed.). 1983. Koobi fora research project, vol. 2. The fossil ungulates: Proboscidea, Perissodactyla, and Suidae. Oxford, UK: Clarendon Press.
    1. Harris JM. (ed.). 1991. Koobi fora research project, vol. 3. The fossil ungulates: geology, fossil artiodactyls, and paleoenvironments Oxford, UK: Clarendon Press.
    1. Eck GG, Jablonski NG, Leakey M. 1987. Les faunes Plio-Pléistocènes de la basse vallée de l'Omo (Éthiopie). Tome 3: Cercopithecidae de la formation de Shungura. Paris, France: CNRS.

Publication types

LinkOut - more resources