

Phospholipases D1 and D2 Suppress Appetite and Protect against Overweight
- PMID: 27299737
- PMCID: PMC4907468
- DOI: 10.1371/journal.pone.0157607
Phospholipases D1 and D2 Suppress Appetite and Protect against Overweight
Abstract
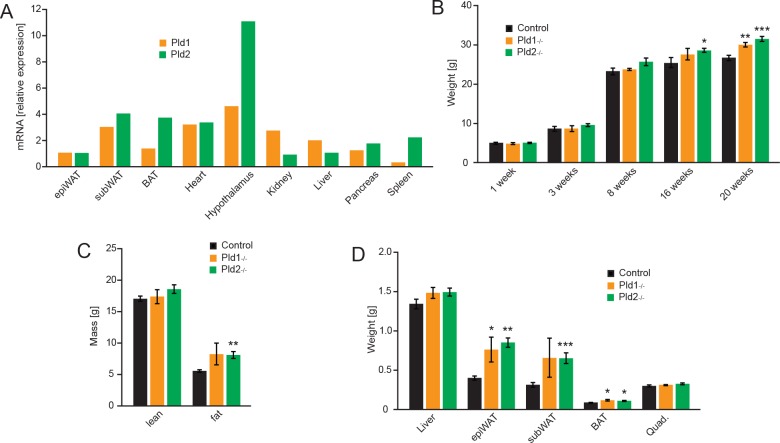
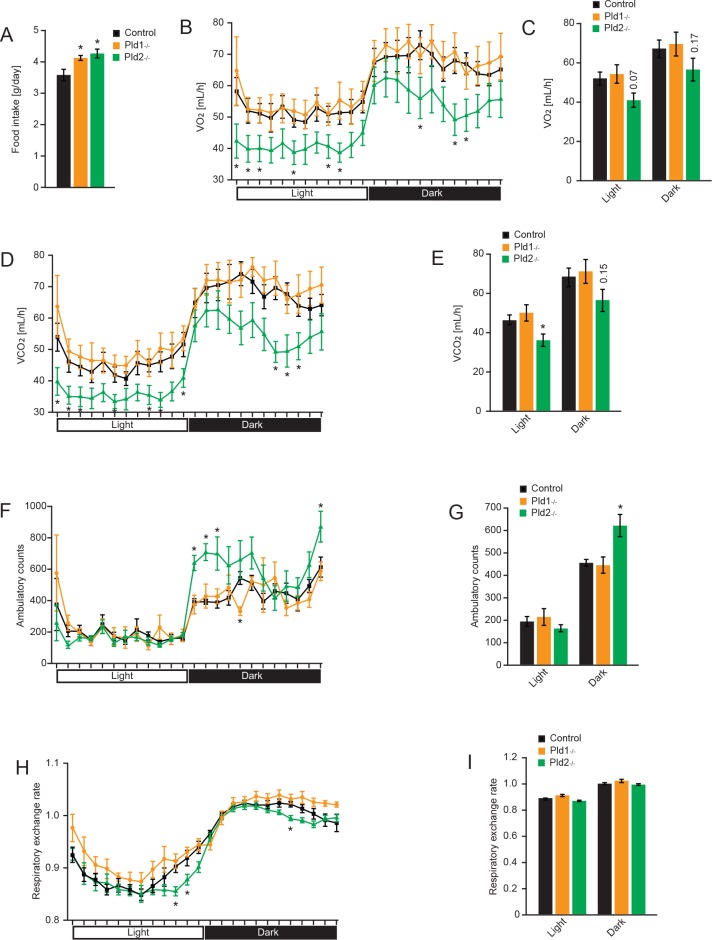
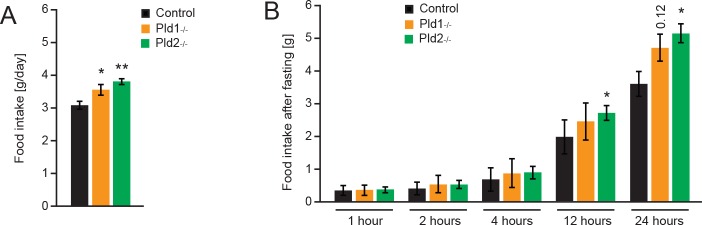
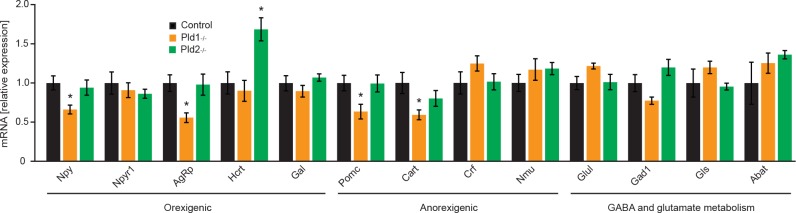
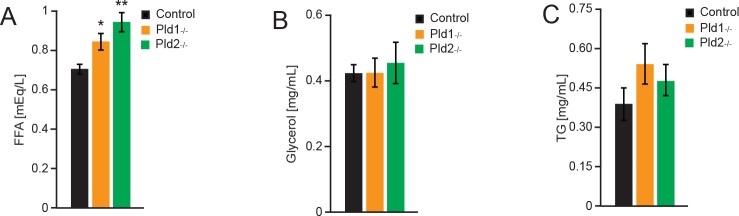
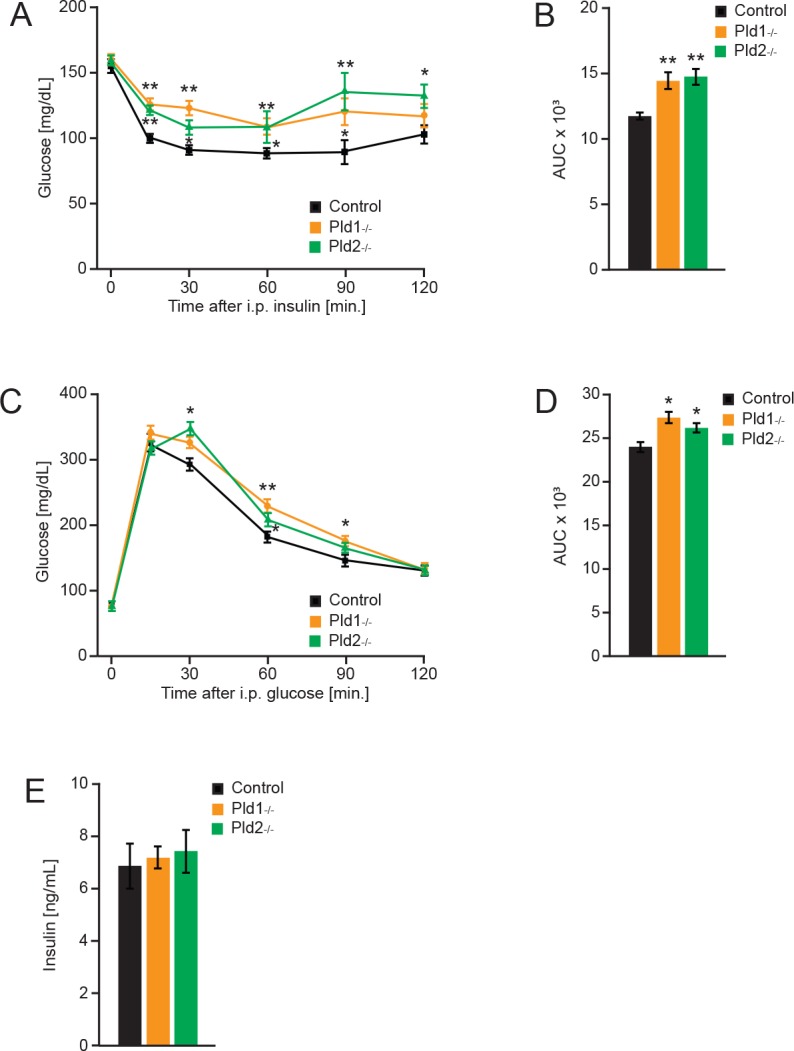
Obesity is a major risk factor predisposing to the development of peripheral insulin resistance and type 2 diabetes (T2D). Elevated food intake and/or decreased energy expenditure promotes body weight gain and acquisition of adipose tissue. Number of studies implicated phospholipase D (PLD) enzymes and their product, phosphatidic acid (PA), in regulation of signaling cascades controlling energy intake, energy dissipation and metabolic homeostasis. However, the impact of PLD enzymes on regulation of metabolism has not been directly determined so far. In this study we utilized mice deficient for two major PLD isoforms, PLD1 and PLD2, to assess the impact of these enzymes on regulation of metabolic homeostasis. We showed that mice lacking PLD1 or PLD2 consume more food than corresponding control animals. Moreover, mice deficient for PLD2, but not PLD1, present reduced energy expenditure. In addition, deletion of either of the PLD enzymes resulted in development of elevated body weight and increased adipose tissue content in aged animals. Consistent with the fact that elevated content of adipose tissue predisposes to the development of hyperlipidemia and insulin resistance, characteristic for the pre-diabetic state, we observed that Pld1-/- and Pld2-/- mice present elevated free fatty acids (FFA) levels and are insulin as well as glucose intolerant. In conclusion, our data suggest that deficiency of PLD1 or PLD2 activity promotes development of overweight and diabetes.
Conflict of interest statement
Figures
Similar articles
-
Role of phospholipases D1 and 2 in astroglial proliferation: effects of specific inhibitors and genetic deletion.Eur J Pharmacol. 2015 Aug 15;761:398-404. doi: 10.1016/j.ejphar.2015.05.004. Epub 2015 May 9. Eur J Pharmacol. 2015. PMID: 25967349
-
Effects of phospholipase D during cultured osteoblast mineralization and bone formation.J Cell Biochem. 2019 Apr;120(4):5923-5935. doi: 10.1002/jcb.27881. Epub 2018 Oct 15. J Cell Biochem. 2019. PMID: 30320913
-
Targeting PLD2 in adipocytes augments adaptive thermogenesis by improving mitochondrial quality and quantity in mice.J Exp Med. 2022 Feb 7;219(2):e20211523. doi: 10.1084/jem.20211523. Epub 2021 Dec 23. J Exp Med. 2022. PMID: 34940790 Free PMC article.
-
Phospholipase D as a Potential Modulator of Metabolic Syndrome: Impact of Functional Foods.Antioxid Redox Signal. 2021 Jan 20;34(3):252-278. doi: 10.1089/ars.2020.8081. Epub 2020 Jul 21. Antioxid Redox Signal. 2021. PMID: 32586106 Review.
-
Development of a Selective, Allosteric PLD1/2 Inhibitor in a Novel Scaffold.2012 Apr 5 [updated 2013 Mar 14]. In: Probe Reports from the NIH Molecular Libraries Program [Internet]. Bethesda (MD): National Center for Biotechnology Information (US); 2010–. 2012 Apr 5 [updated 2013 Mar 14]. In: Probe Reports from the NIH Molecular Libraries Program [Internet]. Bethesda (MD): National Center for Biotechnology Information (US); 2010–. PMID: 23762925 Free Books & Documents. Review.
Cited by
-
A network pharmacology study on main chemical compounds from Hibiscus cannabinus L. leaves.RSC Adv. 2021 Mar 17;11(19):11062-11082. doi: 10.1039/d0ra10932k. eCollection 2021 Mar 16. RSC Adv. 2021. PMID: 35423640 Free PMC article.
-
Gut Microbiota: An Important Participant in Childhood Obesity.Adv Nutr. 2025 Feb;16(2):100362. doi: 10.1016/j.advnut.2024.100362. Epub 2024 Dec 28. Adv Nutr. 2025. PMID: 39733798 Free PMC article. Review.
-
Mammalian phospholipase D: Function, and therapeutics.Prog Lipid Res. 2020 Apr;78:101018. doi: 10.1016/j.plipres.2019.101018. Epub 2019 Dec 9. Prog Lipid Res. 2020. PMID: 31830503 Free PMC article. Review.
-
Protein Kinase D2 drives chylomicron-mediated lipid transport in the intestine and promotes obesity.EMBO Mol Med. 2021 May 7;13(5):e13548. doi: 10.15252/emmm.202013548. Epub 2021 May 5. EMBO Mol Med. 2021. PMID: 33949105 Free PMC article.
-
The adrenergic-induced ERK3 pathway drives lipolysis and suppresses energy dissipation.Genes Dev. 2020 Apr 1;34(7-8):495-510. doi: 10.1101/gad.333617.119. Epub 2020 Mar 5. Genes Dev. 2020. PMID: 32139423 Free PMC article.
References
-
- Sabatini DM. mTOR and cancer: insights into a complex relationship. Nature Reviews Cancer. 2006;6(9):729–34. - PubMed
MeSH terms
Substances
LinkOut - more resources
Full Text Sources
Other Literature Sources
Molecular Biology Databases
