. 2016 Aug;36(4):324-32.
doi: 10.1097/JCP.0000000000000529.

A Pharmacokinetic Study Examining Acetazolamide as a Novel Adherence Marker for Clinical Trials

Affiliations

A Pharmacokinetic Study Examining Acetazolamide as a Novel Adherence Marker for Clinical Trials

Aidan J Hampson et al. J Clin Psychopharmacol. 2016 Aug.

Abstract

Rationale: Accurate assessment of medication adherence is critical for determination of medication efficacy in clinical trials, but most current methods have significant limitations. This study tests a subtherapeutic (microdose) of acetazolamide as a medication ingestion marker because acetazolamide is rapidly absorbed and excreted without metabolism in urine and can be noninvasively sampled.

Methods: In a double-blind, placebo-controlled, residential study, 10 volunteers received 15 mg oral acetazolamide for 4 consecutive days. Acetazolamide pharmacokinetics were assessed on day 3, and its pharmacokinetic and pharmacodynamic interactions with a model medication (30 mg oxycodone) were examined on day 4. The rate of acetazolamide elimination into urine was followed for several days after dosing cessation.

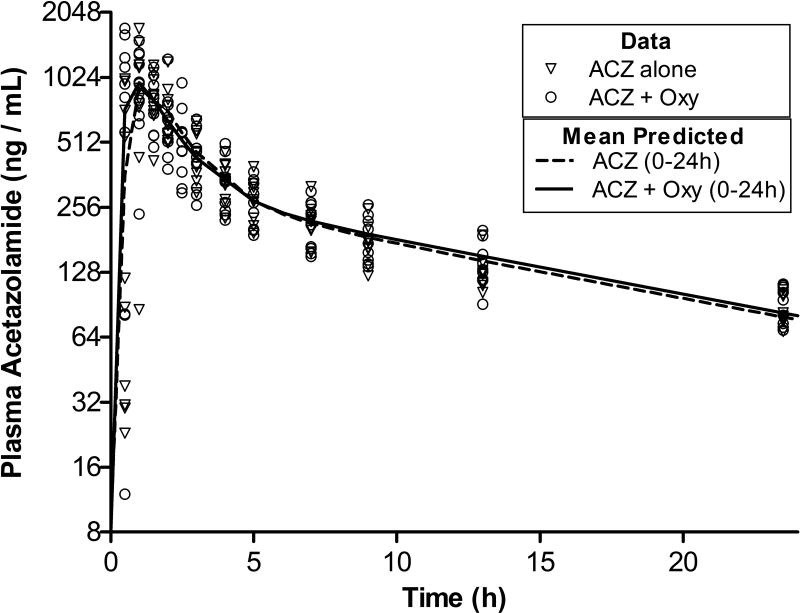
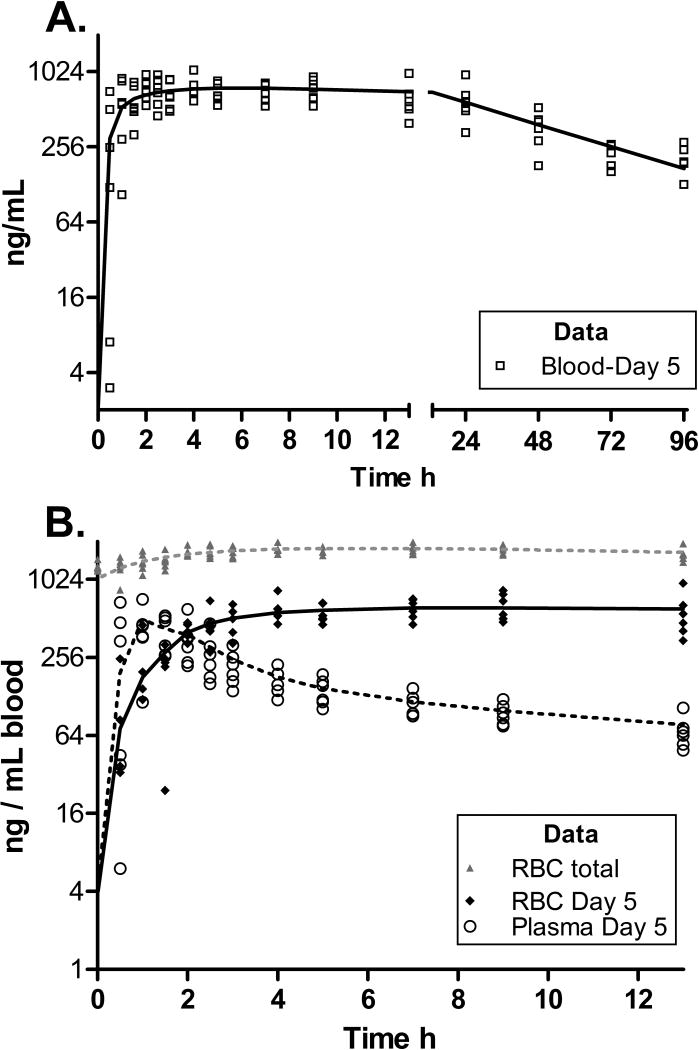
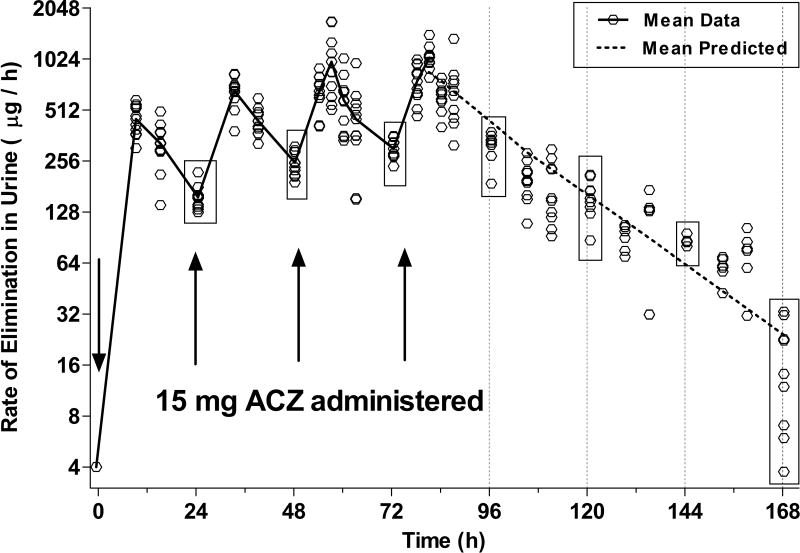
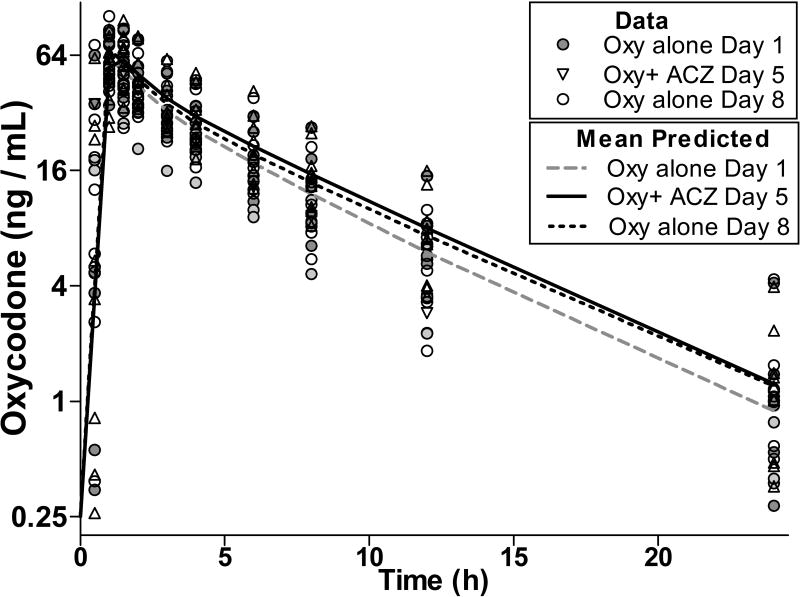
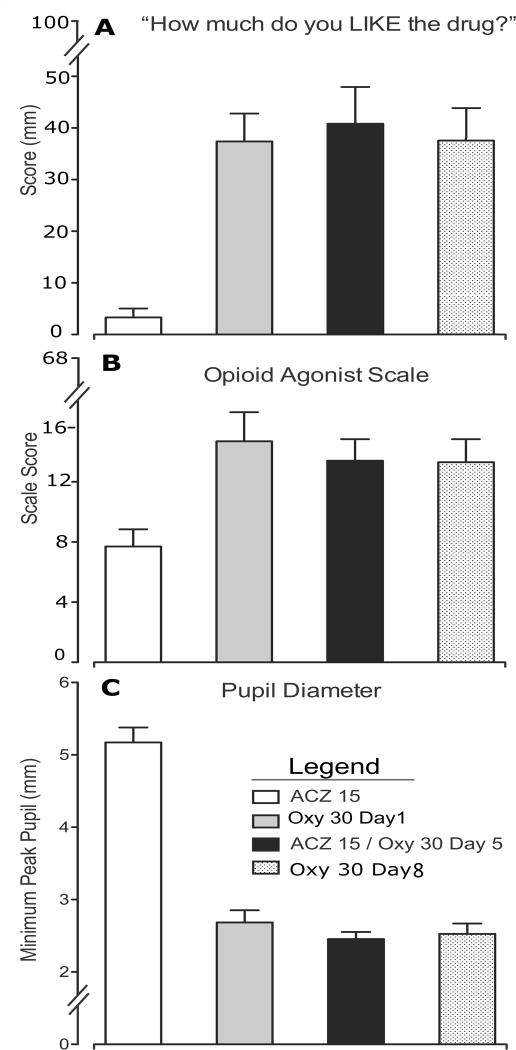
Results: Erythrocyte sequestration (half-life = 50.2 ± 18.5 h, mean ± SD, n = 6), resulted in the acetazolamide microdose exhibiting a substantially longer plasma half-life (24.5 ± 5.6 hours, n = 10) than previously reported for therapeutic doses (3-6 hours). After cessation of dosing, the rate of urinary elimination decreased significantly (F3,23 = 247: P < 0.05, n = 6) in a predictable manner with low intersubject variability and a half-life of 16.1 ± 3.8 h (n = 10). For each of 4 consecutive mornings after dosing cessation, the rates of urinary acetazolamide elimination remained quantifiable.There was no overall effect of acetazolamide on the pharmacodynamics, Cmax, Tmax, or elimination half-life of the model medication tested. Acetazolamide may have modestly increased overall oxycodone exposure (20%, P < 0.05) compared with one of the 2 days when oxycodone was given alone, but there were no observed effects of acetazolamide on oxycodone pharmacodynamic responses.

Conclusions: Coformulation of a once-daily trial medication with an acetazolamide microdose may allow estimation of the last time of medication consumption for up to 96 hours postdose. Inclusion of acetazolamide may therefore provide an inexpensive new method to improve estimates of medication adherence in clinical trials.


Conflict of interest statement

Conflict of Interest.

For the remaining authors, no conflicts were declared.

Figures

Figure 1
Figure 1. Pharmacokinetics of Acetazolamide in Plasma
Concentration of acetazolamide (ACZ) in plasma following administration of 15 mg of ACZ alone (Day 4, triangles, n=10) and in ACZ in the presence of 30 mg of oxycodone (Day 5, circles, n=10). The residuum from the previous day’s dose was subtracted from each data point (see methods). The lines represents mean predicted data points generated by pharmacokinetic model fit of individual data sets. The dashed line represents ACZ when administered alone and samples taken between t=0–24 h are included. The solid line represents ACZ concentration data from when ACZ was administered together with oxycodone (Oxy).
Figure 2
Figure 2. The Pharmacokinetic Profiles (PK) of Acetazolamide in 1 mL of blood, and the plasma and Red Blood Cells (RBCs) components of 1 mL of blood (n=6)
The lines represents mean predicted data points generated by pharmacokinetic model fit of individual data sets. Residual ACZ from the previous day’s dose was subtracted from all data points, except the grey “RBC Total” data. A) Changes in ACZ concentration in whole blood over a 96 h period following administration of the final ACZ (+ oxycodone) dose. The left X axis represents t=0–13 h (for comparison with 2B) while the right X axis, represents t=13–96 h. The line represents mean predicted data based on a fit of a one compartmental pharmacokinetic model optimized for each individual data set. B) Changes in ACZ concentration in the plasma and red blood cells (RBCs) fractions of 1 mL of blood over a 13 h period following ACZ + oxycodone administration. The open markers represent individual plasma content in 1 mL of blood (corrected using subjects hematocrit values). The dotted line represents mean predicted data based on a two compartmental PK model fit of plasma data. The diamond markers represent individual RBC values (calculated as blood-plasma) and the solid line represents mean predicted data based on a one compartmental PK model fit of RBC data. The grey markers and line represent individual RBC values without the residual subtraction and are intended to demonstrate the degree of accumulation in RBCs after 4 daily doses and how residual subtraction facilitates visualization of the kinetics.
Figure 3
Figure 3. Urinary Excretion Rate of Acetazolamide
Each marker indicates the excretion rate of a single individual, calculated from a sample pooled since the previous collection period (n=10, except for 120–159h when n=6). The solid line connects actual mean values at each time point during the period in which ACZ was administered. The dotted line represents mean predicted data based on a one compartmental pharmacokinetic model fit of each subject’s data from t= 72–168 h). The boxes enclose all of the observed “trough” values on each morning and are intended to highlight the variance range.
Figure 4
Figure 4. Pharmacokinetic Profiles of Oxycodone in Plasma
Concentration of Oxycodone (Oxy) in plasma following administration of Oxy alone on Days 1 (grey circles, n=10) and Day 8 (open circles, n=10) and in combination with acetazolamide (Day 5, triangles, n=10). Lines represent mean predicted data based on a two compartmental pharmacokinetic model fit of individual plasma data with the fit optimized for each data set.
Figure 5
Figure 5. Pharmacodynamic responses to administration of Oxycodone (Oxy)
White column indicates acetazolamide (ACZ) alone, Black column indicates ACZ+Oxy, Grey Column indicates Oxy alone on Day 1 and hatched column indicates Oxy alone on Day 8 A) Subjective ratings of drug liking on 100mm visual analog scale B) Mean scores of the Opioid Agonist Checklist as rated by both the subjects and observers C) Pupil diameter in mm.

References

    1. Fossler MJ. Patient adherence: Clinical pharmacology’s embarrassing relative. J Clin Pharmacol. 2015;55:365–367. - PubMed
    1. Czobor P, Skolnick P. The Secrets of a Successful Clinical Trial: Compliance, Compliance, and Compliance. Mol Interven. 2011;11:107–110. - PMC - PubMed
    1. Blaschke TF, Osterberg L, Vrijens B, et al. Adherence to medications: insights arising from studies on the unreliable link between prescribed and actual drug dosing histories. Annu Rev Pharmacol Toxicol. 2012;52:275–301. - PubMed
    1. Anderson AL, Li SH, Biswas K, et al. Modafinil for the treatment of methamphetamine dependence. Drug Alcohol Depend. 2012;120:135–141. - PMC - PubMed
    1. McRae-Clark AL, Baker NL, Sonne SC, et al. Concordance of Direct and Indirect Measures of Medication Adherence in A Treatment Trial for Cannabis Dependence. J Subst Abuse Treat. 2015;57:70–74. - PMC - PubMed

MeSH terms