. 2016 Dec;36(12):2058-2071.
doi: 10.1177/0271678X16654492. Epub 2016 Jun 14.

Modulation of glucose metabolism and metabolic connectivity by β-amyloid

Affiliations

Modulation of glucose metabolism and metabolic connectivity by β-amyloid

Felix Carbonell et al. J Cereb Blood Flow Metab. 2016 Dec.

Abstract

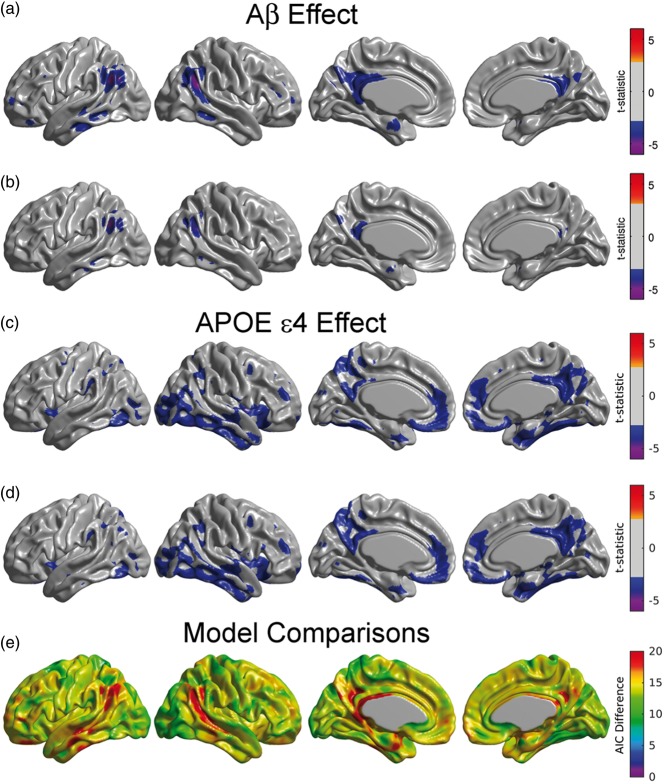
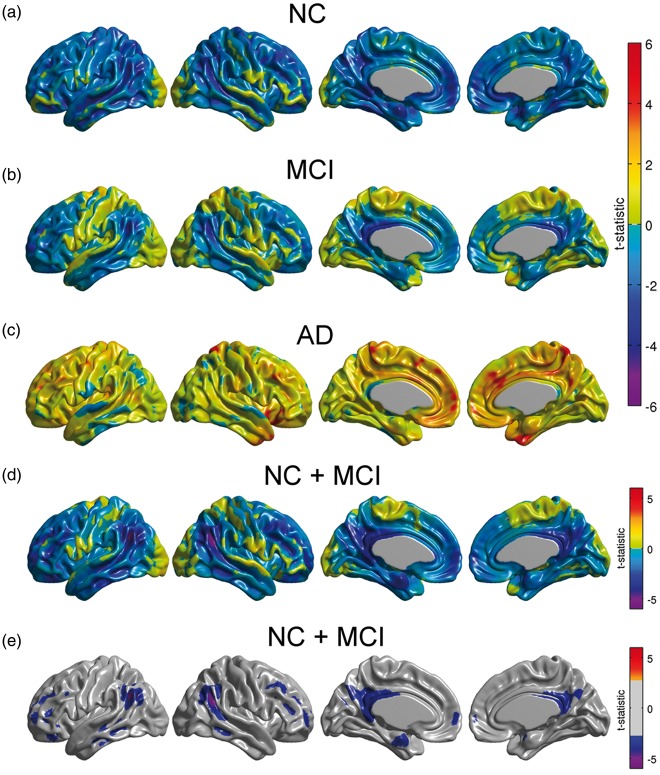
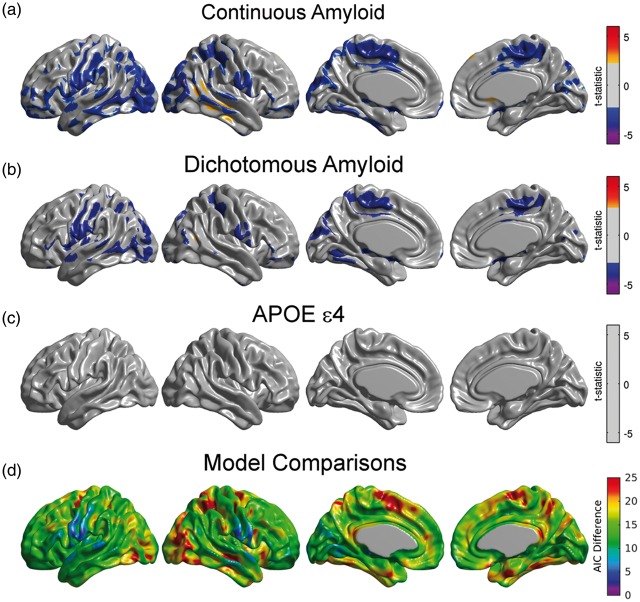
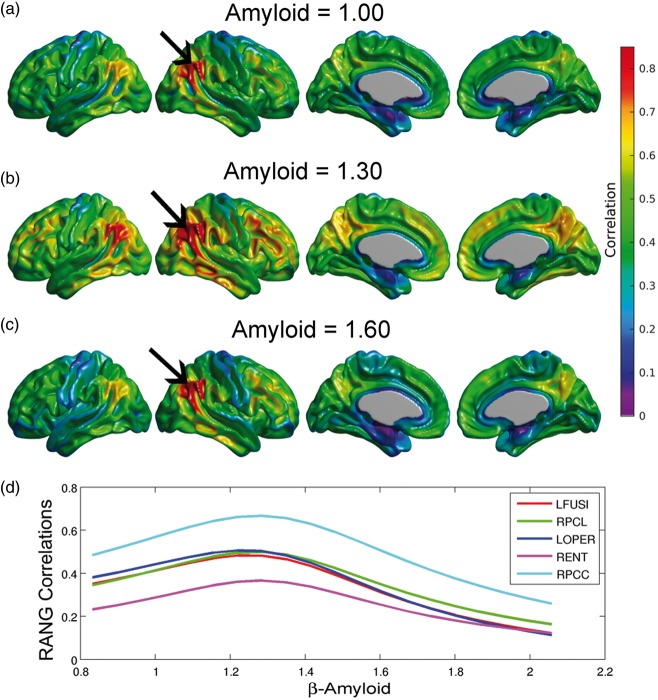
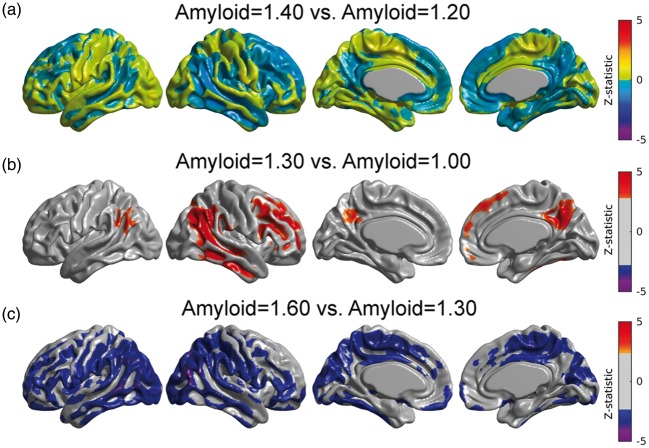
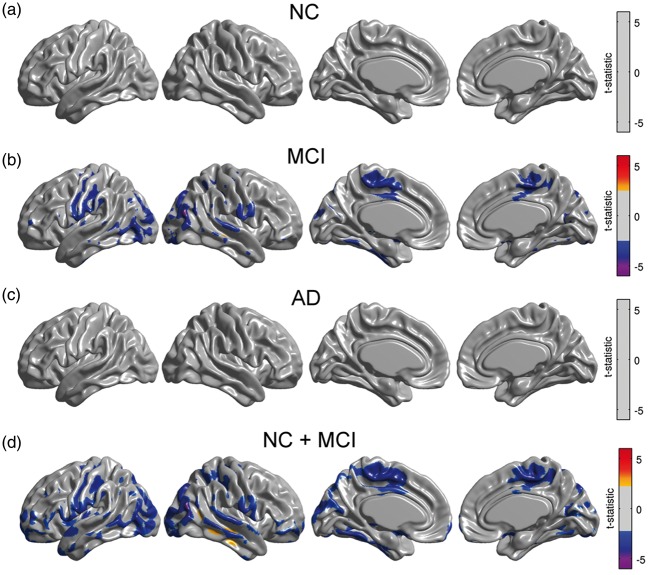
Glucose hypometabolism in the pre-clinical stage of Alzheimer's disease (AD) has been primarily associated with the APOE ɛ4 genotype, rather than fibrillar β-amyloid. In contrast, aberrant patterns of metabolic connectivity are more strongly related to β-amyloid burden than APOE ɛ4 status. A major limitation of previous studies has been the dichotomous classification of subjects as amyloid-positive or amyloid-negative. Dichotomous treatment of a continuous variable, such as β-amyloid, potentially obscures the true relationship with metabolism and reduces the power to detect significant changes in connectivity. In the present work, we assessed alterations of glucose metabolism and metabolic connectivity as continuous function of β-amyloid burden using positron emission tomography scans from the Alzheimer's Disease Neuroimaging Initiative study. Modeling β-amyloid as a continuous variable resulted in better model fits and improved power compared to the dichotomous model. Using this continuous model, we found that both APOE ɛ4 genotype and β-amyloid burden are strongly associated with glucose hypometabolism at early stages of Alzheimer's disease. We also determined that the cumulative effects of β-amyloid deposition result in a particular pattern of altered metabolic connectivity, which is characterized by global, synchronized hypometabolism at early stages of the disease process, followed by regionally heterogeneous, progressive hypometabolism.

Keywords: Alzheimer’s disease; glucose metabolism; metabolic connectivity; positron emission tomography; β-amyloid.


Figures

Figure 1.
Figure 1.
Main effect of β-amyloid on glucose metabolism under the continuous (a) and dichotomized variants (b) of Model (1). Statistically significant regions in (a) correspond to a decreasing glucose metabolism associated with increasing β-amyloid burden. The effect of β-amyloid burden on metabolism is not as evident in (b) due to the dichotomization of the Amyloid variable. (c, d) Main effect of APOE ɛ4 genotype on glucose metabolism for the continuous (a) and dichotomized (b) variants of Model (1). As expected, both variants produce almost identical statistically significant regions of APOE ɛ4 genotype effect. Results (a–d) are shown at an FDR-corrected threshold of 0.05. (e) AIC difference between the continuous and the dichotomous models. Positive values greater than 10 indicate the better model fitting of the continuous variant.
Figure 2.
Figure 2.
(a–c) Unthresholded statistical effects of β-amyloid on glucose metabolism corresponding to NC, MCI, and AD subpopulations. No statistically significant effect of β-amyloid was detected in any of the three cohorts. (d) Unthresholded statistical effect of β-amyloid on metabolism for a combined cohort of NC and MCI subjects. (e) Thresholded t-statistic maps for this combined cohort show statistically significant regions of glucose hypometabolism associated with increasing β-amyloid burden (FDR-corrected threshold at 0.05).
Figure 3.
Figure 3.
(a) Regions where the interaction between the right angular seed and β-amyloid burden showed statistically significant correlation with glucose metabolism. Significant negative values should be interpreted as those regions where the seed-based metabolic slopes decrease with increased β-amyloid burden. (b) Significant differences between AβL and AβH groups for right angular gyrus-based slopes under the dichotomous variant of Model (1). The statistically significant regions are more spatially extended using the continuous variant compared to the dichotomous variant. (c) There is no main effect of APOE ɛ4 genotype on right angular gyrus-based slopes. Results (a–c) are shown at an FDR-corrected threshold of 0.05. (d) AIC difference between the continuous and the dichotomous models shows overall better model fitting for the continuous variant.
Figure 4.
Figure 4.
(a–c) Estimated right angular seed correlations at three different values of the Amyloid variable. The black arrows indicate the anatomical location of the seed placed at the right angular gyrus (RANG). (d) Metabolic correlations as a continuous function of the β-amyloid burden for different target locations: left fusiform gyri (LFUSI), right paracentral lobule (LPCL), left pars opercularis (LOPER), right entorhinal cortex (RENT), and right posterior cingulate cortex (RPCC). Note the evident change in correlation patterns around Amyloid = 1.30.
Figure 5.
Figure 5.
Comparison between metabolic correlations at different Amyloid values. (a) No statistically significant differences in correlations between Amyloid = 1.40 and Amyloid = 1.20, which are symmetric points around the peak (Amyloid = 1.30). (b) Statistically significant regions where right angular gyrus-based metabolic correlations increase from Amyloid = 1.00 to Amyloid = 1.30. (c) Significant decreases in correlations from Amyloid = 1.30 to Amyloid = 1.60. Results (b, c) are shown at an FDR-corrected threshold of 0.05.
Figure 6.
Figure 6.
Statistical effect of β-amyloid on right angular gyrus seed slopes for NC, MCI, and AD subpopulations, as well as in a cohort of NC and MCI subjects. A significant effect was only detected in MCI subjects and in the combined cohort of NC and MCI subjects. Results (a–d) are shown at an FDR-corrected threshold of 0.05.

References

    1. Clark CM, Schneider JA, Bedell BJ, et al. Use of florbetapir-PET for imaging beta-amyloid pathology. J Am Med Assoc 2011; 305: 275–283. - PMC - PubMed
    1. Perani D, Schillaci O, Padovani A, et al. A survey of FDG-and amyloid-PET imaging in dementia and GRADE analysis. Biomed Res Int 2014; 2014: 22. - PMC - PubMed
    1. Liu Y, Yu JT, Wang HF, et al. APOE genotype and neuroimaging markers of Alzheimer’s disease: systematic review and meta-analysis. J Neurol Neurosurg Psychiatry 2015; 86: 127–134. - PMC - PubMed
    1. Rabinovici GD, Jagust WJ. Amyloid imaging in aging and dementia: testing the amyloid hypothesis in vivo. Behav Neurol 2009; 21: 117–128. - PMC - PubMed
    1. Mosconi L, McHugh PF. FDG- and amyloid-PET in Alzheimer’s disease: is the whole greater than the sum of the parts? Q J Nucl Med Mol Imaging 2011; 55: 250–264. - PMC - PubMed

Publication types

MeSH terms

LinkOut - more resources