. 2016 Aug 11;128(6):783-93.
doi: 10.1182/blood-2015-10-676304. Epub 2016 Jun 14.

Modeling altered T-cell development with induced pluripotent stem cells from patients with RAG1-dependent immune deficiencies

Affiliations

Modeling altered T-cell development with induced pluripotent stem cells from patients with RAG1-dependent immune deficiencies

Patrick M Brauer et al. Blood. .

Abstract

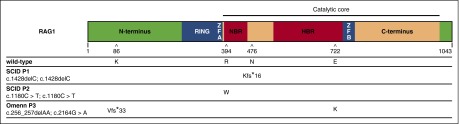
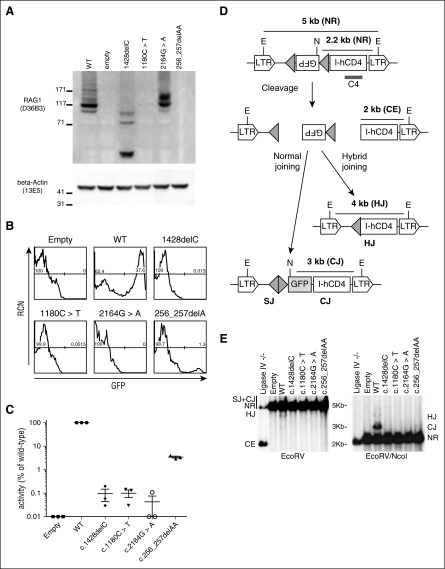
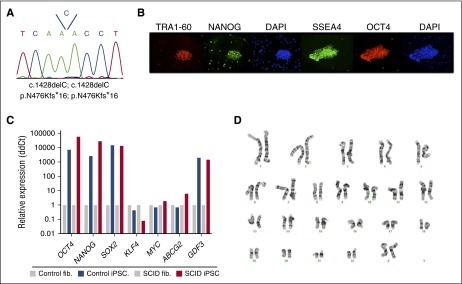
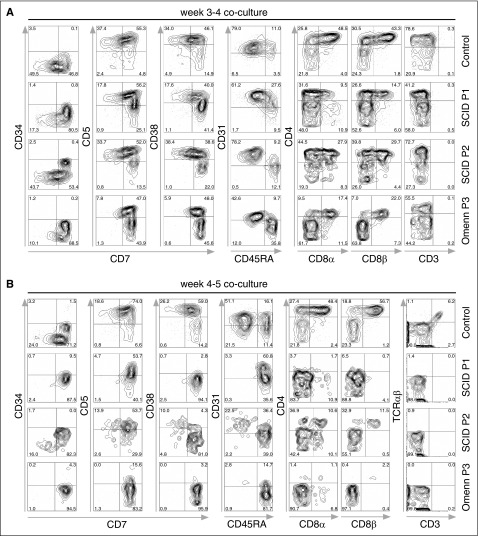
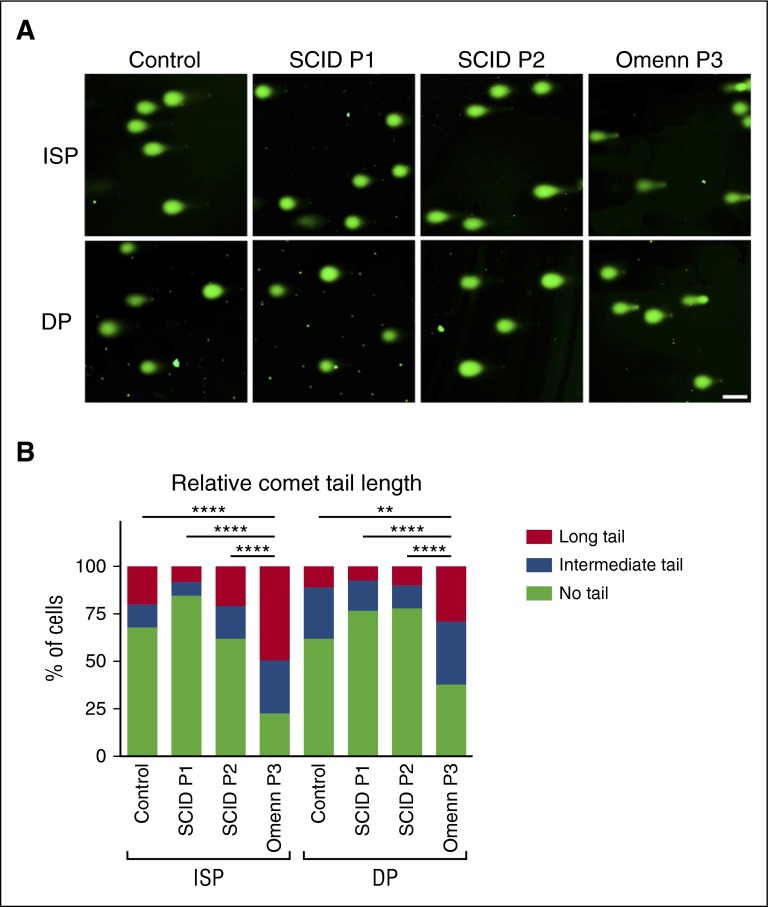
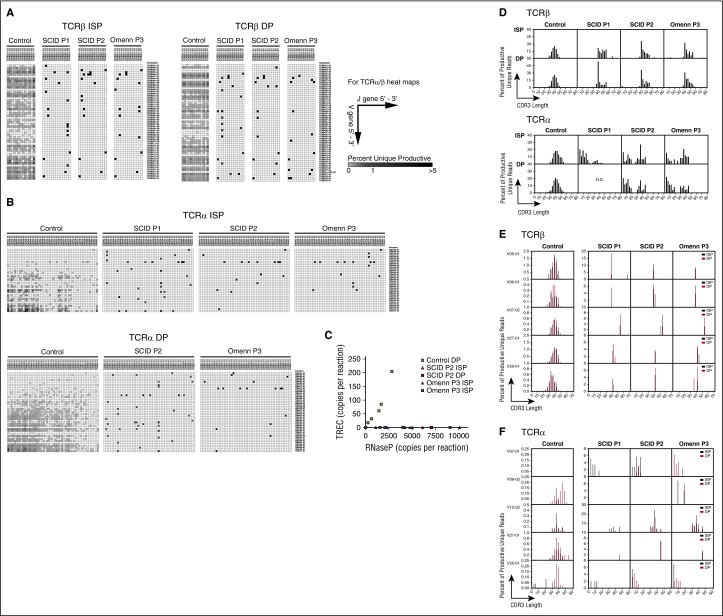
Primary immunodeficiency diseases comprise a group of heterogeneous genetic defects that affect immune system development and/or function. Here we use in vitro differentiation of human induced pluripotent stem cells (iPSCs) generated from patients with different recombination-activating gene 1 (RAG1) mutations to assess T-cell development and T-cell receptor (TCR) V(D)J recombination. RAG1-mutants from severe combined immunodeficient (SCID) patient cells showed a failure to sustain progression beyond the CD3(--)CD4(-)CD8(-)CD7(+)CD5(+)CD38(-)CD31(-/lo)CD45RA(+) stage of T-cell development to reach the CD3(-/+)CD4(+)CD8(+)CD7(+)CD5(+)CD38(+)CD31(+)CD45RA(-) stage. Despite residual mutant RAG1 recombination activity from an Omenn syndrome (OS) patient, similar impaired T-cell differentiation was observed, due to increased single-strand DNA breaks that likely occur due to heterodimers consisting of both an N-terminal truncated and a catalytically dead RAG1. Furthermore, deep-sequencing analysis of TCR-β (TRB) and TCR-α (TRA) rearrangements of CD3(-)CD4(+)CD8(-) immature single-positive and CD3(+)CD4(+)CD8(+) double-positive cells showed severe restriction of repertoire diversity with preferential usage of few Variable, Diversity, and Joining genes, and skewed length distribution of the TRB and TRA complementary determining region 3 sequences from SCID and OS iPSC-derived cells, whereas control iPSCs yielded T-cell progenitors with a broadly diversified repertoire. Finally, no TRA/δ excision circles (TRECs), a marker of TRA/δ locus rearrangements, were detected in SCID and OS-derived T-lineage cells, consistent with a pre-TCR block in T-cell development. This study compares human T-cell development of SCID vs OS patients, and elucidates important differences that help to explain the wide range of immunologic phenotypes that result from different mutations within the same gene of various patients.


Figures

Figure 1
Figure 1
Scheme of RAG1 protein and mutations. WT human RAG1 consists of 1043 amino acids and includes an N-terminus domain, really interesting new gene (RING) finger sequence, zinc finger sequences zinc finger A (ZFA) and zinc finger B (ZFB), the catalytic core, which contains the nonamer- and heptamer-binding regions, and a C-terminus domain. The amino acid positions affected by mutations identified in patients with SCID (P1 and P2) and with OS (P3), and the respective consequences on amino acid sequence are shown. P1 and P2 were homozygous for a frameshift (N476Kfs*16) and a missense (R394W) mutation, respectively. P3 was compound heterozygous for a missense (E722K) and a frameshift (K86Vfs*33). For the latter, an alternative start codon can be used resulting in an N-terminus truncated protein with normal sequence from Met183 onward with cytoplasmic localization. HBR, heptamer-binding region; NBR, nonamer-binding region.
Figure 2
Figure 2
Recombination activity of mutant RAG1. (A) Immunoblot analysis of Rag1−/− pro-B Abelson cells expressing WT human RAG1, empty vector, or hypomorphic RAG1-mutant alleles from P1 (1428delC), P2 (1180C>T), and P3 (256_257delAA and 2164G>A). N-terminus–specific anti-RAG1 antibody (D36B3) cannot detect the N-terminus–truncated 256_257delAA. β-Actin serves as a loading control, and molecular weight markers (in kDa) are marked. (B) Flow cytometric analysis of Rag1−/− pro-B Abelson cells containing a pMX-INV cassette with an inverted GFP sequence flanked by RSS (shown as gray triangles in [D]), and transduced with retroviral vectors expressing WT, empty, or hypomorphic RAG1 mutants. GFP+ events indicate rearrangement. (C) Recombination activity in transduced Rag1−/− pro-B cells, expressed as a percentage of activity detected in cells expressing WT RAG1. For each construct, 3 independent experiments were performed, and mean value ± standard deviation is shown. (D) Schematic representation showing nonrearranged (NR) products flanked by Escherichia coli RV (EcoRV) (E) sites (5 kb), or EcoRV (E) and Nocardia corallina I (NcoI) (N) sites (2.2 kb). Recombination results in normal joining, producing a 3 kb fragment (coding joining [CJ]) flanked by N and E sites, or hybrid joining (HJ) flanked by V sites and producing a 4 kb fragment. Successful cleavage but unresolved CEs produce a 2 kb fragment. C4 represents the location of the probe to visualize the various fragments for Southern blotting. (E) Southern blot showing products of rearrangement of the pMX-INV vector in pro-B Abelson cells expressing ligase IV null, empty vector, WT RAG1, or one of the four hypomorphic RAG1 mutants. Hybridization with the C4 probe with EcoRV digest reveals NR, HJ, or CE events, and EcoRV+NcoI digest reveals HJ, CJ, or NR events. LTR, long terminal repeat; RCN, relative cell number; SJ, signal joining.
Figure 3
Figure 3
Characterization of an iPSC line reprogrammed from fibroblasts from P1. (A) Sequencing of genomic DNA from the iPSC line, revealing homozygosity for the same single nucleotide deletion at position 1428 identified in parental fibroblasts, and resulting in the p.N476Kfs*16 mutation. (B) Immunofluorescent staining and (C) quantitative PCR analysis of pluripotency markers expressed by the iPSCs. (D) Karyotypic integrity of P1 iPSC line.
Figure 4
Figure 4
In vitro T-lineage differentiation of control and SCID iPSC lines. Flow cytometric analysis of T-lineage developmental progression of control- and patient-derived cells. iPSCS were allowed to differentiate for 8 days into embryoid bodies, and magnetic bead-purified CD34+ cells were cocultured with OP9-DL-4 cells. (A) Cells from P1 and P2 with SCID, and from P3 with OS attained normal expression of early markers of T-lineage differentiation (CD7, CD5, and CD38) upon 3 to 4 weeks of coculture with OP9-DL-4 cells. (B) After 4 to 5 weeks of coculture, cells from a healthy control progress to the CD4+ CD8αβ+ DP stage of differentiation, with the appearance of CD3+ TRA/TRB+ cells. By contrast, SCID- and OS-derived cells were mostly blocked at the CD7+ CD31−/+ CD45RA+ stage of differentiation, with a virtual absence of CD4 and CD8α/β expression, and lack of CD3+ cells. In (A-B), cells were pre-gated for lymphocytes (SSCxFSC), DAPI-, and CD45+. DAPI, 4′,6-diamidino-2-phenylindole; FSC, forward scatter; SSC, side scatter.
Figure 5
Figure 5
Accumulation of single- or double-stranded DNA breaks. (A) Alkaline single cell gel electrophoresis (Comet assay) of CD4+CD8 (ISP) and CD4+CD8+ (DP) subpopulations for control, SCID P1, P2, and OS P3 cells. DNA was visualized by SYBR Gold. The scale bar corresponds to 100 μm. Tail lengths were measured and summarized in (B). ****P < .0001; **P < .01.
Figure 6
Figure 6
Next generation sequencing analysis of TCR repertoire upon in vitro T-lineage differentiation of control, SCID (P1 and P2), and OS (P3)-derived iPSCs. (A) Heat map representation of percentage of TRB VJ (orientated via chromosomal 5′ to 3′ distribution) pairings among unique sequences in ISP (left) and DP (right) T-lineage cells derived from the indicated patient iPS lines. Results demonstrate 1 representative sample from 2 experiments with similar results. (B) Heat map representation of percentage of TRA VJ (orientated via chromosomal 5′ to 3′ distribution) pairings among total sequences (all δ rearrangements excluded from analysis) in ISP (left) and DP (right) T-lineage cells derived from the indicated patients’ iPS lines among unique sequences. Results demonstrate 1 representative sample from 2 experiments with similar results. (C) Quantitative PCR analysis of TRECs in control, SCID P2, and OS P3 cells. RNase P was used as an internal control for quality of genomic DNA amplification. (D) Virtual spectratyping, showing skewing in the distribution of CDR3 lengths among unique TRB or TRA sequences expressed by ISP (top) and DP (bottom) cells in SCID P1, P2, and Omenn P3 compared with control. (E) Distribution of CDR3 length for 5 more commonly expressed V genes in each sample for unique TRB sequences. (F) Distribution of CDR3 length for 5 more commonly expressed V genes in each sample for unique TRA sequences. Results demonstrate 1 representative sample from 2 experiments with similar results. RNase P, ribonuclease P.

Comment in

Similar articles

Cited by

References

    1. Picard C, Al-Herz W, Bousfiha A, et al. Primary immunodeficiency diseases: an pdate on the classification from the International Union of Immunological Societies Expert Committee for Primary Immunodeficiency 2015. J Clin Immunol. 2015;35(8):696–726. - PMC - PubMed
    1. Bassing CH, Swat W, Alt FW. The mechanism and regulation of chromosomal V(D)J recombination. Cell. 2002;109(suppl):S45–S55. - PubMed
    1. Roth DB, Menetski JP, Nakajima PB, Bosma MJ, Gellert M. V(D)J recombination: broken DNA molecules with covalently sealed (hairpin) coding ends in scid mouse thymocytes. Cell. 1992;70(6):983–991. - PubMed
    1. Fugmann SD. RAG1 and RAG2 in V(D)J recombination and transposition. Immunol Res. 2001;23(1):23–39. - PubMed
    1. Notarangelo LD, Kim MS, Walter JE, Lee YN. Human RAG mutations: biochemistry and clinical implications. Nat Rev Immunol. 2016;16(4):234–246. - PMC - PubMed

Publication types

Substances