. 2016 Jun 15;143(12):2217-27.
doi: 10.1242/dev.133272.

Real-time 3D visualization of cellular rearrangements during cardiac valve formation

Affiliations

Real-time 3D visualization of cellular rearrangements during cardiac valve formation

Jenny Pestel et al. Development. .

Abstract

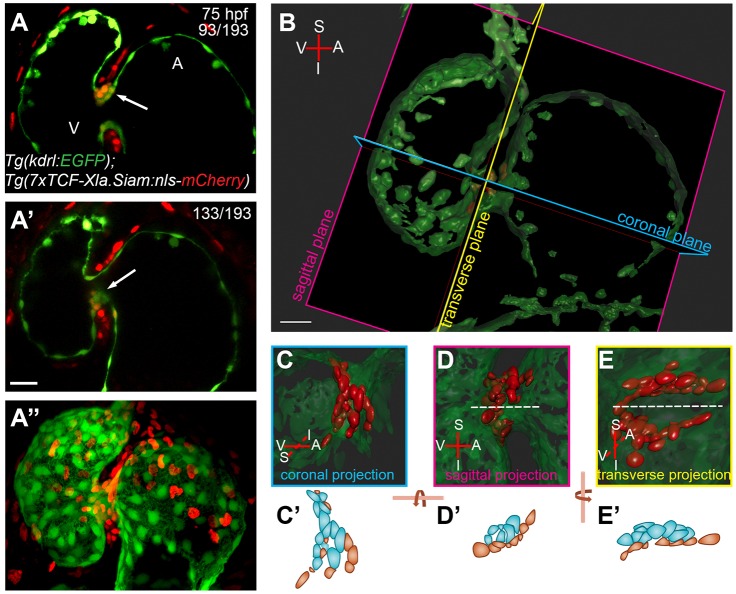
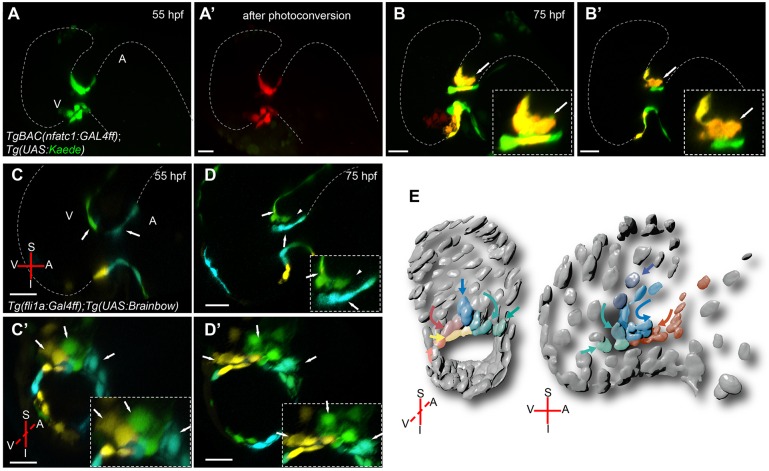
During cardiac valve development, the single-layered endocardial sheet at the atrioventricular canal (AVC) is remodeled into multilayered immature valve leaflets. Most of our knowledge about this process comes from examining fixed samples that do not allow a real-time appreciation of the intricacies of valve formation. Here, we exploit non-invasive in vivo imaging techniques to identify the dynamic cell behaviors that lead to the formation of the immature valve leaflets. We find that in zebrafish, the valve leaflets consist of two sets of endocardial cells at the luminal and abluminal side, which we refer to as luminal cells (LCs) and abluminal cells (ALCs), respectively. By analyzing cellular rearrangements during valve formation, we observed that the LCs and ALCs originate from the atrium and ventricle, respectively. Furthermore, we utilized Wnt/β-catenin and Notch signaling reporter lines to distinguish between the LCs and ALCs, and also found that cardiac contractility and/or blood flow is necessary for the endocardial expression of these signaling reporters. Thus, our 3D analyses of cardiac valve formation in zebrafish provide fundamental insights into the cellular rearrangements underlying this process.

Keywords: Apc; Cardiac valves; Endocardium; Live imaging; Notch; Wnt; Zebrafish.


Conflict of interest statement

Competing interests

The authors declare no competing or financial interests.

Figures

Fig. 1.
Fig. 1.
3D analysis of cardiac valve formation. (A-A″) z-stack of a 75 hpf Tg(kdrl:EGFP);Tg(7xTCF-Xla.Siam:nls-mcherry) heart; ventral view. Coexpression of endothelial-specific EGFP and TCF-driven mCherry marks the valve-forming cells in the single-plane images. Coexpression marking the superior part of the AVC is shown in z-stack plane 93 (A, arrow) and colocalization marking the inferior part of the AVC is shown in z-stack plane 133 (A′, arrow). Maximum projection of the z-stack is shown in A″. (B) 3D volume rendering of dataset from A. Note that Imaris software was used to remove the mCherry signal not co-occurring or overlapping with EGFP, so that only endocardial mCherry+ cells are shown. The coronal, sagittal and transverse planes of the heart were defined based on the orientation of the linear heart tube. (C-E) Close ups of the 3D volume rendered views in coronal, sagittal and transverse projections, respectively. The superior immature valve is above the dashed line in D and E. (C′,D′,E′) Cartoons of TCF:mCherry+ endocardial cells of the superior half of the AVC. Cells colored in blue represent abluminal cells (ALCs) and cells colored in reddish brown represent luminal cells (LCs). A, atrium; I, inferior AVC; S, superior AVC; V, ventricle. Scale bar: 20 µm.
Fig. 2.
Fig. 2.
Complex cell rearrangements form the immature valve leaflets. 3D volume renderings of Tg(kdrl:nls-EGFP) embryonic hearts of three representative examples at 50 (A,A′), 60 (B,B′) and 70 (C,C′) hpf. 3D volume rendered views in sagittal and coronal projections are shown in A-C and A′-C′, respectively. The single-layered AVC endocardium is remodeled into a multilayered structure by an increasing number of endocardial cells located at the abluminal side of the immature valve (false colored in blue). At 60 hpf, 4 (B,B′,D) and at 70 hpf, 10 (C,C′,D) cells are detected at the abluminal side of the valve. Quantification of the mean (±s.d.) number of cells at the luminal and abluminal sides of the forming valve is shown in D. At 50 hpf, cells at the superior AVC were counted in 19 embryos, at 60 hpf in 17 embryos and at 70 hpf in 20 embryos. Blue cells represent those located at the abluminal side and reddish brown cells represent those at the luminal side of the forming valve. Cartoons depict cell arrangements observed at the superior AVC. A, atrium; I, inferior AVC; S, superior AVC; V, ventricle. Scale bars: 20 µm.
Fig. 3.
Fig. 3.
Endocardial cell movements from the atrium and ventricle contribute to cardiac valve formation. 3D sagittal projection of a TgBAC(nfatc1:GAL4ff);Tg(UAS:Kaede) heart before (A) and after (A′) photoconversion at 55 hpf. Strong ‘nfatc1’ expression can be detected at the AVC. 3D projection (B) and optical section (B′) of the heart shown in A at 75 hpf. Arrows in B and B′ indicate forming valve. New green cells can be observed at the AVC indicating a contribution of nfact1-positive cells from outside the AVC to the valve region. Red fluorescent cells remain at the AVC. Magnifications of the forming valve are shown in B and B′, insets. (C,D) Sagittal planes of a Tg(fli1a:Gal4ff);Tg(UAS:Brainbow) heart. Embryos were injected with Cre mRNA at the one-cell stage and imaged at 55 (C) and 75 (D) hpf. Green fluorescent cells located in the ventricle at 55 hpf (C, green, arrow) appear to move towards the AVC (D). A subset of these cells can be detected in the abluminal side of the valve (D, arrowhead). Cyan fluorescent cells in the atrium also appear to move towards the AVC (D). However, these cells appear to join the group of cells lining the AVC lumen (D, cyan, arrow). (C′,D′) Transverse planes of the same datasets as in C and D, respectively. (E) A model of the deduced cell movements. A, atrium; I, inferior AVC; S, superior AVC; V, ventricle. Scale bars, 20 µm.
Fig. 4.
Fig. 4.
4D analyses of beating hearts show that cells located at the abluminal side of the immature valve contribute to a more efficient closure of the AVC. 3D volume rendering of a Tg(kdrl:nls-EGFP) heart in different contraction stages in sagittal (A-F) and transverse (A′-F′) projections. Unsynchronized z-stacks of a beating heart were taken at 55 and 75 hpf. The images were post-acquisitionally aligned. For a better understanding of the cell movements during cardiac contraction, a subset of cells was false colored. At 55 hpf, cells at the atrial side of the AVC (purple and red) form a ring that progressively constricts to achieve the closure of the AVC (A′,B′). During ventricular systole, cells lining the ventricular side of the AVC (false colored in green) also support the closure of the AVC. At 75 hpf, the closure of the AVC starts with the downward movement of a subset of cells at the atrial side of the AVC (brown and red). These cells touch the opposite side of the AVC (E,E′), and their downward movement transforms into a sideward movement (arrows), which brings additional cells in contact with each other (F,F′). Note that for a better view of the valve leaflets, ventral cells covering the AVC were removed in D-F, but can be seen in D′-F′ (asterisk). Cells on the abluminal side are false colored in blue (D-F′). Insets show cartoons of the AVC. A, atrium; I, inferior AVC; S, superior AVC; V, ventricle. Scale bars: 40 µm.
Fig. 5.
Fig. 5.
Notch and Wnt/β-catenin signaling reporters exhibit different expression patterns in the forming cardiac valve and their activity in endocardial cells is dependent on cardiac contraction and/or blood flow. Sagittal planes of Tg(Tp1:VenusPEST);Tg(Tp1:mCherry-CAAX) hearts at 70 (A) and 75 (B) hpf. A magnification of the forming valve at 75 hpf is shown in B, inset; single channels are shown in B′ and B″. The expression of both VenusPEST and mCherry-CAAX is driven by the Notch signaling-responsive element Tp1. At 75 hpf, in contrast to the mCherry-CAAX signal, which can be detected in both the ventricle and AVC (A,B,B′), the VenusPEST signal is only detectable in a subset of AVC cells lining the lumen (B,B″). At 70 hpf, the VenusPEST signal could also be detected in cells located at the border between the ventricle and AVC (A). (C,D) Sagittal plane of a 75 hpf Tg(fli1:Gal4db-TΔC-2A-mC);Tg(UAS:EGFP);Tg(fli1:Myr-mCherry) heart. In contrast to the Notch reporter, the Wnt/β-catenin reporter is mainly expressed on the abluminal side of the valve (arrows). (E) Quantification of the number of AVC endocardial cells expressing VenusPEST of the Notch reporter or EGFP of the Wnt/β-catenin reporter. Data are mean±s.d. of 14±2 VenusPEST+ cells (n=7 larvae) and 12±2 Wnt/β-catenin+ cells (n=14 larvae). (F-I) 75 hpf tnnt2a morphant hearts (G,I) and hearts of control injected larvae (F,H). Sagittal plane of Tg(kdrl:ras-mCherry);Tg(Tp1:VenusPEST) tnnt2a morphant heart shows that Tp1:VenusPEST+ cells observed in controls (F) are not detectable in non-beating hearts (G). Similarly, the TCF:EGFP signal in endocardial cells located at the AVC of control hearts (H, arrow) is downregulated in Tg(7xTCF-Xla.Siam:EGFP) tnnt2a morphants (I). A, atrium; V, ventricle. Scale bars: 20 µm.
Fig. 6.
Fig. 6.
apc mutants exhibit a disorganized accumulation of cells at the AVC. Maximum projection images of Tg(kdrl:nls-EGFP) apc mutant (B,D,F) and wild-type sibling (A,C,E) hearts at 55 (A,B), 60 (C,D) and 75 (E,F) hpf. Compared with the wild-type sibling hearts, the apc mutant hearts appear elongated (A-D). (C″,D″) Sagittal planes of 60 hpf wild-type sibling and apc mutant hearts, respectively. Insets in C″ and D″ show a magnification of the immature valve. At around 60 hpf, the valvular structures appear enlarged in apc mutants and more cells exhibit a cone-shaped nucleus (C″,D″, arrows). Note that this valve phenotype appears to depend on the overall phenotype of the heart; as the heart deteriorates the valvular structures at the AVC seem to dissolve. At 75 hpf, the distinctly structured immature valve leaflet in wild-type siblings (E,E′) is replaced by a disorganized accumulation of cells at the AVC of apc mutants (F,F′). Transverse planes through the AVC of apc mutants (A′-F′) show that these animals exhibit a more circular shaped AVC (B′,D′,F′), instead of the elliptically shaped AVCs seen in wild-type siblings (A′,C′,E′). Cells at the abluminal side of the valve appear to be distributed all around the AVC in apc mutants (F′, arrows) and are not restricted to the superior AVC as in wild-type siblings (E′, arrow). A, atrium; V, ventricle. Scale bars: 20 µm.

References

    1. Ahuja S., Dogra D., Stainier D. Y. and Reischauer S. (2016). Id4 functions downstream of Bmp signaling to restrict TCF function in endocardial cells during atrioventricular valve development. Dev. Biol. 412, 71-82. 10.1016/j.ydbio.2016.02.003 - DOI - PubMed
    1. Armstrong E. J. and Bischoff J. (2004). Heart valve development: endothelial cell signaling and differentiation. Circ. Res. 95, 459-470. 10.1161/01.RES.0000141146.95728.da - DOI - PMC - PubMed
    1. Asakawa K., Suster M. L., Mizusawa K., Nagayoshi S., Kotani T., Urasaki A., Kishimoto Y., Hibi M. and Kawakami K. (2008). Genetic dissection of neural circuits by Tol2 transposon-mediated Gal4 gene and enhancer trapping in zebrafish. Proc. Natl. Acad. Sci. USA 105, 1255-1260. 10.1073/pnas.0704963105 - DOI - PMC - PubMed
    1. Auman H. J., Coleman H., Riley H. E., Olale F., Tsai H.-J. and Yelon D. (2007). Functional modulation of cardiac form through regionally confined cell shape changes. PLoS Biol. 5, e53 10.1371/journal.pbio.0050053 - DOI - PMC - PubMed
    1. Bartman T., Walsh E. C., Wen K.-K., McKane M., Ren J., Alexander J., Rubenstein P. A. and Stainier D. Y. R. (2004). Early myocardial function affects endocardial cushion development in zebrafish. PLoS Biol. 2, e129 10.1371/journal.pbio.0020129 - DOI - PMC - PubMed

Publication types

Substances