. 2016 Jun 28;113(26):7041-6.
doi: 10.1073/pnas.1602789113. Epub 2016 Jun 14.

Polymers in the gut compress the colonic mucus hydrogel

Affiliations

Polymers in the gut compress the colonic mucus hydrogel

Sujit S Datta et al. Proc Natl Acad Sci U S A. .

Abstract

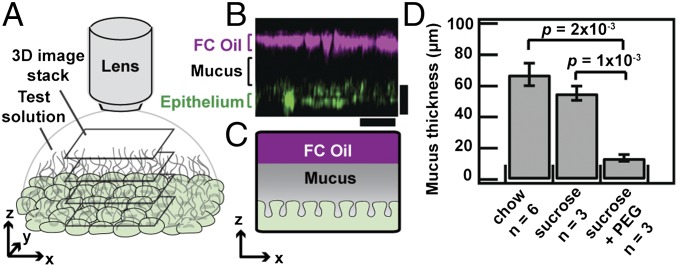
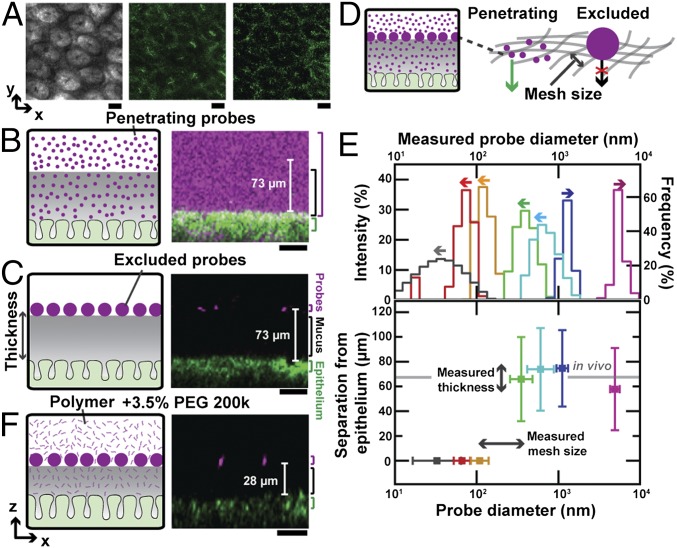
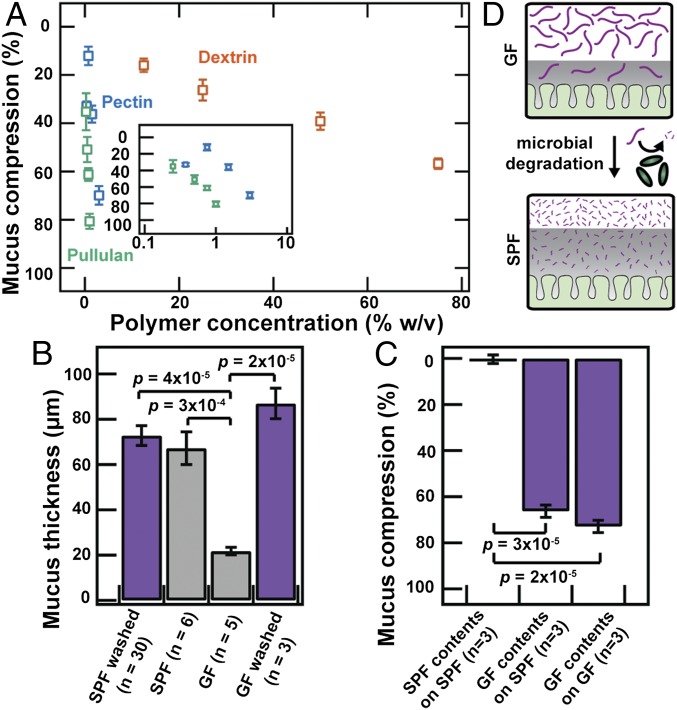
Colonic mucus is a key biological hydrogel that protects the gut from infection and physical damage and mediates host-microbe interactions and drug delivery. However, little is known about how its structure is influenced by materials it comes into contact with regularly. For example, the gut abounds in polymers such as dietary fibers or administered therapeutics, yet whether such polymers interact with the mucus hydrogel, and if so, how, remains unclear. Although several biological processes have been identified as potential regulators of mucus structure, the polymeric composition of the gut environment has been ignored. Here, we demonstrate that gut polymers do in fact regulate mucus hydrogel structure, and that polymer-mucus interactions can be described using a thermodynamic model based on Flory-Huggins solution theory. We found that both dietary and therapeutic polymers dramatically compressed murine colonic mucus ex vivo and in vivo. This behavior depended strongly on both polymer concentration and molecular weight, in agreement with the predictions of our thermodynamic model. Moreover, exposure to polymer-rich luminal fluid from germ-free mice strongly compressed the mucus hydrogel, whereas exposure to luminal fluid from specific-pathogen-free mice-whose microbiota degrade gut polymers-did not; this suggests that gut microbes modulate mucus structure by degrading polymers. These findings highlight the role of mucus as a responsive biomaterial, and reveal a mechanism of mucus restructuring that must be integrated into the design and interpretation of studies involving therapeutic polymers, dietary fibers, and fiber-degrading gut microbes.

Keywords: biomaterials; biophysics; hydrogel; mucus; polymers.


Conflict of interest statement

The authors declare no conflict of interest.

Figures

Fig. 1.
Fig. 1.
Polymers compress colonic mucus hydrogel in vivo. (A) Schematic depicting visualization of adherent colonic mucus hydrogel. (B) Side-view confocal micrograph showing FC oil–mucus interface (magenta) separated from the epithelial surface (green) by the adherent mucus hydrogel (depicted in black). (Scale bars, 30 μm.) (C) Schematic of side view shown in B. (D) FC oil mucus thickness measurements for colonic explants taken from SPF mice given ad libitum access to food on either a standard chow diet, 5% (wt/vol) sucrose in 1× PBS, or 5% (wt/vol) sucrose with 7% (wt/vol) PEG 200k in 1× PBS. Data show means ± SEM.
Fig. S1.
Fig. S1.
Images of murine epithelium in the xy and xz planes. (A) Two-photon and (B) bright-field micrographs of unwashed epithelium from a mouse fed standard chow, imaged under FC oil. (C and D) Side views of lectin-stained epithelium washed with saline and imaged under aqueous solutions. Staining was performed by incubating a colon explant with 200 μL of a test solution of 2 mg/mL Rhodamine Ulex Europaeus Agglutinin I (Vector Laboratories), which stains α-l-fucose residues on the surface of epithelial cells, in Hepes buffer in a sealed Petri dish for 10 min at 4 °C, then washing the exposed luminal side with several milliliters of ice-cold 1× PBS. We then immediately imaged the explant surface using (C) confocal fluorescence microscopy (543-nm excitation/560-nm long-pass filter) and (D) confocal reflectance microscopy (514-nm excitation/505-nm long-pass filter). Epithelial surface is indicated by green arrows, confirming that the position of the epithelium agrees between the different imaging modalities. The adherent mucus hydrogel overlies the epithelium in the direction of increasing z above the green arrows. (All scale bars, 30 μm.)
Fig. 2.
Fig. 2.
Polymers compress colonic mucus hydrogel ex vivo. (A) Bright-field (Left), confocal reflectance (Middle), and two-photon (Right) micrographs of epithelial surface. Image levels were adjusted for clarity (SI Materials and Methods). (Scale bars, 30 μm.) (B, C, and F) (Left) Schematics. (Right) Side-view confocal micrographs. (Scale bars, 10 μm.) (B) Penetration of mucus by low concentration [0.05% (wt/vol)] of mPEG-FITC 200k. (C) Exclusion from mucus of 1-μm microparticle probes. (D) Schematic depicts mucus mesh structure, with penetrating probes on the left and larger nonpenetrating probe on the right. (E) (Top) Probe size distributions measured using dynamic light scattering (left axis, arrows to the left) or optical microscopy (right axis, arrows to the right). (Bottom) Minimal probe separation from epithelial surface. Horizontal positions and error bars show geometric mean ± geometric SD of lognormal fits to size distributions. Vertical positions and error bars show mean ± SD. Gray bar shows mean of FC oil measurements of in vivo thickness for mice fed chow. Penetration measurements used fluorescently labeled polymers at concentrations below those that cause mucus compression. (F) Compression of colonic mucus by 3.5% (wt/vol) PEG 200k.
Fig. S2.
Fig. S2.
False-color side view showing wheat germ agglutinin (WGA)-stained adherent mucus hydrogel. We first deposited 1-μm-diameter microparticles onto the explant surface of a freshly excised, washed, and mounted colonic explant. After incubating for 1 h at 4 °C, we then stained the colonic mucus with WGA, a fluorescent lectin that specifically binds to sialic acid sugar residues in the mucins. We prepared 10 μg/mL of WGA-Oregon Green (Invitrogen) in 1× PBS, placed a ∼0.5-mL drop on the exposed surface of the explant, and incubated the sealed Petri dish for 5 min at room temperature. We then washed the exposed surface with several milliliters of ice-cold 1× PBS and immediately imaged the explant surface (lower magenta surface) and the deposited 1-μm microparticles (upper magenta circles) using confocal reflectance microscopy and the stained mucus hydrogel using confocal fluorescence microscopy (488-nm excitation/505-nm long-pass filter). Image is a superimposition of two separate, parallel side views taken at two neighboring positions in the xy plane. We observed that the position of the deposited microparticles agrees with the top of the stained mucus hydrogel. (Scale bars, 30 μm.)
Fig. S3.
Fig. S3.
Colocalization of signal from microparticle probes and epithelium from different imaging modalities. (A) Bright field, (B) fluorescence excitation, and (C) reflectance images of 1-μm probes of the same xy slice. (D) An xz side view of fluorescence signal from 1-μm probes. (E) The same xz side view as in D but of the reflectance signal from 1-μm probes and epithelial surface. (F) Bright-field and (G) reflectance images of the epithelial surface of the same xy slice. The arrow linking C to E indicates the vertical position of the xy slice shown in AC. The arrow linking G to E indicates the vertical position of the xy slice shown in F and G. This confirms that the positions of the microparticles given by confocal reflectance and confocal fluorescence microscopy agree. (Scale bars, 30 μm.)
Fig. S4.
Fig. S4.
Overview of image processing of confocal side views. To eliminate artifacts associated with staining and accelerate image acquisition, we used label-free confocal reflectance microscopy to simultaneously image the underlying epithelium (lower surface) and the microparticles deposited on the adherent mucus hydrogel (upper bright spots). To obtain the false-color side views, we first thresholded each side view; A shows a representative xz side view before processing and B shows the image after thresholding, with uniform enhancement of brightness and contrast across the entire image. The image was then split into two parts, and the epithelium was false-colorized green (C) and the deposited microparticles or oil–mucus interface (for imaging of unwashed tissues with FC oil) were false-colorized magenta (D). Dashed lines indicate where images (C and D) were split. Merging these two channels produced the side-view images shown, exemplified by E. Unless otherwise noted, all of our experiments mapped z ranges spanning from below the epithelial surface to well above the mucus hydrogel surface. Each of the side-view images presented in this paper was cropped and scaled in xz for clarity (indicated by the x and z scale bars), to focus on the region corresponding to the mucus hydrogel. (Scale bars, 30 μm.)
Fig. S5.
Fig. S5.
False-color side views (xz plane) of 3D stacks showing probes excluded from (top row) or penetrating (bottom row) the mucus hydrogel. (A) Mixture of both 250-nm and 1-μm microparticles and (B) 500-nm particles were excluded from the adherent mucus hydrogel. The probes (magenta) were unable to diffuse through the mucus and instead deposited on top of the hydrogel. The probes and the epithelium were simultaneously imaged using (A) 514-nm excitation/505-nm long-pass filter and (B) 800-nm excitation/650-nm long-pass filter. (C) Fluorescent PEG 200 kDa, (D) fluorescent dextran 2 MDa, (E) fluorescent 100-nm microparticle probes all penetrate the hydrogel. Note that polymers in A and B were used at concentrations below those that cause mucus compression. The probes (magenta) diffused through the mucus and reached the underlying epithelium (green), except for some isolated regions immediately adjacent to the epithelium observed in some experiments (dark patches). The probes were imaged using confocal fluorescence microscopy (488-nm excitation/505-nm long-pass filter) and the epithelium was imaged using confocal reflectance microscopy. The adherent mucus hydrogel overlies the epithelium in the direction of increasing z above the green arrows; solid and dashed white lines in C indicate the approximate average and maximal positions of the top of the mucus, measured using 1-μm microparticles. In each experiment using probes of different sizes, after placing the test solution onto the exposed luminal surface, we incubated the tissue at 4 °C for 1–2 h before imaging the explant. We estimated the time required for probes 100 nm or smaller to diffuse through the mucus as being <10 min, and the time required for the 250-nm probes to diffuse across the vertical extent of the mucus in free solution as being ∼10 min, both much shorter than the incubation time. We thus deduce that the fluorescent probes smaller than the measured mucus mesh size had sufficient time to diffuse through the mucus to the underlying epithelium, and that the measured exclusion of the larger probes reflects the presence of the adherent mucus hydrogel. (Scale bars, 30 μm.)
Fig. S6.
Fig. S6.
Side view showing penetration of mucus hydrogel by polymers. The polymer self-diffusion coefficient in the free solution outside the mucus, Dfree, is represented by D0 for the dilute polymer solutions and can be estimated as DfreeD0(c/c*)−7/4 for the polymer solutions that were above their overlap concentration c*. Our experiments spanned D0 ≈ 10−11 to 3 × 10⁻¹⁰ m2/s and c/c* ≈ 0–10, therefore Dfree ≈ 2 × 10⁻¹³ to 3 × 10⁻¹⁰ m2/s. The characteristic time taken for the polymers to diffuse through the mucus can thus be estimated as ranging from ∼1 s to 1 h, shorter than the time taken to perform the experiments. We thus assume that the polymer molecules were able to diffuse through the mucus hydrogel before imaging commenced in all of the experiments. To study the steady-state penetration of the PEG into the adherent mucus hydrogel, we imaged two representative test solutions: (A) 13% (wt/vol) PEG 6k spiked with 0.5 mg/mL FITC-PEG 5k and (B) 3% (wt/vol) PEG 200k spiked with 0.6 mg/mL FITC-PEG 200k. Consistent with our expectation, in both cases the polymer penetrated through the adherent mucus hydrogel and reached the underlying epithelium. Traces show the spatial variation of the x-averaged probes fluorescence intensity for the region indicated by the dashed black box. The probes (magenta) diffused through the mucus and reached the underlying epithelium (green). The probes were imaged using confocal fluorescence microscopy and the epithelium was imaged using confocal reflectance microscopy. The adherent mucus hydrogel overlies the epithelium in the direction of increasing z above the epithelium; solid and dashed white lines show the average and maximal positions of the top of the mucus, measured using 1-μm microparticles. (Scale bars, 30 μm.)
Fig. S7.
Fig. S7.
Fluorescence profiles of test solutions deposited on mucus hydrogel, before and after washing. We expect that the carboxyl groups on the mucin sialic acid residues were negatively charged in our experiments (pH ∼7), and therefore complexation between the added PEG and the mucins is minimal. Moreover, we took care not to expose PEG solutions to light and keep them at low temperatures when not in use, to minimize oxidation. To confirm that labeled PEG molecules were not chemically cross-linked to the mucus hydrogel as they diffused through the hydrogel, we performed four sets of fluorescence measurements, using as test solutions (A) 5 μM fluorescein, (B) 15 μM FITC-PEG 350, (C) 6 μM FITC-PEG 5k, and (D) 15 μM FITC-PEG 350 in 60% (wt/vol) PEG 400. Four different explants were incubated with 1-μm microparticles for >1 h then imaged using confocal reflectance (to identify epithelial surface and microparticles on mucus) and confocal fluorescence (to quantify fluorescence of deposited test solution). Curves show fluorescence profiles of test solutions: horizontal axis shows measured fluorescence, averaged over a 450-μm × 450-μm xy field of view, and the vertical axis shows z position. Green and magenta arrows show average positions of epithelial surface and probes deposited on the mucus hydrogel surface. We first used PBS as the test solution to provide a measure of background fluorescence (blue curves). We then deposited dyed test solution on the mucus (orange curves). We then washed the explant with saline (green curves). Fluorescence profiles returned to background levels after washing, suggesting that strong chemical interactions (such as covalent reactions) between the labeled PEG and the mucus hydrogel do not occur. We used the same gain settings before and after.
Fig. S8.
Fig. S8.
Optical properties of polymer solutions do not appreciably affect z measurements. (A) Schematic showing setup of control experiments, measuring separation between two parallel glass plates using the same confocal reflectance microscopy approach. The test solution infiltrated the open gap between the two plates. (B) We first quantified separation using PBS as the test solution filling the space between the two plates, and then used either 10% (wt/vol) PEG 200k (test case 1), or 60% (wt/vol) PEG 400 (test case 2) as the test solution. Introduction of the polymer solution did not change the measured z separation appreciably, indicating that optical effects due to the presence of the polymer solution did not significantly affect the z measurements.
Fig. 3.
Fig. 3.
Tunable compression of colonic mucus hydrogel can be qualitatively described by Flory–Huggins theory. (A) Theoretically predicted and (B) experimentally measured (using 1-μm microparticles) mucus compression for varying polymer concentrations and molecular weights. Bold curves in A show model results for parameter values (SI Materials and Methods) χSM = 0 and χMP = 0.3; less opaque and dashed curves show sensitivity to variations in these parameters (upper and lower less opaque curves, χSM = 0.1 and −0.1; upper and lower dashed curves, χMP = 0.2 and 0.4). All mice, except for those indicated by upward triangles, were male. Symbols in B indicate different mouse types and experimental conditions: squares, C57BL/6 mice; circles, BALB/c mice; upward triangles, female C57BL/6 mice; vertical diamond, washed explants from GF mice; downward triangles, all solutions have added 2× Roche protease inhibitor mixture; pentagons, all solutions have added 5 mM MgSO4; horizontal diamonds, experiments performed at 37 °C instead of 22 °C using a heated microscope stage; stars, polyacrylic acid of ∼8-kDa average molecular weight instead of PEG; hexagons, Hepes buffer instead of PBS for all solutions. Each data point represents the mean of a series of five measurements on a single explant; error bars represent measurement uncertainty. (C) Schematic showing one effect potentially underlying mucus compression: molecular weight-dependent partitioning of the polymer.
Fig. S9.
Fig. S9.
Sensitivity of model predictions to variations in numerical parameters. Each panel shows numerical calculations (Materials and Methods) of the mucus hydrogel compression for different concentrations of PEG 400 (orange), 6k (blue), and 200k (green). Note that due to the constraint derived in the initial polymer-free case, some of the parameters are coupled and cannot be varied independently. (A) ν0M values are varied and corresponding values of NM are adjusted to satisfy the initial polymer-free constraint. Light, solid traces correspond to ν0M = 0.07 and NM = 628, and light, dashed traces correspond to ν0M = 0.35 and NM = 2,026. Note the overlap between the solid and dashed traces. (B) χSM values are varied and corresponding values of NM are adjusted to satisfy the initial polymer-free constraint. Light, solid traces correspond to χSM = −0.2 and NM = 715, and light, dashed traces correspond to χSM = 0.45 and NM = 9,425. Upper and lower less opaque curves in Fig. 2A, which correspond to χSM = 0.1 and −0.1, were characterized by NM = 1,247 and NM = 833. (C) The number of Kuhn segments y for each PEG molecule is varied. Light, solid traces correspond to y = 1, 2, and 76, and light, dashed traces correspond to y = 1, 11, and 611 for PEG 400, 6k, and 200k, respectively. (D) χMP is varied. Light, solid traces correspond to χMP = 0 and light, dashed traces correspond to χMP = 0.5. In each panel, the dark solid traces are the simulations presented in Fig. 2A. In all cases, we observed similar trends of compression with polymer concentration and molecular weight as in the experiments. (E) Numerical calculations showing the partitioning between the hydrogel and solution phase for PEG 400 (orange), 6k (blue), and 200k (green). The ratio of PEG inside and outside the hydrogel (νPin/ϕ, denoted “Partitioning”) is plotted against the PEG concentration outside the hydrogel. Consistent with our expectation, the higher-molecular-weight polymer is more likely to be excluded from the mucus hydrogel.
Fig. 4.
Fig. 4.
Gut microbes can modulate mucus compression by modifying the polymeric composition of intestinal contents. (A) Mucus compression induced by dietary polymers, determined using the ex vivo microparticle method. Each data point represents the mean of a series of five measurements on a single explant; error bars represent measurement uncertainty. (Inset) Data for pectin and pullulan with semilogarithmic axes. (B and C) Mucus (B) thickness or (C) compression measurements determined using (purple) ex vivo microparticle method or (gray) FC oil method, for explants from SPF or GF mice. Last bar in B shows measurements for washed GF explants. Data are presented as means ± SEM. We also found using our ex vivo method that SPF contents only compressed mucus on a GF explant by 5 ± 2% (n = 1). (D) Schematic depicting how microbial degradation of polymers alters mucus compression.
Fig. S10.
Fig. S10.
Gel permeation chromatography of luminal contents from SPF and GF mice. We used an Agilent 1100 HPLC with a binary pump and autosampler, which was connected to a Tosoh TSKgel G3000SWxl column equilibrated with 1× PBS, pH 7.4, flow rate 0.7 mL/min. For detection of the polymers, a Wyatt DAWN HELEOS light scattering instrument with a Wyatt Optilab Rex refractive index detector was used. Detected peaks were analyzed using ASTRA V software. For the pullulan standards, the Agilent PL 2090-0101 Pullulan polysaccharide calibration kit (Agilent) was used. An injection volume of 50 μL was used for each. All samples were prepared in 1× PBS and run through a sterile syringe filter (polyvinylidene fluoride, 13-mm diameter, pore size of 0.22 μm; Fisherbrand) before injection. For luminal contents, on the day of the experiment, frozen liquid fractions were warmed to room temperature for 10–20 min then diluted twofold with 1× PBS. Samples were centrifuged at 12,000 × g at 4 °C for 2 h in sterile centrifugal filters (polyvinylidene fluoride, pore size 0.22 μm; EMD Millipore). After centrifugation, samples were allowed to equilibrate to room temperature for 30 min before injection. For all liquid fraction samples, an injection volume of 10 μL was used. If multiple runs were performed on the same sample, the remaining sample volume was stored at 4 °C until prior runs were complete. (A) Chromatograms of luminal contents from four 3-mo-old SPF males (purple) and two male and one female, 4-mo-old GF (green) mice. Differential refractive index (dRI) is plotted against time (minutes). Both runs were run on the same day. (B) Chromatograms of luminal contents of GF mice (green) and pullulan standards (gray). dRI is plotted against time (minutes). Concentrations and peak average molecular weights of the standards used were (i) 5 mg/mL 180 Da, (ii) 8 mg/mL 667 Da, (iii) 4 mg/mL 6,100 Da, (iv) 4 mg/mL 9,600 Da, (v) 1 mg/mL 47,100 Da, (vi) 1 mg/mL 107,000 Da, (vii) 1 mg/mL 194,000 Da, 344,000 Da, and 708,000 Da.

References

    1. Macfarlane S, Macfarlane GT, Cummings JH. Review article: Prebiotics in the gastrointestinal tract. Aliment Pharmacol Ther. 2006;24(5):701–714. - PubMed
    1. Hooper LV, Midtvedt T, Gordon JI. How host-microbial interactions shape the nutrient environment of the mammalian intestine. Annu Rev Nutr. 2002;22:283–307. - PubMed
    1. DiPalma JA, DeRidder PH, Orlando RC, Kolts BE, Cleveland MB. A randomized, placebo-controlled, multicenter study of the safety and efficacy of a new polyethylene glycol laxative. Am J Gastroenterol. 2000;95(2):446–450. - PubMed
    1. DiPalma JA, Brady CE., 3rd Colon cleansing for diagnostic and surgical procedures: Polyethylene glycol-electrolyte lavage solution. Am J Gastroenterol. 1989;84(9):1008–1016. - PubMed
    1. Wu L, et al. High-molecular-weight polyethylene glycol prevents lethal sepsis due to intestinal Pseudomonas aeruginosa. Gastroenterology. 2004;126(2):488–498. - PubMed

Publication types

Substances