. 2016 Jun 28;113(26):E3716-24.
doi: 10.1073/pnas.1600567113. Epub 2016 Jun 14.

Conserved 33-kb haplotype in the MHC class III region regulates chronic arthritis

Affiliations

Conserved 33-kb haplotype in the MHC class III region regulates chronic arthritis

Anthony C Y Yau et al. Proc Natl Acad Sci U S A. .

Abstract

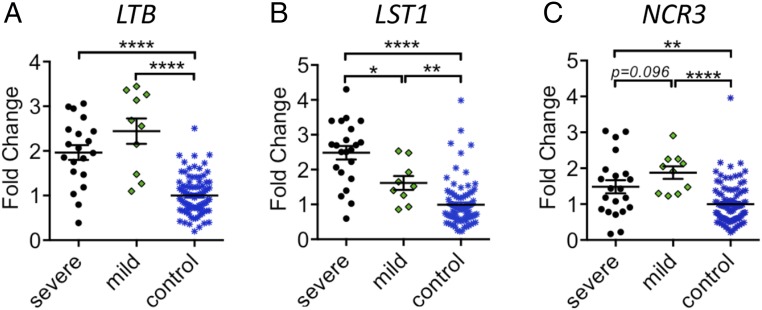
Genome-wide association studies have revealed many genetic loci associated with complex autoimmune diseases. In rheumatoid arthritis (RA), the MHC gene HLA-DRB1 is the strongest candidate predicting disease development. It has been suggested that other immune-regulating genes in the MHC contribute to the disease risk, but this contribution has been difficult to show because of the strong linkage disequilibrium within the MHC. We isolated genomic regions in the form of congenic fragments in rats to test whether there are additional susceptibility loci in the MHC. By both congenic mapping in inbred strains and SNP typing in wild rats, we identified a conserved, 33-kb large haplotype Ltab-Ncr3 in the MHC-III region, which regulates the onset, severity, and chronicity of arthritis. The Ltab-Ncr3 haplotype consists of five polymorphic immunoregulatory genes: Lta (lymphotoxin-α), Tnf, Ltb (lymphotoxin-β), Lst1 (leukocyte-specific transcript 1), and Ncr3 (natural cytotoxicity-triggering receptor 3). Significant correlation in the expression of the Ltab-Ncr3 genes suggests that interaction of these genes may be important in keeping these genes clustered together as a conserved haplotype. We studied the arthritis association and the spliceo-transcriptome of four different Ltab-Ncr3 haplotypes and showed that higher Ltb and Ncr3 expression, lower Lst1 expression, and the expression of a shorter splice variant of Lst1 correlate with reduced arthritis severity in rats. Interestingly, patients with mild RA also showed higher NCR3 expression and lower LST1 expression than patients with severe RA. These data demonstrate the importance of a conserved haplotype in the regulation of complex diseases such as arthritis.

Keywords: arthritis; congenic mapping; haplotype; inflammation; major histocompatibility complex.


Conflict of interest statement

The authors declare no conflict of interest.

Figures

Fig. 1.
Fig. 1.
Overview of the genetic mapping of MHC recombinant strains of haplotypes RT1h, RT1u, and RT1f based on the University of California, Santa Cruz (UCSC) Genomic Browser 2004 (Baylor 3.4/rn4) assembly. Genes are depicted at the corresponding position (in megabases) at the top of the figure. The overall organization of class Ia, II, III, and Ib regions is adopted from a previous study (48). Congenic strains are depicted as horizontal bars with horizontal lines indicating intervals of unknown genotype. Congenic fragments with an asterisk exhibit a protective disease phenotype in PIA. The prefixes “HR,” “UR,” and “FR” indicate that the congenic fragments originate from DA.1H (RT1h haplotype), DA.1U (RT1u haplotype), and DA.1F (RT1f haplotype), respectively (Materials and Methods). PIA has been previously reported in DA.1HR2, DA.1HR61, DA.1HR62, DA.1HR83, DA.1FR2, DA.1FR9, and DA.1UR2 rats (21, 22). The MHC arthritis QTLs Ltab-Ncr3 and RT1-B (previously identified) (21), are shaded in brown.
Fig. 2.
Fig. 2.
The Ltab-Ncr3 region regulates onset, severity, and chronicity of PIA. Development of PIA in DA.1HR2 (n = 13), DA.1HR61 (n = 12), DA.1HR56D (n = 15), and DA (n = 14) rats with mean arthritis score (A), disease incidence (B), day of disease onset (C), percentage of weight change from day 9 to day 20 after pristane immunization (D), and percentage of weight change from day 79 to day 212 after pristane immunization (E). (F) Comparison of serum AGP levels in DA.1HR56D and DA rats on day 21 after pristane immunization. (G) Mean arthritis score of recipient rats after transfer of pristane-primed T cells from DA.1HR56D (n = 12) and DA (n = 10) donor rats. (H) Mean arthritis score of DA.1HR56 (n = 11) and DA (n = 9) rats after transfer of pristane-primed T cells from DA rats. (G and H) Lymph node cells were harvested from rats 8 d after pristane immunization. Data shown in A, G, and H are mean ± SEM; horizontal lines in CF represent mean values. (A and B) An asterisk denotes a significant difference between DA.1HR56D and DA; a plus sign denotes a significant difference between DA.1HR61 and DA; a carat denotes a significant difference between DA.1HR2 and DA. (AH) One symbol indicates P < 0.05; two symbols, P < 0.01; three symbols, P < 0.001 compared with DA, unless otherwise specified. Disease incidence was evaluated by Fisher’s exact test. Other statistics were determined with the Mann–Whitney U test.
Fig. S1.
Fig. S1.
Pristane-primed DA.1HR56D T cells expressed lower levels of activation markers, secreted lower levels of IFN-γ, and transferred milder arthritis compared with DA T cells. (AD) Draining lymph nodes of DA.1HR56D (n = 10) and DA (n = 10) rats were harvested on day 8 after pristane immunization. The frequency of CD25 (A) and CD134 (B) and the mean fluorescence intensity (MFI) of CD27 (C) on gated CD4+ αβT cells was determined by flow cytometry. (D) The level of cytokine IFN-γ (in relative florescence units, RFU) in the supernatant after ConA stimulation for 65 h was determined by ELISA. (E) Lymph node cells were harvested from rats 5 d after pristane immunization. Shown are the mean arthritis score of recipient rats after receiving pristane-primed T cells from DA.1HR56D (n = 9) and DA (n = 12) donor rats. Data are presented as mean ± SEM; *P < 0.05; **P < 0.01; ***P < 0.001 compared with DA. Statistics were determined with the Mann–Whitney U test.
Fig. S2.
Fig. S2.
Recombination frequency in the rat MHC-III region. Recombination activity was assessed over 900 Kb (3.6–4.5 Mb). The width of the bars represents recombination intervals. The height of the bars indicates recombination frequency (%). The area shaded in orange indicates recombination segments identified by sperm recombinants in humans (49). The areas shaded in green indicate HapMap-inferred recombination sites (50) and recombination sites identified in an extended haplotype homozygosity decay study (51) in humans.
Fig. 3.
Fig. 3.
Excluding Tnf polymorphism as a contributor to the DA.1HR56D arthritis protection effect. (A) Level of TNF in whole blood from naive DA.1HR56D (n = 8) and DA (n = 9) rats after LPS stimulation for 18 h. (B) Level of TNF in whole blood from PIA (day 16) DA.1HR56T (n = 12) and DA (n = 15) rats after LPS stimulation for 18 h. (C and D) Level of TNF in the supernatant produced by splenocytes (C) and peritoneal macrophages (D) harvested from naive DA.1HR56D (n = 8) and DA (n = 9) rats after stimulation for 24 h with LPS, zymosan, poly I:C, and ConA. (E) Development of PIA in DA.1HR56D (etanercept: n = 9; control: n = 9) and DA (etanercept: n = 10; control: n = 13) rats treated with etanercept or PBS on days 2, 4, and 6 after pristane immunization. All data are represented as mean ± SEM; *P < 0.05 (DA.1HR56D) and ***P < 0.001 (DA) comparing cumulative disease scores of the treatment group vs. the control group. Statistics were determined with the Mann–Whitney U test.
Fig. S3.
Fig. S3.
Excluding Tnf polymorphism as a contributor to the haplotype disease effect. (A) Gene expression of Tnf in naive inguinal lymph nodes from DA.1HR56D and DA rats. (B) Gene expression of Tnf in different cell populations [B cells, CD4+ T cells, CD8+ T cells, and CD11b/c+ cells (SI Materials and Methods)] in inguinal lymph nodes isolated from DA.1R56D and DA rats 5 d after pristane immunization. (C and D) The level of TNF in the supernatant produced by splenocytes (C) and peritoneal macrophages (D) harvested from naive DA.1HR56D and DA rats after stimulation for 12 h with LPS, zymosan, poly I:C, and ConA. (E and F) The level of TNF in the supernatant produced by splenocytes (E) and peritoneal macrophages (F) from naive DA.1HR56D and DA rats after stimulation for 12 and 24 h with different concentrations of LPS. (G) The level of TNF (in relative florescence units, RFU) in the supernatant measured by ELISA after ConA stimulation of inguinal lymph node cells for 65 h. Inguinal lymph node cells were harvested from DA.1HR56T and DA rats 8 d after pristane immunization. Data are presented as mean ± SEM.
Fig. 4.
Fig. 4.
Ltab-Ncr3 genes are differentially expressed and undergo alternative splicing. Gene expression in lymph nodes from naive DA.1HR56D (n = 17), DA.1UR2A (n = 8), DA.1FR9 (n = 9), and DA (n = 14) rats. (A) Expression of genes Lta, Ltb, Lst1, and Ncr3. (B, Left) Expression of the Lst1 full-length transcript (NM_022634.2) and Lst1 splice variant without exon 2 (XM_006256080.2). (Right) Gel photo illustrating the expression of the Lst1 full-length transcript and Lst1 splice variant without exon 2. (C) Expression of the Ncr3 full-length transcript with separate exon 3 and 4 (NM_181822.2) and the variant with fused exon 3 and 4 (XM_006256054.2). The reference genes Actb, Arbp, and Hmbs were used for normalization. Data are represented as mean ± SEM; *P < 0.05; **P < 0.01; ***P < 0.001; ****P < 0.0001. Statistics were determined with the Mann–Whitney U test.
Fig. S4.
Fig. S4.
Genes in the Ltab-Ncr3 haplotype are differentially expressed and undergo alternative splicing. Gene expression measured in different lymph node cell populations [B cells, CD4+ T cells, CD8+ T cells, and CD11b/c+ cells (SI Materials and Methods)] on day 5 after pristane immunization in DA.1HR56D (n = 8) and DA rats (n = 8). (AD) Expression of genes in the Ltab-Ncr3 region: Lta (A), Ltb (B), Lst1 (C), and Ncr3 (D). (EH) Expression of different isoforms: Lst1 full-length transcript (NM_022634.2) (E), Lst1 splice variant without exon 2 (XM_006256080.2) (F), Ncr3 full-length transcript with separate exons 3 and 4 (NM_181822.2) (G), and Ncr3 variant with fused exons 3 and 4 (XM_006256054.2) (H). *P < 0.05; **P < 0.01, ***P < 0.001 compared with DA. Data are presented as mean ± SEM. Statistics were determined with the Mann–Whitney U test.
Fig. S5.
Fig. S5.
The level of protein expression of LTB (A) and LST1 (B) in the draining lymph nodes of DA.1HR56D (n = 9) and DA (n = 9) rats on day 8 after pristane immunization, shown as mean fluorescence intensity (MFI) determined by flow cytometry. Data are presented as mean ± SEM; **P < 0.01 compared with DA. Statistics were determined with the Mann–Whitney U test.
Fig. S6.
Fig. S6.
The development of PIA with NK cell depletion in DA.1HR56D (n = 8) and DA (n = 8) rats shown as (A) mean arthritis score ± SEM (*P < 0.05; **P < 0.01 comparing cumulative disease scores of the NK cell-depletion group vs. the control group) and (B) percentage of weight change from day 9 to day 20 (**P < 0.01 comparing weight change in the NK cell-depletion group: DA.1HR56D vs. DA). Statistics were determined with the Mann–Whitney U test.
Fig. 5.
Fig. 5.
Ltab-Ncr3 gene expressions are significantly and positively correlated. Pink circles, purple triangles, and filled black circles denote Ltab-Ncr3 gene expression of DA.1UR2A, DA.1FR9, and DA rats, respectively. (A) Correlation analysis of Lta and Lst1 gene expression. (B) Correlation analysis of Tnf and Ltb gene expression. (C) Correlation analysis of Lst1 and Ncr3 gene expression. In AC each dot represents the fold-change of the corresponding genes of each individual rat (n = 31). Spearman’s correlation coefficient ρ and the P value for each gene pair are indicated in each figure. Reference genes Actb, Arbp, and Hmbs were used as controls for normalization to calculate the fold-change. (D) Summary of correlation showing Spearman’s correlation coefficient ρ between different Ltab-Ncr3 genes. *P < 0.05; **P < 0.01; ***P < 0.001; ****P < 0.0001.
Fig. 6.
Fig. 6.
The level of expression of genes LTB (A), LST1 (B), and NCR3 (C) in patients with mild RA (DAS28 ≤ 3.2, n = 10) and severe RA (DAS28 > 5.1, n = 22) and in healthy controls (n = 92). The reference gene ZNF592 was used for normalization. Data are represented as mean ± SEM; *P < 0.05; **P < 0.01; ***P < 0.001; ****P < 0.0001 for comparison between groups. Statistics were determined with the Mann–Whitney U test.

Comment in

References

    1. Cho JH, Feldman M. Heterogeneity of autoimmune diseases: Pathophysiologic insights from genetics and implications for new therapies. Nat Med. 2015;21(7):730–738. - PMC - PubMed
    1. Seldin MF. The genetics of human autoimmune disease: A perspective on progress in the field and future directions. J Autoimmun. 2015;64:1–12. - PMC - PubMed
    1. Okada Y, et al. RACI consortium GARNET consortium Genetics of rheumatoid arthritis contributes to biology and drug discovery. Nature. 2014;506(7488):376–381. - PMC - PubMed
    1. Messemaker TC, Huizinga TW, Kurreeman F. Immunogenetics of rheumatoid arthritis: Understanding functional implications. J Autoimmun. 2015;64:74–81. - PubMed
    1. Raychaudhuri S, et al. Five amino acids in three HLA proteins explain most of the association between MHC and seropositive rheumatoid arthritis. Nat Genet. 2012;44(3):291–296. - PMC - PubMed

Publication types

MeSH terms

Substances