. 2016 May 26:7:780.
doi: 10.3389/fmicb.2016.00780. eCollection 2016.

Phenotypic Plasticity Regulates Candida albicans Interactions and Virulence in the Vertebrate Host

Affiliations

Phenotypic Plasticity Regulates Candida albicans Interactions and Virulence in the Vertebrate Host

Emily M Mallick et al. Front Microbiol. .

Abstract

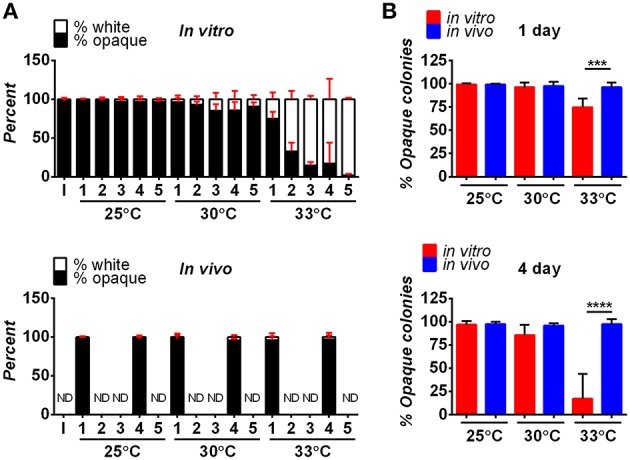
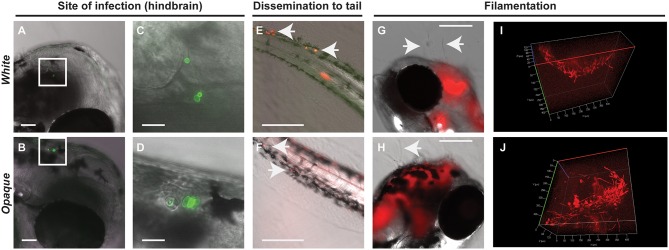
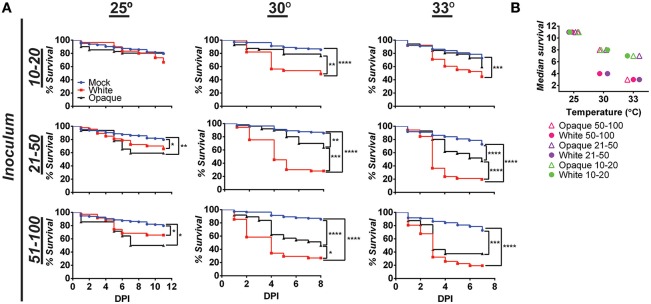
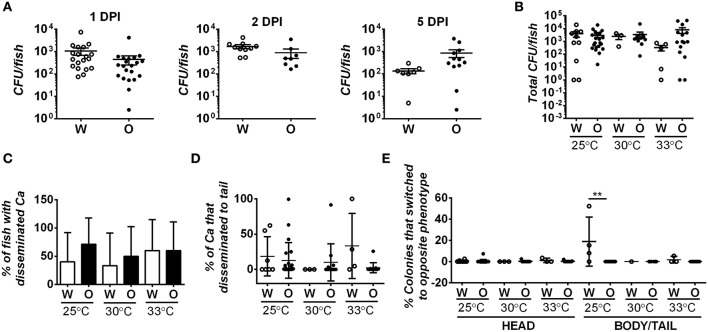
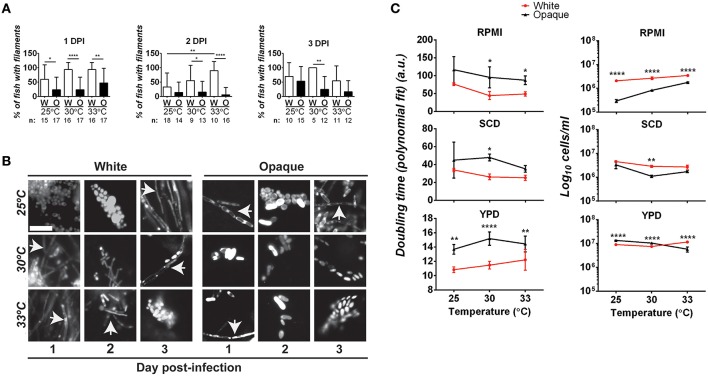
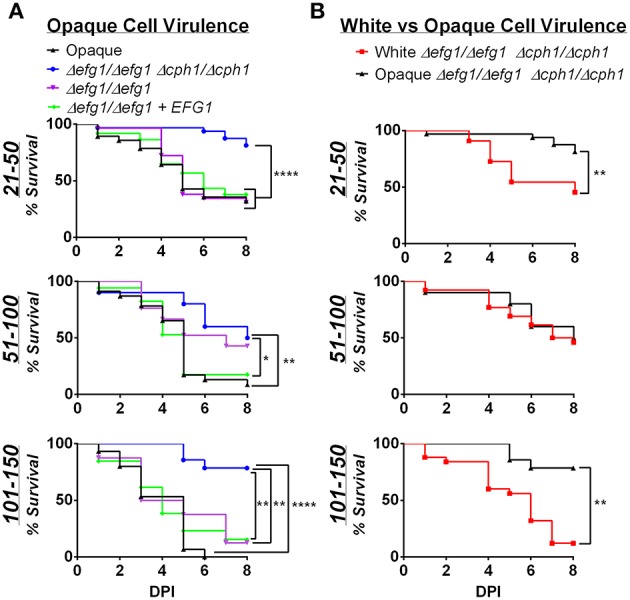
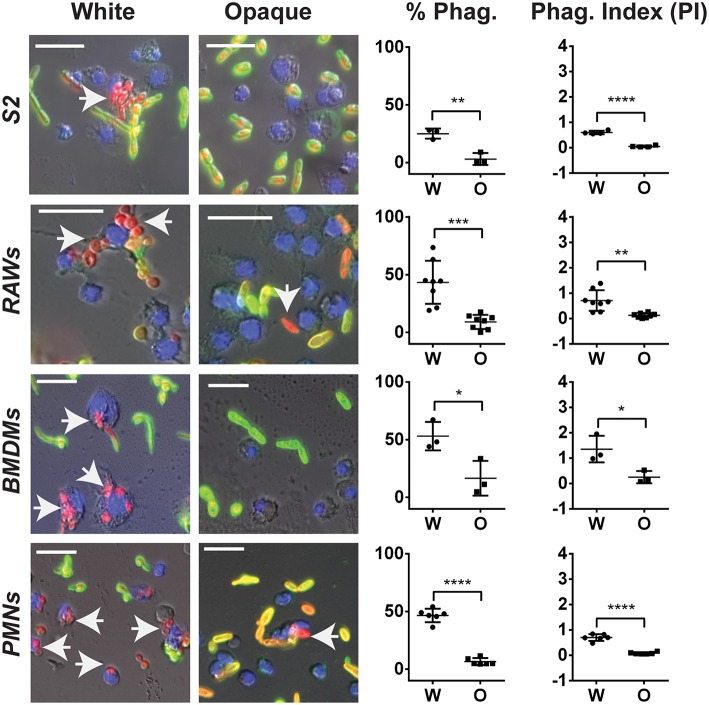
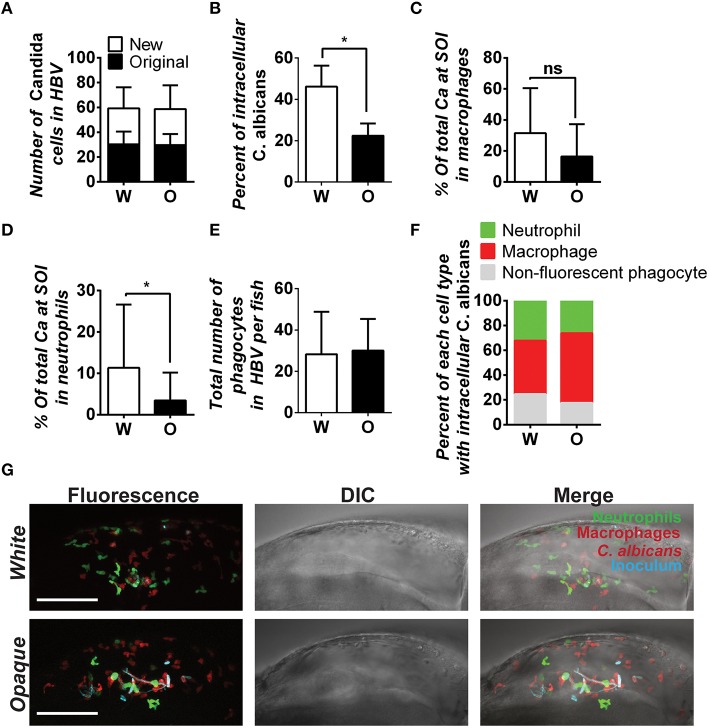
Phenotypic diversity is critical to the lifestyles of many microbial species, enabling rapid responses to changes in environmental conditions. In the human fungal pathogen Candida albicans, cells exhibit heritable switching between two phenotypic states, white and opaque, which yield differences in mating, filamentous growth, and interactions with immune cells in vitro. Here, we address the in vivo virulence properties of the two cell states in a zebrafish model of infection. Multiple attributes were compared including the stability of phenotypic states, filamentation, virulence, dissemination, and phagocytosis by immune cells, and phenotypes equated across three different host temperatures. Importantly, we found that both white and opaque cells could establish a lethal systemic infection. The relative virulence of the two cell types was temperature dependent; virulence was similar at 25°C, but at higher temperatures (30 and 33°C) white cells were significantly more virulent than opaque cells. Despite the difference in virulence, fungal burden, and dissemination were similar between cells in the two states. Additionally, both white and opaque cells exhibited robust filamentation during infection and blocking filamentation resulted in decreased virulence, establishing that this program is critical for pathogenesis in both cell states. Interactions between C. albicans cells and immune cells differed between white and opaque states. Macrophages and neutrophils preferentially phagocytosed white cells over opaque cells in vitro, and neutrophils showed preferential phagocytosis of white cells in vivo. Together, these studies distinguish the properties of white and opaque cells in a vertebrate host, and establish that the two cell types demonstrate both important similarities and key differences during infection.

Keywords: C. albicans; opaque; temperature; virulence; zebrafish model.


Figures

Figure 1
Figure 1
Stability of opaque cells in vitro and in vivo. (A) Opaque cells (CAY5202) were cultured in vitro (top panel) or in zebrafish larvae in vivo (bottom panel) at the indicated temperatures. For the in vitro experiment, cultures were grown in SCD medium at the indicated temperature, and diluted back daily into fresh SCD medium. Each day, ~100 cells were plated onto SCD and the fraction of white and opaque colonies was determined. Shown are the mean percentages of white and opaque colonies of 6 biological replicates at each time point for each temperature. For in vivo experiments, larvae were infected with 5–50 CFU of one of six different biological replicates of CAY5202 and housed at 25, 30, or 33°C. At 1 and 4 days post-infection, individual fish were homogenized and serial dilutions were plated onto SCD to determine the fraction of white and opaque cells present. Shown are the mean percentages of white and opaque colonies at each time point for each temperature ± SD. ND, not determined; I, initial inoculum. (B) Comparison of the stability of opaque cells in vitro and in vivo at 1 and 4 days. Shown are the mean percentages of opaque cells ± SD. Data are a compilation of two independent experiments using 6 biological replicates at each time point for each temperature. Statistically significant differences were determined using a Student's t-test. ***p < 0.001; ****p < 0.0001.
Figure 2
Figure 2
Both white and opaque phenotypic states of C. albicans infect, disseminate, and are induced to undergo filamentation in vivo. (A) Hindbrain of wild type zebrafish in the infected with 8 C. albicans white cells (CAY4975) pre-stained with AlexaFluor-488 (see Methods) at 30 min post-injection. Magnification, 10 ×; scale bar, 50 μm. White box indicates C. albicans cells in the hindbrain and this area is shown at higher magnification in (C). (B) Hindbrain of wild type zebrafish infected with 12 C. albicans opaque cells (CAY4986) pre-stained with AlexaFluor-488 (see Methods) at 30 min post-infection. Magnification, 10 ×; scale bar, 50 μm. White box indicates C. albicans cells present in the hindbrain shown at higher magnification in (D). (C) Higher magnification of white box in (A). Magnification, 40 ×; scale bar, 20 μm. (D) Higher magnification of white box in (B). Magnification, 40 ×; scale bar, 20 μm. (E) Wild type zebrafish were infected with >200 C. albicans white cells expressing a dTomato reporter (CAY4975) and kept at 25°C. Shown are C. albicans cells that have disseminated to the tail (see arrows) at 2 days post-infection. Magnification, 10 ×. Scale bar, 200 μm. (F) Wild type zebrafish were infected with 50 opaque C. albicans cells expressing dTomato (CAY4986) and kept at 25°C. Shown are C. albicans cells that have disseminated to the tail (see arrows) at 1 day post-infection. Magnification, 10 ×; scale bar, 200 μm. (G) 10 × image of wild type zebrafish infected with 25 C. albicans white cells expressing a dTomato reporter (CAY4975) at 9 days post-infection. Arrows indicate fungal filaments penetrating out of the fish's head. Scale bar, 200 μm. (H) 10 × image of wild type zebrafish infected with 100 C. albicans opaque cells expressing a dTomato reporter (CAY4986) and stained with AlexaFluor-488 at 5 days post-infection. Arrow indicates filamentation out of the fish's head. Scale bar, 200 μm. (I) Confocal microscopy of zebrafish infected with C. albicans white cells (CAY4975) expressing a dTomato reporter at 1 day post-infection and exhibiting filamentation. Magnification, 20 ×. (J) Confocal microscopy of zebrafish infected with C. albicans opaque cells expressing a dTomato reporter (CAY4986) at 1 day post-infection and exhibiting filamentation. Magnification, 20 ×.
Figure 3
Figure 3
White cells are more virulent than opaque cells at higher temperatures. (A) Wild type zebrafish larvae were infected with C. albicans white cells (CAY4975), opaque cells (CAY4986), or mock infected. Embryos were kept at the indicated temperature after infection and monitored daily for survival. Data are a compilation of 11, 8, and 7 independent experiments for 25, 30, and 33°C, respectively. N = 14–235 fish/group for each inoculation interval. Statistically significant differences were determined using a Log rank (Mantel-Cox) test. *p < 0.05; **p < 0.01; ***p < 0.001; ****p < 0.0001. (B) Median survival (time to 50% survival or endpoint of experiment) was compared for fish infected with the indicated inoculums of C. albicans white or opaque cells housed at 25, 30, and 33°C.
Figure 4
Figure 4
Fungal burden and degree of dissemination is similar in zebrafish infected with white or opaque cells. For these experiments zebrafish were injected with 21–50 C. albicans white cells (W) or opaque cells (O) (strains CAY4975 and CAY4986, respectively). Data are a compilation of nine individual experiments. (A) Fish were housed at 30°C and homogenized at 1, 2, or 5 days post-infection (DPI). Fungal burdens were determined by plating for colony forming units (CFUs). Each dot represents an individual fish and shown are the mean CFUs ± SEM. A Student's t-test was performed and no significant differences were present between white- and opaque-infected fish. (B) White- and opaque-infected zebrafish were housed at 25, 30, or 33°C. At 2 days post-infection fish were euthanized and heads were dissected from bodies/tails. Serial dilutions of each segment were separately plated for CFUs. Plotted are the mean CFU per fish (head and body/tail segments combined) ± SEM. (C) To determine the degree of C. albicans (Ca) dissemination, white- and opaque-infected zebrafish were euthanized and fish dissected into two segments (head and body/tail). Serial dilutions of both segments were plated for CFUs, and if cells were present in the body/tail then fish were scored as exhibiting dissemination. Error bars represent SD. (D) White- and opaque-infected zebrafish were analyzed at 2 days post-infection at each of the three indicated temperatures. Fish were euthanized and heads were dissected from bodies/tails. Serial dilutions of these segments were plated for CFUs and the percentage of C. albicans cells that had disseminated into the body/tail compared to that present in the head segment. Plotted are the mean percentages of disseminated C. albicans cells ± SD. (E) Two days post-infection fish were euthanized and heads were dissected from bodies/tails. Serial dilutions of each segment were plated to determine the phenotypic state of each cell. Those that had switched from the parental white (W) or opaque (O) state to the opposite phenotypic state are shown for both head and body/tail segments. Data is the mean ± SD. **p < 0.01.
Figure 5
Figure 5
Comparative analysis of filamentation and growth rates in white and opaque C. albicans cells. (A) Zebrafish larvae were infected with 21–50 AlexaFluor-568 stained C. albicans white (W) or opaque (O) cells expressing dTomato and housed at the indicated temperature after infection. At 1, 2, and 3 days post-infection (DPI) live fish were crushed (see Methods) and assessed for the presence of filaments microscopically. “n” indicates the number of fish examined for each experiment. Shown are the mean percentages of fish containing filamentous C. albicans cells ± SD. *p < 0.05; **p < 0.01; ****p < 0.0001. Data are a compilation of five independent experiments. (B) Representative microscopic images of the fish assessed in (A). Arrows indicate filaments/hyphae. Magnification, 40 ×; scale bar, 20 μm. (C) C. albicans white (CAY4975) and opaque (CAY4986) cells were grown in 96-well plates in YPD, SCD, or RPMI media at 25, 30, or 33°C. Cell growth was analyzed using a Biotek Synergy HT plate reader for 24 h. OD600 was measured at 15 min intervals. Data were analyzed using a previously described Matlab script. Shown are the average Log10 cells/ml at saturation ± SD for white and opaque cells at the designated temperature. Data is representative of 3–4 biological replicates each done in triplicate. Statistically significant differences were determined by two-way ANOVA and Sidak's Multiple Comparisons test. *p < 0.05; **p < 0.01; ***p < 0.001; ****p < 0.0001.
Figure 6
Figure 6
Virulence is reduced in filamentation-deficient white and opaque cells. Zebrafish larvae were infected with the indicated number of C. albicans cells and kept at 30°C. (A) shows survival data comparing infection with different opaque strains. CAY4986 (control opaque), CAY1579 (opaque Δefg1/Δefg1 Δcph1/Δcph1), CAY3292 (opaque Δefg1/Δefg1), and CAY4384 (opaque Δefg1/Δefg1 + EFG1). (B) compares the virulence of a white Δefg1/Δefg1 Δcph1/Δcph1 strain (CAY6597) with that of the equivalent opaque strain (CAY1579). Note that the survival curves for the CAY1579 strain are the same for both (A,B). 8–37 fish were infected for each group in each inoculum range. Data are pooled from 7 individual experiments. Statistically significant differences were determined by Log rank test. *p < 0.05; **p < 0.01; ****p < 0.0001.
Figure 7
Figure 7
C. albicans white cells are phagocytosed more efficiently than opaque cells by macrophages in vitro. The indicated immune cell type was incubated with C. albicans white (CAY4975) or opaque (CAY4986) cells for 30 min to 2 h (see Methods) at 28°C (S2 cells) or 37°C (RAWs, BMDMs, and PMNs) and imaged by fluorescence microscopy. Blue (Hoechst) staining represents macrophage nuclei, internalized C. albicans appear red (dTomato label), and extracellular C. albicans are stained both green (using an anti-C. albicans antibody) and red. Arrows point to phagocytosed cells. The percent phagocytosis (total number of macrophages that have phagocytosed ≥ 1 C. albicans cell divided by the total number of macrophages scored) and phagocytic index (PI) (total number of C. albicans cells phagocytosed divided by the total macrophages scored) were quantified for both white (W) and opaque (O) cells. Data is represented as the mean ± SD and each dot represents a single biological replicate that was assayed in triplicate. At least 100 macrophages were quantified per assay. A Student's t-test was performed to determine statistically significant differences between the two groups. *p < 0.05; **p < 0.01; ***p < 0.001; and ****p < 0.0001. Arrows represent internalized C. albicans. Scale bars, 20 μm.
Figure 8
Figure 8
C. albicans white cells are phagocytosed more efficiently than opaque cells in vivo. AlexaFluor-647 stained white or opaque cells expressing dTomato (CAY4975 and CAY4986, respectively) were microinjected into the hindbrain ventricle of transgenic fish that contain EGFP-expressing neutrophils and mCherry-expressing macrophages. Larvae were screened post-injection to identify those with 20–50 C. albicans cells at the site of injection and subsequently imaged 4 h post-injection via confocal microscopy. (A) The number of C. albicans cells present in the hindbrain ventricle (HBV) after microinjection (AlexaFluor 647-labeled cells) and the number of C. albicans cells present 4 h post-injection (cells displaying cytosolic dTomato fluorescence) ± SD. (B) The percentage of C. albicans cells inside vs. outside phagocytes at the site of infection was calculated for each fish (see Methods). Shown are the average percentages of intracellular cells ± SEM. Statistically significant differences were determined using a Student's T-test. *p < 0.05. (C) Mean percentages of C. albicans cells present in zebrafish macrophages at the site of infection (SOI) ± SD. Statistically significant differences determined using a Student's T-test. ns, not significant. (D) Mean percentages of C. albicans cells present in neutrophils at the site of infection ± SD. Statistically significant differences determined using a Student's T-test. *p < 0.05. (E) Total number of phagocytes (neutrophils, macrophages, and non-fluorescent phagocytes) recruited to the site of infection for each fish. Shown are mean numbers of phagocytes in the HBV per fish ± SD. (F) Breakdown of phagocyte subtypes with intracellular C. albicans cells at the site of infection. (G) Confocal images of representative fish in white and opaque cell cohorts. Maximum projections made from Z-stacks with 39 slices and 23 slices for white and opaque cells, respectively. Scale bar, 100 μm. Data were collected over 9 independent experiments with 14 and 22 individual fish in the white and opaque cohorts, respectively.

References

    1. Abbey D., Hickman M., Gresham D., Berman J. (2011). High-resolution SNP/CGH microarrays reveal the accumulation of loss of heterozygosity in commonly used Candida albicans strains G3 1, 523–530. 10.1534/g3.111.000885 - DOI - PMC - PubMed
    1. Alby K., Bennett R. J. (2009). Stress-induced phenotypic switching in Candida albicans. Mol. Biol. Cell 20, 3178–3191. 10.1091/mbc.E09-01-0040 - DOI - PMC - PubMed
    1. Aubry C., Corr S. C., Wienerroither S., Goulard C., Jones R., Cossart P., et al. (2012). Both TLR2 and TRIF contribute to interferon-beta production during Listeria infection. PLoS ONE 7:e33299. 10.1371/journal.pone.0033299 - DOI - PMC - PubMed
    1. Bennett R. J., Johnson A. D. (2006). The role of nutrient regulation and the Gpa2 protein in the mating pheromone response of Candida albicans. Mol. Microbiol. 62, 100–119. 10.1111/j.1365-2958.2006.05367.x - DOI - PubMed
    1. Braun B. R., Johnson A. D. (2000). TUP1, CPH1 and EFG1 make independent contributions to filamentation in Candida albicans. Genetics 155, 57–67. - PMC - PubMed

LinkOut - more resources