Review
. 2016 May 31:7:94.
doi: 10.3389/fgene.2016.00094. eCollection 2016.

Logical Modeling and Dynamical Analysis of Cellular Networks

Affiliations
Review

Logical Modeling and Dynamical Analysis of Cellular Networks

Wassim Abou-Jaoudé et al. Front Genet. .

Abstract

The logical (or logic) formalism is increasingly used to model regulatory and signaling networks. Complementing these applications, several groups contributed various methods and tools to support the definition and analysis of logical models. After an introduction to the logical modeling framework and to several of its variants, we review here a number of recent methodological advances to ease the analysis of large and intricate networks. In particular, we survey approaches to determine model attractors and their reachability properties, to assess the dynamical impact of variations of external signals, and to consistently reduce large models. To illustrate these developments, we further consider several published logical models for two important biological processes, namely the differentiation of T helper cells and the control of mammalian cell cycle.

Keywords: T cells activation and differentiation; attractors; cell cycle control; discrete dynamics; logical modeling; reachability analysis; regulatory and signaling networks; simulation.


Figures

Figure 1
Figure 1
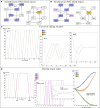
Illustration of the basics of the logical formalism—Model definition. (A) The regulatory graph defines the topology of the regulatory structure, where nodes denote regulatory components and edges represent regulatory effects (activations are denoted by green edges, whereas inhibitions are represented in red). (B,C) The evolution of the variables associated with the regulatory components is defined by the logical functions, which are written in the form of logical formulas or, alternatively, in the form of truth tables. “∧,” “∨,” and “!” stand for the logical operators AND, OR and NOT, respectively. Note that the regulatory graph in (A) can be recovered from the logical functions defined in (B,C), but the reverse is not true (see main text). (D) Hypergraph as an alternative definition of the Boolean model of (A–C) (merged arrows denote AND operator). (E) Example motivating the introduction of a multi-valued variable; here G1 activates G2 and G3 at different thresholds and activates G4 when it is at level 1, but inhibits it at level 2 (see also Supplementary Figure S1).
Figure 2
Figure 2
Illustration of the basics of the logical formalism—Model dynamics. (A) The asynchronous State Transition Graph (STG) of the model defined in Figure 1 (A–C), with the input G4 maintained constant and concurrent transitions from states in which several variables are called to update their values. The yellow state 1101 (i.e., x1 = x2 = x4 = 1 and x3 = 0) is a stable state, the set of states in blue corresponds to a cyclic attractor. (B) The synchronous STG in which variables are simultaneously updated; the stable state is conserved, whereas a new terminal cycle appears (in pink). (C) Synchronous dynamics starting from the state 1000 and maintaining the input constant to 0 (activity levels are given in %, from 0 to 100%). For a sliding window of length w = 1 (see Equation 3), the curves conform the terminal cycle of (B) (in blue), the four variables oscillate between 0 and 1, with a period of 6; for w = 4, the mean values oscillate between 0.25 and 0.75; for w = 6, the mean values are constant to 0.5. (D) Illustration of the effect of different input variations (G4 value). When G4 is active with a probability 0.25, oscillations of the remaining components are altered (only G3 values are displayed, for legibility). The plot on the right shows the effect of varying the probability of G4 activity (from 0 to 1) on the mean values of the remaining components in the long term (i.e., in the attractor).
Figure 3
Figure 3
Regulatory graph of the reduced version of the Th differentiation logical model in Abou-Jaoudé et al. (2015). The reduced model encompasses 46 nodes (among which 21 inputs) instead of 101 nodes in the original one. The components denoting the inputs are in blue, those representing the secreted cytokines in olive. Pink nodes denote transcription factors. Green edges denote activations whereas red blunt ones correspond to inhibitions. Blue edges represent dual interactions.
Figure 4
Figure 4
Reprogramming graph considering the canonical Th subtypes (generated with the model checker NuSMV-ARCTL; adapted from Abou-Jaoudé et al., 2015). Ellipses gather all subtypes that, under the same environmental condition, differentiate toward a particular stable subtype (defined in Table 3 in Abou-Jaoudé et al., 2015). Dashed arrows connect ellipses to a (set of) differentiated state(s) and are labeled with the corresponding environmental conditions. Solid arrows denote specific reachability conditions between pairs of subtypes, under a particular environmental condition. Colors of arrows and ellipses indicate the environmental conditions of the corresponding subtype color. For example: from Th2, Th22, Th9, Th0, Treg, and Th17 subtypes (gathered in the pink ellipse), a “proTfh” condition leads to reprogramming into both Tfh (pink node) and Th1 subtypes; while from Th22, a “proTreg” condition leads to reprogramming into both Th17 and Treg subtypes.
Figure 5
Figure 5
Hierarchical Transition Graph (HTG) generated with GINsim considering an asynchronous simulation of the model shown in Figure 3 (Abou-Jaoudé et al., 2015). The bottom nodes correspond to the stable states, which are reachable starting from the initial conditions corresponding to the set of states characterizing Th22 cell type, under a Treg polarizing environment (upper node). The states reachable from the initial conditions, except the stable states, are grouped together into irreversible transient components (in green), the symbol ♯ precedes the number of states composing these nodes. The HTG encompasses 10 nodes (in contrast with the 2528 states of the corresponding STG). The labels associated with the arcs highlight the crucial transitions involved in the choice between the attractors (see Supplementary Figure S1). Each stable state is annotated with the probability in red of being reached from Th22 subtype under the Treg polarizing condition, considering 1000 simulations (computed with the software Avatar). The components are ordered as follows: first the external input cytokines IL1B, IFNG, IL2, IL4, IL6, IL10, IL12, IL15, IL21, IL23, IL27, TGFB, IL36, IL33, IL18, IL25, IFNB, IFNA, IL1A, IL29, followed by the component representing the Antigen Presenting Cells, then the transcription factors TBET, GATA3, RORGT, FOXP3, BCL6, followed by the secreted cytokines IFNG, IL4, IL2, IL10, IL21, IL6, followed by the transcription factors STAT3 and PU1, then the secreted cytokine TGFB, followed by a node denoting the proliferation of Th cells and finally the secreted cytokine IL25.
Figure 6
Figure 6
Examples of dose-response analyses in a signal transduction and gene regulatory model in Cell Collective (adapted from Conroy et al., 2014). (A) Stimulation of filamentous actin polymerization in response to varying levels of cellular interaction with extracellular matrix (ECM). (B) Stimulation of the mitogen-activated protein kinase (MAPK) pathway in response to Cav1 activation. (C) Activation of the MAPK pathway in response to stimulation by antigen-presenting cells (APC).
Figure 7
Figure 7
Regulatory graph of the mammalian cell cycle model (Traynard et al., 2015). The input node, CycD accounts for the positive signal, as Cyclin D is activated by growth factors. All components are Boolean, except Rb and p27 (see Text). Interactions requiring the higher threshold (value 2) or having different effect depending on the threshold value (1/2) are labeled accordingly.
Figure 8
Figure 8
Stochastic trajectories simulated with MaBoSS for each component of the model of Figure 7, with equal rates for all transitions. From top left to bottom right: simulations without perturbation (wild-type); with a perturbation corresponding to the partial mutation RbR661W annihilating the repressing activity of Rb on E2F; Rb loss-of-function; Skp2 loss-of-function; p27 loss-of-function; combination of Skp2 and p27 loss-of-functions (Traynard et al., 2015). Rb_b1 and Rb_b2 are the two Boolean variables used to represent the levels of Rb (0,1, and 2). Similarly, p27_b1 and p27_b2 account for the levels of p27.

References

    1. Abou-Jaoudé W., Monteiro P. T., Naldi A., Grandclaudon M., Soumelis V., Chaouiya C., et al. . (2015). Model checking to assess T-helper cell plasticity. Front. Bioeng. Biotechnol. 2(Suppl. 1):86. 10.3389/fbioe.2014.00086 - DOI - PMC - PubMed
    1. Albert R., Thakar J. (2014). Boolean modeling: a logic-based dynamic approach for understanding signaling and regulatory networks and for making useful predictions. Wiley Interdisc. Rev. Syst. Biol. Med. 6, 353–369. 10.1002/wsbm.1273 - DOI - PubMed
    1. Aldridge B. B., Saez-Rodriguez J., Muhlich J. L., Sorger P. K., Lauffenburger D. A. (2009). Fuzzy logic analysis of kinase pathway crosstalk in tnf/egf/insulin-induced signaling. PLoS Comput. Biol. 5:e1000340. 10.1371/journal.pcbi.1000340 - DOI - PMC - PubMed
    1. Alvarez-Buylla E. R., Chaos A., Aldana M., Benítez M., Cortes-Poza Y., Espinosa-Soto C., et al. . (2008). Floral morphogenesis: stochastic explorations of a gene network epigenetic landscape. PLoS ONE 3:e3626. 10.1371/journal.pone.0003626 - DOI - PMC - PubMed
    1. Antebi Y. E., Reich-Zeliger S., Hart Y., Mayo A., Eizenberg I., Rimer J., et al. . (2013). Mapping differentiation under mixed culture conditions reveals a tunable continuum of T cell fates. PLoS Biol. 11:e1001616. 10.1371/journal.pbio.1001616 - DOI - PMC - PubMed

LinkOut - more resources