. 2016 Jun 14;23(6):1093-1112.
doi: 10.1016/j.cmet.2016.05.027.

Effects of Sex, Strain, and Energy Intake on Hallmarks of Aging in Mice

Affiliations

Effects of Sex, Strain, and Energy Intake on Hallmarks of Aging in Mice

Sarah J Mitchell et al. Cell Metab. .

Abstract

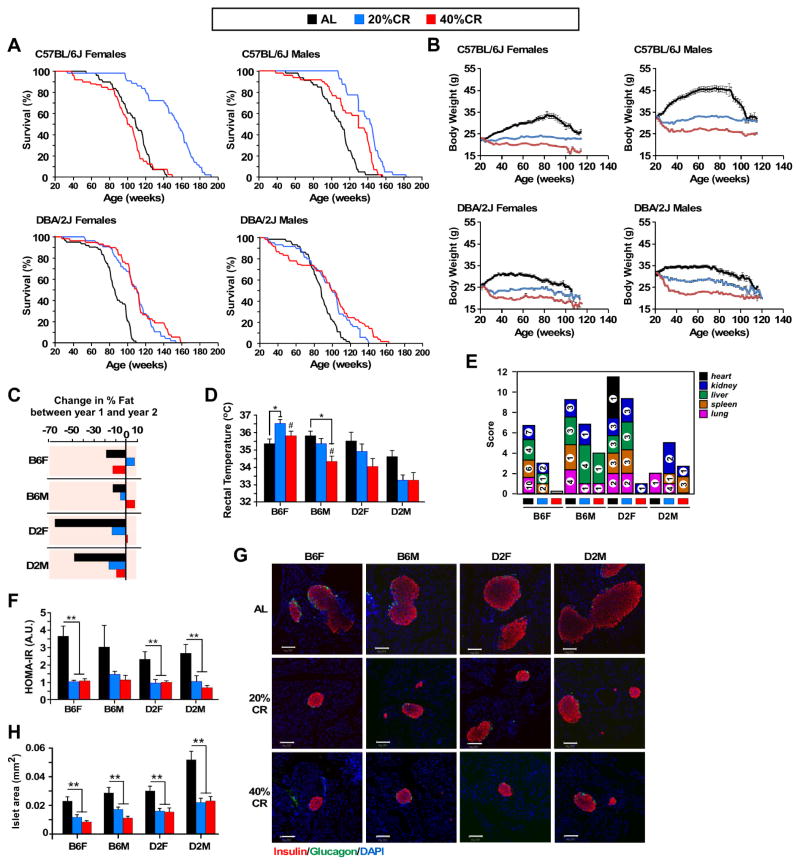
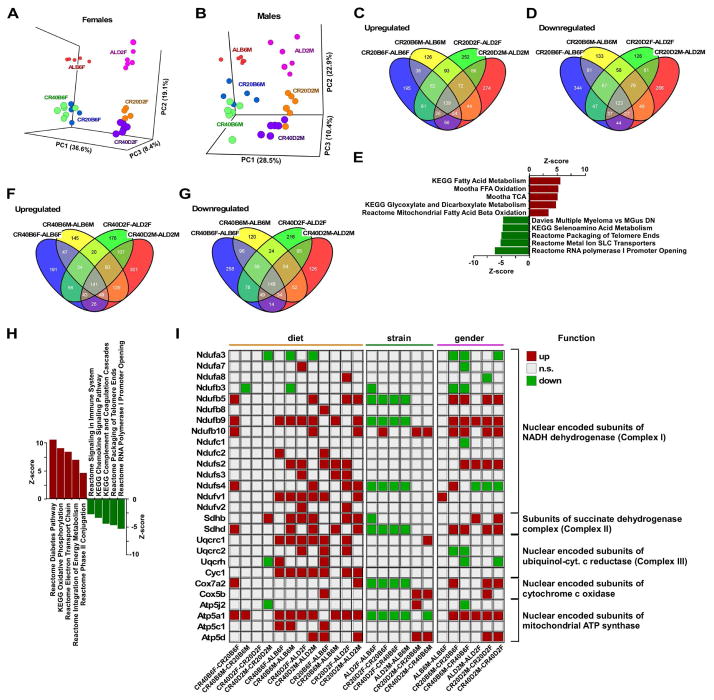
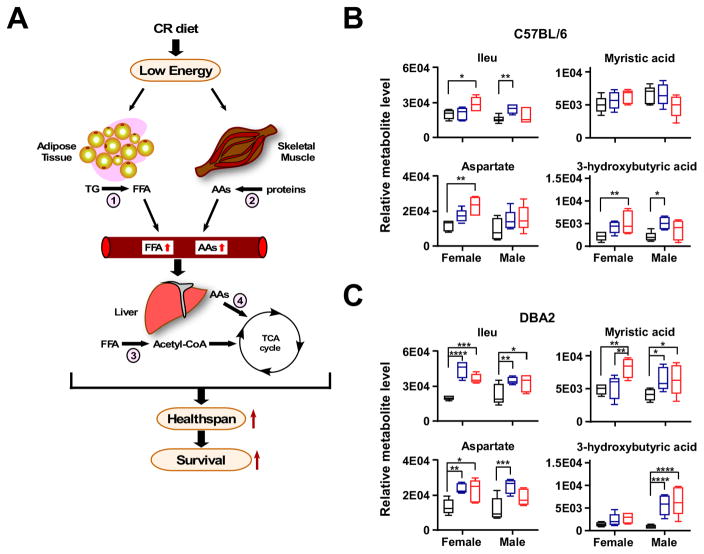
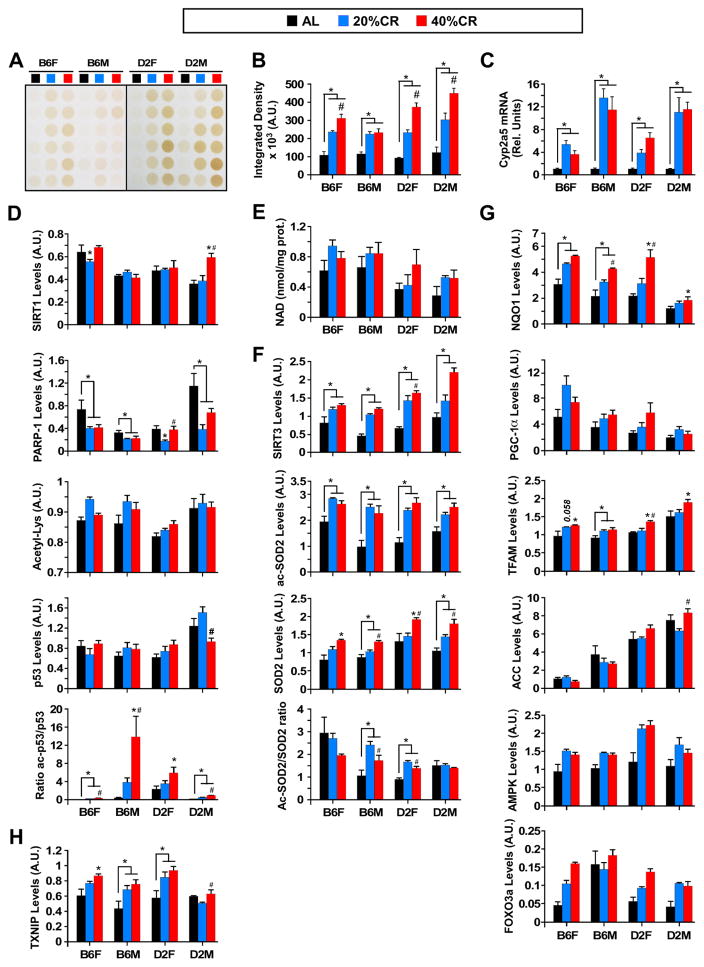
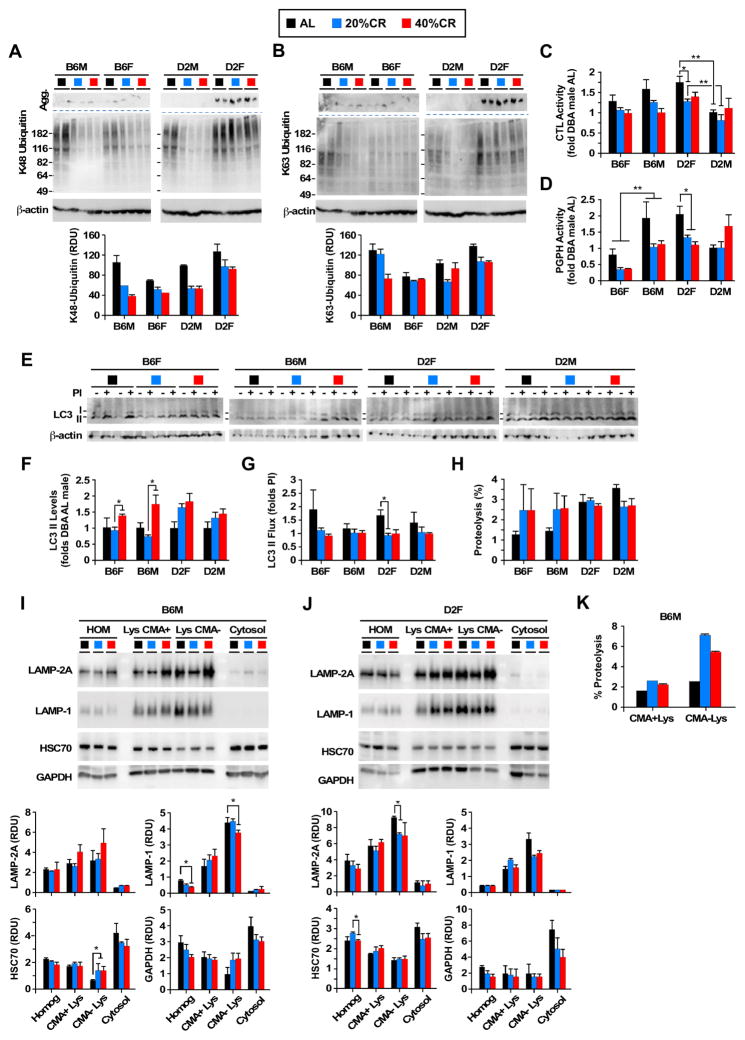
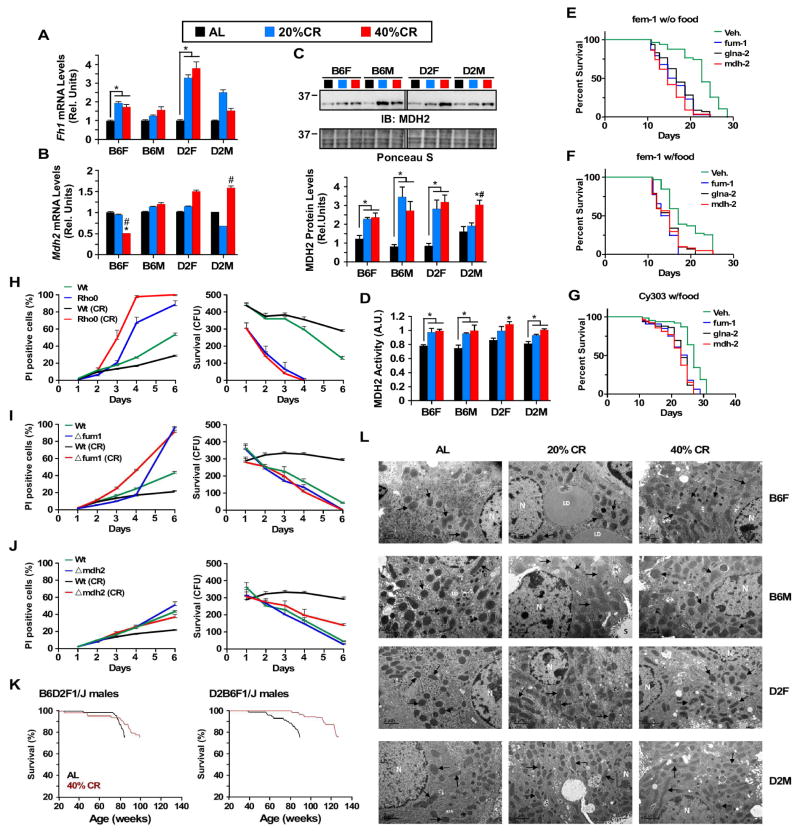
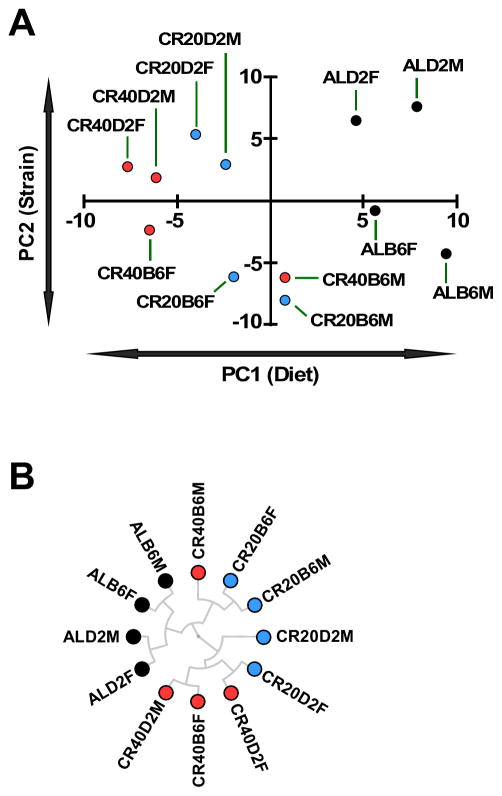
Calorie restriction (CR) is the most robust non-genetic intervention to delay aging. However, there are a number of emerging experimental variables that alter CR responses. We investigated the role of sex, strain, and level of CR on health and survival in mice. CR did not always correlate with lifespan extension, although it consistently improved health across strains and sexes. Transcriptional and metabolomics changes driven by CR in liver indicated anaplerotic filling of the Krebs cycle together with fatty acid fueling of mitochondria. CR prevented age-associated decline in the liver proteostasis network while increasing mitochondrial number, preserving mitochondrial ultrastructure and function with age. Abrogation of mitochondrial function negated life-prolonging effects of CR in yeast and worms. Our data illustrate the complexity of CR in the context of aging, with a clear separation of outcomes related to health and survival, highlighting complexities of translation of CR into human interventions.


Figures

Figure 1
Figure 1. Sex- and strain-specific effects of caloric restriction (CR) on lifespan and healthspan in mice
(A) Kaplan-Meier survival curves for mice fed either a standard diet at libitum (AL) or maintained on 20% and 40% CR. n=50–63 mice per experimental group (B) Body weight trajectories of mice fed either a standard diet at libitum (AL) or maintained on 20% and 40% CR. n=50–63 mice per experimental group (C) Change in percent fat mass measured by nuclear magnetic resonance spectroscopy between year-1 and year-2. n=11–50 per experimental group, 11–13 mo age (5–7 mo diet) and 22–24mo age (16–18mo age) (D) Rectal temperatures measured in mice. n=8 per experimental group, 18–19 mo age, 12–13 mo on diet (E) Prevalence of different grade lymphomas. n=4–12 mice per experimental group. For ages please see Table S3B (F) The homeostatic model assessment calculation of insulin resistance (HOMA-IR). n=6 per experimental group, 23–24mo age, 17–18mo on diet (G) Immunofluorescence images of pancreatic islets stained for insulin (red; Texas Red) and glucagon (green; FITC). Scale bar, 100 μm. n=6 per experimental group, 23–24mo age, 17–18mo on diet (H) Islet area (mm2) n=4–6 per experimental group, 23–24mo age, 17–18mo on diet. Bars represent mean ± SEM. *, p<0.05 compared to AL; #, p<0.05 compared to 20% CR.
Figure 2
Figure 2. Impact of mouse strain and sex in the global hepatic gene expression profile of mice fed CR versus AL
(A) PCA scatter plot analysis revealed the impact of mouse strain (PC1) and diet (AL versus 20% and 40%CR) (PC2) in female and (B) male mice. The difference in pattern between 20%CR and 40%CR was modest, especially in B6 females (PC3). CR40B6F, B6 females on 40%CR; CR20B6F, B6 females on 20%CR; CR40D2F, D2 females on 40%CR; CR20D2F, D2 females on 20%CR; CR40B6M, B6 males on 40% CR; CR20B6M, B6 males on 20% CR; CR40D2M, D2 males on 40%CR; CR20D2M, D2 males on 20%CR. (C) Four-way Venn diagrams of upregulated and (D) downregulated gene transcripts present in CR20B6F-ALB6F, CR20B6M-ALB6M, CR20D2F-ALD2F, and CR20D2M-ALD2M pairwise comparisons. (E) Partial list of top genesets shared among the four CR20-AL pairwise comparisons, with the Z-score values of CR20B6F-ALB6F depicted. (F) Four-way Venn diagrams of upregulated and (G) downregulated gene transcripts present in CR40B6F-ALB6F, CR40B6M-ALB6M, CR40D2F-ALD2F, and CR40D2M-ALD2M pairwise comparisons. (H) Partial list of top genesets shared among the four CR40-AL pairwise comparisons, with the Z-score values of CR40B6F-ALB6F depicted. (I) Binary representation of gene expression related to mitochondrial electron transport chain among all 24 pairwise comparisons. Upregulated (red squares); downregulated (green squares); not significant (beige squares). Listing of the shared gene sets is provided in the Supplemental Information. All microarray data is n=6 biological replicates per experimental group, 23–24mo age, 17–18mo on diet.
Figure 3
Figure 3. Metabolite profiles in liver of mice on CR indicate the predominance of catabolic modes
(A) Schematic representation of the effect of CR on the release of FFA from adipose tissue (lipolysis, 1) and breakdown of proteins from skeletal muscle (ubiquitin/proteolysis and autophagy, 2), resulting in accumulation of metabolites feeding the TCA cycle in liver mitochondria (fatty acid β-oxidation, 3; anaplerotic filling of the TCA cycle via amino acids, 4). This metabolism switch could account for the increase in healthspan and lifespan observed in CR-fed animals. (B) Relative level of Ileu, aspartate, myristate, and 3-hydroxybutyrate in B6 and (C) D2 mouse liver is depicted as box plots (n=6 per group). All data is n=6 biological replicates per experimental group, 23–24mo age, 17–18mo on diet. AL, black box, 20% CR, blue box, 40% CR, red box. *, **, *** P < 0.05, 0.01 and 0.001.
Figure 4
Figure 4. Effect of CR on hydrogen sulfide production and expression of various metabolically relevant protein markers in different mouse strains
(A) Production of H2S in total liver lysates of AL- and CR-fed mice. (B) Densitometric quantification of H2S production. (C) Cyb2a5 mRNA levels measured by quantitative RT-PCR. (D) Total liver lysates were immunoblotted with the indicated primary antibodies (see Figure S3B for full immunoblot images). Densitometric measurements of SIRT1, PARP-1, cellular acetylated proteins, total p53, and ratio of acetylated/total forms of p53 are depicted. (E) NAD determination in liver lysates; (F) Densitometric measurements of SIRT3, acetylated and total SOD2, and the ratio of acetylated/total forms of SOD2. Full immunoblot images are depicted in Figure S4C. (G) Densitometric measurements of NQO1, PGC-1α, TFAM, ACC, AMPK, and FOXO3a are depicted. Full immunoblot images are shown in Figure S3D. (H) Densitometric measurements of TXNIP (full immunoblot images in Figure S3D). (D-F-H) Immunoblot membranes were stained with Ponceau S (representative staining in Figure S3E) and each band was normalized to the total densitometric value of the Ponceau staining for that line. All data is the mean ± SEM of 6 biological replicates per experimental group, 23–24mo age, 17–18mo on diet. *, p<0.05 compared to AL; #, p<0.05 compared to 20% CR.
Figure 5
Figure 5. Changes in proteostasis and autophagy in response to CR in different mouse strains
(A) Immunoblot for K48- and (B) K63-linked ubiquitinated proteins from liver homogenates. Bottom: Densitometric quantification after actin normalization. n=2. (C) Chymotrypsin-like (CTL) and (D) peptidyl-glutamyl peptide-hydrolytic (PGPH) proteasome activity measured in the presence of ATP in liver homogenates. Values are expressed relative to AL-fed D2 males, which were given an arbitrary value of 1. n=3, 23–24mo age, 17–18mo on diet. Values are mean + SEM. *p<0.05, **p<0.01. (E) LC3-II levels and LC3-II flux measured by immunoblotting for LC3 in liver explants incubated or not with lysosomal protease inhibitors (PI, NH4Cl and leupeptin). (F) Graphs show densitometric quantification of LC3 levels and (G) LC3 II flux. n=4, 23–24mo age, 17–18mo on diet. (H) CMA activity as measured by percentage of proteolysis of radiolabeled pool of cytosolic proteins in isolated intact CMA+ lysosomes. n=2, 23–24mo age, 17–18mo on diet. (I) Immunoblot for the indicated proteins in homogenate (HOM), CMA+ and CMA- lysosomes, and cytosol isolated from livers of B6 males and (J) D2 females. Graphs (bottom) show densitometric quantification of LAMP-2A, LAMP-1, HSC70 and GAPDH. (K) CMA activity as measured as in I in CMA+ (n=2) and CMA-lysosomes isolated from B6 male mice (n=3–4). Values are mean ± SEM, 23–24mo age, 17–18mo on diet. *p<0.05, **p<0.01, ***p<0.001.
Figure 6
Figure 6. Functional mitochondria are required for the lifespan extension effects of CR
(A) Fh1 and (B) Mdh2 mRNA levels were measured by quantitative RT-PCR. Bars represent mean ± SEM of 4–6 biological replicates, 23–24mo age, 17–18mo on diet. *, p<0.05 compared to AL; #, p<0.05 compared to 20% CR. (C) Mdh2 protein levels and (D) activity in total liver lysates. (E–F) Survival curves of fem-1 and (G) Cy303 strains of C. elegans harboring genetic deletion either in fum-1, glna-2 or mdh2. (H) Survival curves (right panels) and percent of PI-stained cells (left panels) of rho0, (I) Δfum1, and (J) Δmdh2 yeast cell mutants fed either AL or CR diet. (K) Kaplan-Meier survival curves for B6D2F1/J and D2B6F1/J male mice fed either a standard diet at libitum (AL) or maintained on 40% CR. n=60–75 mice per experimental group (L) Representative transmission electron microscopy images of liver sections of all 12 experimental groups, n=4–6 biological replicates per experimental group, 23–24mo age, 17–18mo on diet.
Figure 7
Figure 7
Principal component analysis (A) and hierarchical clustering (B) of the various experimental groups based on Z-score normalized behavioral, physiological, biochemical and metabolomics data using uncentered similarity metrics and average linkage (see Figure S7 for a clustering of the input data).

References

    1. Abu-Bakar A, Lamsa V, Arpiainen S, Moore MR, Lang MA, Hakkola J. Regulation of CYP2A5 gene by the transcription factor nuclear factor (erythroid-derived 2)-like 2. Drug Metab Dispos: the biological fate of chemicals. 2007;35:787–794. - PubMed
    1. Adamovich Y, Shlomai A, Tsvetkov P, Umansky KB, Reuven N, Estall JL, Spiegelman BM, Shaul Y. The protein level of PGC-1alpha, a key metabolic regulator, is controlled by NADH-NQO1. Mol Cell Biol. 2013;33:2603–2613. - PMC - PubMed
    1. Anisimov VN, Berstein LM, Egormin PA, Piskunova TS, Popovich IG, Zabezhinski MA, Tyndyk ML, Yurova MV, Kovalenko IG, Poroshina TE, et al. Metformin slows down aging and extends life span of female SHR mice. Cell Cycle. 2008;7:2769–2773. - PubMed
    1. Anson RM, Guo Z, de Cabo R, Iyun T, Rios M, Hagepanos A, Ingram DK, Lane MA, Mattson MP. Intermittent fasting dissociates beneficial effects of dietary restriction on glucose metabolism and neuronal resistance to injury from calorie intake. Proc Natl Acad Sci U S A. 2003;100:6216–6220. - PMC - PubMed
    1. Artal-Sanz M, Tavernarakis N. Prohibitin couples diapause signalling to mitochondrial metabolism during ageing in C. elegans. Nature. 2009;461:793–797. - PubMed

Publication types

MeSH terms