. 2016 Jun 15;12(6):e1005687.
doi: 10.1371/journal.ppat.1005687. eCollection 2016 Jun.

Patients with Tuberculosis Have a Dysfunctional Circulating B-Cell Compartment, Which Normalizes following Successful Treatment

Affiliations

Patients with Tuberculosis Have a Dysfunctional Circulating B-Cell Compartment, Which Normalizes following Successful Treatment

Simone A Joosten et al. PLoS Pathog. .

Abstract

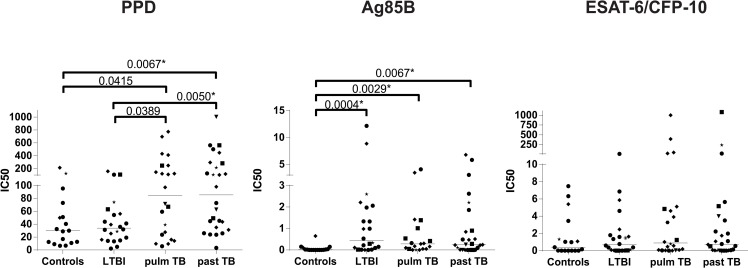
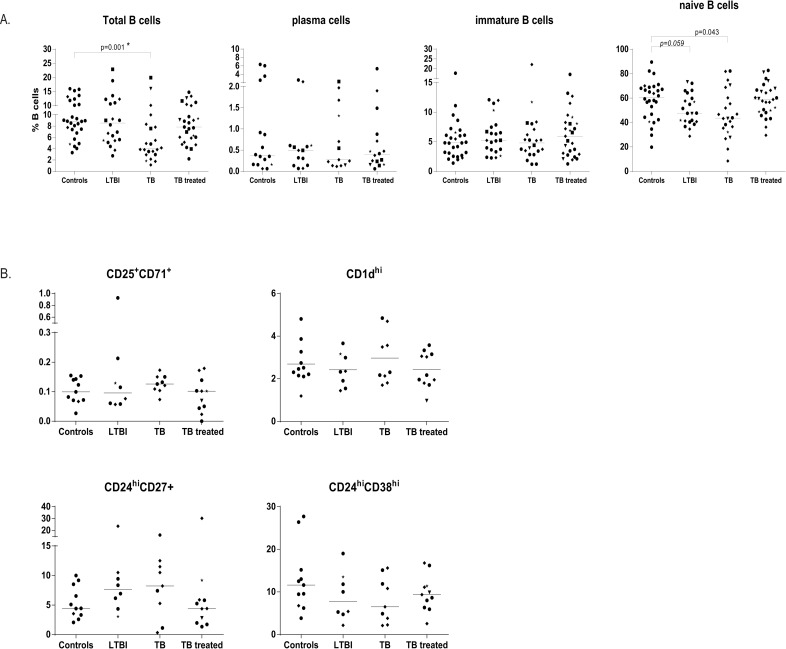
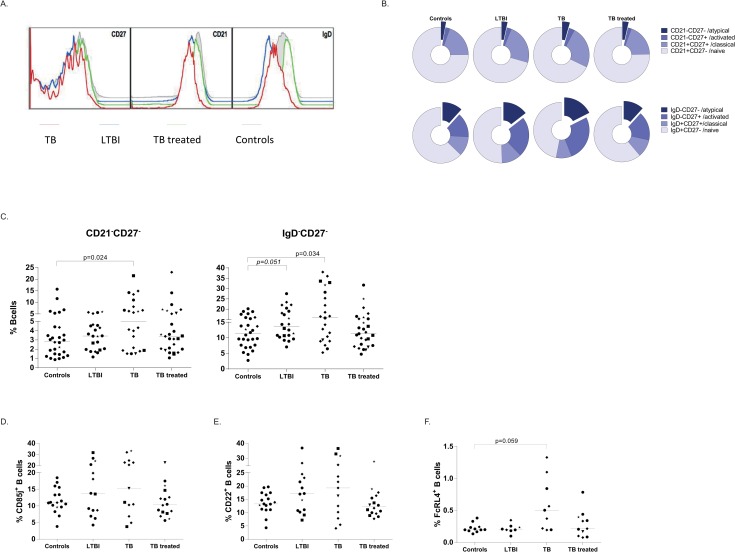
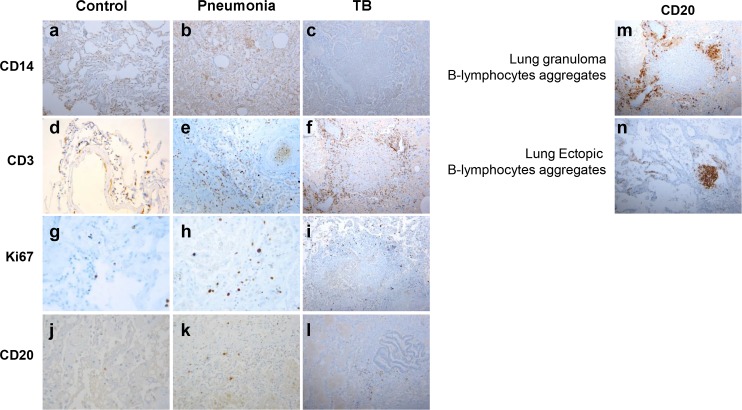
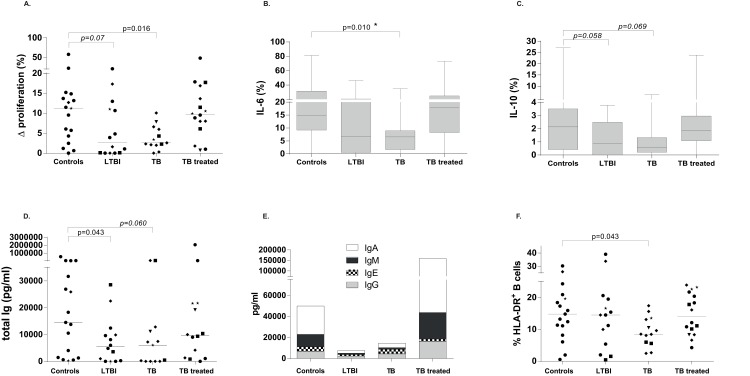
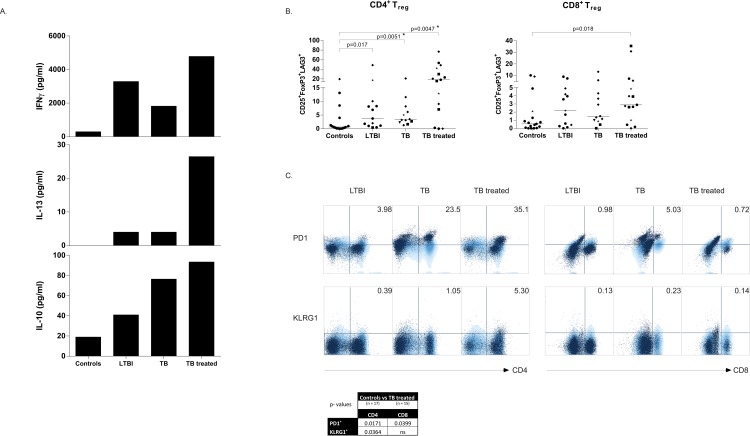
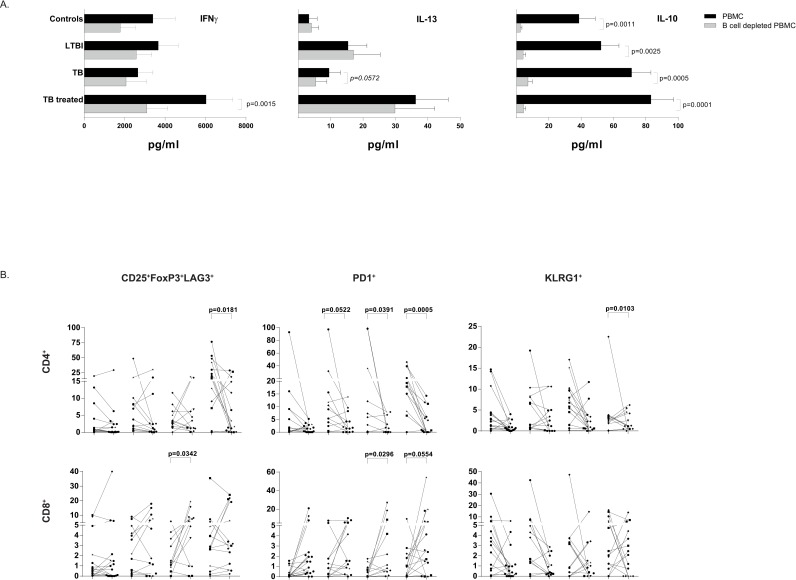
B-cells not only produce immunoglobulins and present antigens to T-cells, but also additional key roles in the immune system. Current knowledge on the role of B-cells in infections caused by intracellular bacteria is fragmentary and contradictory. We therefore analysed the phenotypical and functional properties of B-cells during infection and disease caused by Mycobacterium tuberculosis (Mtb), the bacillus causing tuberculosis (TB), and included individuals with latent TB infection (LTBI), active TB, individuals treated successfully for TB, and healthy controls. Patients with active or treated TB disease had an increased proportion of antibodies reactive with mycobacteria. Patients with active TB had reduced circulating B-cell frequencies, whereas only minor increases in B-cells were detected in the lungs of individuals deceased from TB. Both active TB patients and individuals with LTBI had increased relative fractions of B-cells with an atypical phenotype. Importantly, these B-cells displayed impaired proliferation, immunoglobulin- and cytokine- production. These defects disappeared upon successful treatment. Moreover, T-cell activity was strongest in individuals successfully treated for TB, compared to active TB patients and LTBI subjects, and was dependent on the presence of functionally competent B-cells as shown by cellular depletion experiments. Thus, our results reveal that general B-cell function is impaired during active TB and LTBI, and that this B-cell dysfunction compromises cellular host immunity during Mtb infection. These new insights may provide novel strategies for correcting Mtb infection-induced immune dysfunction towards restored protective immunity.


Conflict of interest statement

The authors have declared that no competing interests exist.

Figures

Fig 1
Fig 1. Antibodies reactive with PPD are present in active and treated TB patients.
Plasma samples of from individuals infected with Mtb, with active TB disease or successfully treated TB patients and controls were tested by ELISA for the presence of IgG antibodies reactive with PPD (left), Ag85B (middle) and ESAT-6/CFP-10 (right). Ethnicity of donors was indicated using the following symbols: ‘black circle’ = West Europe; ‘black diamond’ = Est Europe; ‘black square’ = Africa; ‘black triangle’ = Asia; ‘black star’ = Sud America. Groups were compared to the uninfected controls using the Mann-Whitney test and a p< 0.05 was considered significant. * marks differences that remained significant after multiple test correction using Kruskal-Wallis testing with Dunn’s post-test.
Fig 2
Fig 2. Patients with TB have less B-cells.
PBMCs from individuals infected with Mtb (LTBI), with active TB disease or successfully treated TB patients and controls were thawed and stained directly for several combinations of B-cell surface markers. Lines indicate the median values of all groups. Ethnicity of donors was indicated using the following symbols: ‘black circle’ = West Europe; ‘black diamond’ = Est Europe; ‘black square’ = Africa; ‘black triangle’ = Asia; ‘black star’ = Sud America. Groups were compared to the uninfected controls using the Mann-Whitney test and a p< 0.05 was considered significant. * marks differences that remained significant after multiple test correction using Kruskal-Wallis testing with Dunn’s post-test. A. The percentage of CD19+ total B-cells in the different patients group expressed within the total lymphocyte population; CD20-CD21- plasma cells expressed as percentage of CD19+ B-cells; CD10+ immature B-cells as percentage of CD19+ B-cells and IgD+CD27- naïve B-cells as percentage of total CD19+ B-cells. The analysis was performed in 28 controls, 22 LTBI individuals, 22 TB patients and 27 TB treated subjects, except for plasma cells which were enumerated in 16, 14, 16, 13 individuals respectively. B. Regulatory B-cell populations were enumerated within the total CD19+ B-cells for a subset of individuals (11 control, 8 LTBI, 9 TB, 11 TB treated) by surface staining of B-cells within PBMCs.
Fig 3
Fig 3. TB patients have an increased proportion of atypical B-cells.
PBMCs were thawed and stained directly for several combinations of B-cell surface markers. Lines indicate the median values of all groups. Ethnicity of donors was indicated using the following symbols: ‘black circle’ = West Europe; ‘black diamond’ = Est Europe; ‘black square’ = Africa; ‘black triangle’ = Asia; ‘black star’ = Sud America. Mann-Whitney test was performed to compare infected groups to the uninfected controls and a p< 0.05 was considered significant. * marks differences that remained significant after multiple test correction using Kruskal-Wallis testing with Dunn’s post-test. A. Memory B cell subsets identified by concatenate analysis for CD27, CD21 and IgD on 17 control (grey), 14 LTBI (blue), 13 TB (red), 16 TB treated (green) individuals within the CD19+ B-cells. B. Memory B-cell subset distribution for CD21-CD27 (top row) and IgD-CD27 (bottom row) expressed as median of each group representing 28 controls, 22 LTBI individuals, 22 TB patients and 27 TB treated subjects. C. Atypical memory B-cells characterized by the absence of CD21 and CD27 (left panel) or the absence of IgD and CD27 for all individuals included in the study, expressed as percentage of total CD19+ B-cells, with a line at the median value. D. B-cell exhaustion markers CD85J (D), CD22 (E), FcRL4 (F) were measured on B-cells within total PBMCs and are expressed as percentage within the atypical memory B-cells.
Fig 4
Fig 4. Lymphocyte, B cell and monocyte distribution in the lung.
CD14, CD3 and CD20 cell distribution within lung tissues of patients died for TB, pneumonia, or causes other than pneumonia. Representative histological examination of lung specimens from autopsies of control patients died for causes other than pneumonia (n = 5) (a, d, g, j), for bacterial pneumonia (n = 10) (b, e, h, k) or for pulmonary TB (n = 10) (c, f, i, l). Samples were stained with CD14 Ab, CD3 Ab, CD20 Ab and Ki67 Ab. In TB patients B-cells are found mainly around the granuloma (m) or as aggregates near vessels (n). Original magnification (OM), 200x.
Fig 5
Fig 5. B-cells from TB patients as well as LTBI individuals have an impaired function.
Total B-cells were isolated from PBMCs using magnetic bead separation for CD19 and stimulated with the combination of anti-CD40 and anti IgG/ IgM activating antibodies to obtain maximal, polyclonal B-cell activation. Data on isolated B-cells were obtained from 17 controls, 14 LTBI individuals, 13 TB patients and 16 treated TB patients. Lines indicate the median values of all groups. Ethnicity of donors was indicated using the following symbols: ‘black circle’ = West Europe; ‘black diamond’ = Est Europe; ‘black square’ = Africa; ‘black triangle’ = Asia; ‘black star’ = Sud America. Mann-Whitney test was performed to compare infected groups to the uninfected controls and a p< 0.05 was considered significant. * marks differences that remained significant after multiple test correction using Kruskal-Wallis testing with Dunn’s post-test. A. Isolated total CD19+ B-cells were labelled with a violet cell proliferation dye, proliferation in unstimulated conditions was subtracted from the anti-CD40 + purified IgG/ IgM stimulated conditions to obtain the delta proliferation reflecting the stimulation induced proliferation. Proliferation was assessed after 6 days of stimulation. B. Cytokine production measured by intracellular cytokine staining by flow cytometry for IL-6 (B) and IL-10 (C). Boxes express the 25–75% of data, with a line at median and whiskers indicate 5–95% data points. Cytokine production was measured after 2 days of stimulation; cytokines in unstimulated conditions were subtracted from stimulated conditions. C. Immunoglobulin production was measured in supernatants of unstimulated, isolated B-cells on day 2 of culture using multiplex bead array and expressed as total pg/ml for all isotypes combined. Lines indicate median values for each group. D. Immunoglobulin production per isotype, expressed as mean production per group of individuals for IgA, IgM, IgE and IgG. E. HLA-DR expression on B-cells following stimulation with anti-CD40 + anti IgG/ IgM expressed within the total CD19+ B-cells. Lines indicate median values.
Fig 6
Fig 6. T-cell responses against mycobacteria are strongest in previously treated TB patients.
PBMCs were stimulated with live BCG (MOI 3) for 6 days and CD4+ and CD8+ T-cells were analysed. The experiments were performed using cells from 17 controls, 13 LTBI individuals, 12 TB patients and 16 treated TB patients. Ethnicity of donors was indicated using the following symbols: ‘black circle’ = West Europe; ‘black diamond’ = Est Europe; ‘black square’ = Africa; ‘black triangle’ = Asia; ‘black star’ = Sud America. LTBI, TB and individuals treated for TB were compared to the controls using the Mann-Whitney test and a p < 0.05 was considered significant. *: p < 0.05; **: p < 0.01; ***: p < 0.001. * marks differences that remained significant after multiple test correction using Kruskal-Wallis testing with Dunn’s post-test. A. Cytokine production was measured in supernatants collected on day 5 by multiplex bead array and are expressed as median pg/ml in BCG stimulated minus unstimulated wells. B. Regulatory T-cell markers were stained by cell surface followed by intracellular staining, cells were gated on singlets, lymphogate, viable CD3+ T-cells followed by CD4 or CD8 gating and analysis of Treg associated markers using Boolean gating. Data are expressed as the percentage of CD25+FoxP3+LAG3+ cells within the CD4+ (left) or CD8+ (right) gate of BCG stimulated minus unstimulated samples, with a line at median. C. Inhibitory marker expression on CD4+ (top) and CD8+ (bottom) T-cells following BCG stimulation, light blue represents a healthy control with an overlay in dark blue from a Mtb infected individual. Mann-Whitney analysis on all individuals compared to the control group revealed a significant increase of PD1 on CD4+ (p = 0.017) and CD8+ (p = 0.039) T-cells of TB treated individuals. KLRG1 expression was only significant on CD4+ T-cells (p = 0.036) of TB treated subjects.
Fig 7
Fig 7. B-cells contribute to the magnitude of T-cell responses in treated TB patients.
To investigate the contribution of B-cells to T-cell activation in the various groups of Mtb infected individuals we depleted CD19+ B-cells from PBMCs and compared the T-cell responses following BCG stimulation in total PBMC to those in B-cell depleted PBMCs. Ethnicity of donors was indicated using the following symbols: ‘black circle’ = West Europe; ‘black diamond’ = Est Europe; ‘black square’ = Africa; ‘black triangle’ = Asia; ‘black star’ = Sud America. Data obtained from B-cell depleted samples were compared pair-wise to total PBMC samples using the Wilcoxon signed Rank test and a p-value < 0.05 was considered significant. *: p < 0.05; **: p < 0.01; ***: p < 0.001; @: p = 0.052 (PD1 on CD4+ T-cells in LTBI), p = 0.055 (PD1 on CD8+ T-cells in TB treated patients s). A. Cytokine production (median in pg/ml) in supernatants on day 5 following BCG stimulation (medium subtracted) for total PBMC (black) and B-cell depleted PBMC (grey). Data are expressed as mean + standard error of the mean. B. Expression of regulatory T-cell markers, or exhaustion markers PD1 and KLRG1 (as percentage of CD4+ or CD8+ T-cells) in total PBMCs (filled dots) or following CD19 depletion (open dots).

References

    1. Lombardi G, del GF, Vismara D, Piccolella E, de Martino C, Garzelli C et al. Epstein-Barr virus-transformed B cells process and present Mycobacterium tuberculosis particulate antigens to T-cell clones. Cell Immunol. 1987; 107: 281–292. - PubMed
    1. Garcia-Perez BE, De la Cruz-Lopez JJ, Castaneda-Sanchez JI, Munoz-Duarte AR, Hernandez-Perez AD, Villegas-Castrejon H et al. Macropinocytosis is responsible for the uptake of pathogenic and non-pathogenic mycobacteria by B lymphocytes (Raji cells). BMC Microbiol. 2012; 12: 246 10.1186/1471-2180-12-246 - DOI - PMC - PubMed
    1. Zhu Q, Zhang M, Shi M, Liu Y, Zhao Q, Wang W et al. Human B cells have an active phagocytic capability and undergo immune activation upon phagocytosis of Mycobacterium tuberculosis. Immunobiology. 2016; 221: 558–567. 10.1016/j.imbio.2015.12.003 - DOI - PubMed
    1. Moir S, Fauci AS. B cells in HIV infection and disease. Nat Rev Immunol. 2009; 9: 235–245. 10.1038/nri2524 - DOI - PMC - PubMed
    1. Moir S, Ho J, Malaspina A, Wang W, DiPoto AC, O'Shea MA et al. Evidence for HIV-associated B cell exhaustion in a dysfunctional memory B cell compartment in HIV-infected viremic individuals. J Exp Med. 2008; 205: 1797–1805. 10.1084/jem.20072683 - DOI - PMC - PubMed

Publication types