. 2016 Sep;12(9):1472-86.
doi: 10.1080/15548627.2016.1190071. Epub 2016 Jun 15.

Atg5-mediated autophagy deficiency in proximal tubules promotes cell cycle G2/M arrest and renal fibrosis

Affiliations

Atg5-mediated autophagy deficiency in proximal tubules promotes cell cycle G2/M arrest and renal fibrosis

Huiyan Li et al. Autophagy. 2016 Sep.

Abstract

Macroautophagy/autophagy protects against cellular stress. Renal sublethal injury-triggered tubular epithelial cell cycle arrest at G2/M is associated with interstitial fibrosis. However, the role of autophagy in renal fibrosis is elusive. Here, we hypothesized that autophagy activity in tubular epithelial cells is pivotal for inhibition of cell cycle G2/M arrest and subsequent fibrogenic response. In both renal epithelial cells stimulated by angiotensin II (AGT II) and the murine kidney after unilateral ureteral obstruction (UUO), we observed that occurrence of autophagy preceded increased production of COL1 (collagen, type I). Pharmacological enhancement of autophagy by rapamycin suppressed COL1 accumulation and renal fibrosis. In contrast, genetic ablation of autophagy by proximal tubular epithelial cell-specific deletion of Atg5, with reduction of the LC3-II protein level and degradation of SQSTM1/p62, showed marked cell cycle arrest at the G2/M phase, robust COL1 deposition, and severe interstitial fibrosis in a UUO model, as compared with wild-type mice. In vitro, AGT II exposure triggered autophagy preferentially in the G1/S phase, and increased COL1 expression in the G2/M phase in renal epithelial cells. Stimulation of Atg5-deficient primary proximal tubular cells with AGT II also resulted in elevated G2/M arrest and COL1 production. Pharmacological or genetic inhibition of autophagy increased AGT II-mediated G2/M arrest. Enhanced expression of ATG5, but not the autophagy-deficient ATG5 mutant K130R, rescued the G2/M arrest, suggesting the regulation of cell cycle progression by ATG5 is autophagy dependent. In conclusion, Atg5-mediated autophagy in proximal epithelial cells is a critical host-defense mechanism that prevents renal fibrosis by blocking G2/M arrest.

Keywords: ATG5; autophagy; cell cycle; proximal tubular epithelial cells; renal fibrosis.


Figures
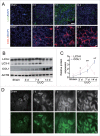
Figure 1.
Figure 1.
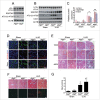
Dynamics of autophagy and COL1 accumulation after UUO. (A) Representative images of immunofluorescence staining for LC3 (green) and COL1 (red) on kidney sections after 3,7, and 14 d of UUO compared with sham-operated C57BL/6 mice. Nuclei are highlighted with DAPI. Insert shows higher magnification images of LC3 puncta. Scale bar: 20 μm and 10 μm (insert). (B) Immunoblot analyses of LC3 and COL1 in the sham-operated and UUO kidneys of C57BL/6 mice. ACTB was used as loading control. (C) Densitometry of LC3-II and COL1 in immunoblots. Data are means ± SEM (n = 6); *, P < 0.01 vs. sham; #, P < 0.05 vs. other groups in UUO. (D) Representative images of LC3-positive dots in the kidney of GFP-Lc3 transgenic mice in different groups as indicated. Fluorescent signals were depicted as black and white in the upper panels. Scale bar: 20 μm.
Figure 2.
Figure 2.
Enhancement of autophagy by rapamycin (Rapa) ameliorates renal interstitial fibrosis in C57BL/6 mice. (A) Immunoblot analyses of LC3, SQSTM1/p62, and COL1 in the obstructed kidneys in different groups as indicated. (B) Quantitative determination of the relative abundance of the indicated proteins among different groups. Data are means ± SEM (n = 6); *, P < 0.001 vs. sham; #, P < 0.05 vs. UUO mice treated with vehicle. (C) Coimmunostaining of LTL (green) and SQSTM1/p62 (red) in kidney sections. Scale bar: 20 μm. (D) Semiquantitative analysis of tubular damage in the obstructed kidneys. Data are means ±SEM (n = 6); *, P < 0.05 vs. sham; #, P < 0.05 vs. UUO mice treated with vehicle. (E) Representative micrographs from indicated groups with either periodic acid-Schiff (PAS; upper panels) or Masson's trichrome staining (lower panels). Scale bar: 20 μm.
Figure 3.
Figure 3.
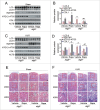
Proximal tubular epithelial cell-specific Atg5 deletion exacerbates UUO-induced renal fibrosis. (A) Immunoblot analyses of ATG12–ATG5 conjugation, LC3 and SQSTM1/p62 in the kidneys of Atg5+/+ and atg5−/− mice. (B) Immunoblot analyses of proteins in the kidneys from sham-operated and at d 7 after UUO in Atg5+/+ and atg5−/− mice. (C) Relative expression levels of the indicated proteins normalized to ACTB in Atg5+/+ and atg5−/− mice. Data are means ± SEM (n = 6); *, P < 0.001 vs. sham; #, P < 0.05 vs. Atg5+/+ mice with UUO. (D) Coimmunostaining of LTL (green) and SQSTM1/p62 (red) on kidney sections. Scale bar: 20 μm. (E) Representative micrographs of kidney histology with Masson's trichrome staining from Atg5+/+ and atg5−/− mice. Scale bar: 80 (upper panels), 40 (middle panels), and 20 (lower panels) μm. (F) Representative images of Sirius red-stained sections of sham-operated and 7 d-obstructed Atg5+/+ and atg5−/− mice. Scale bar: 20 μm. (G) Semiquantitative analysis of tubular damage in the obstructed kidneys. Data are means ± SEM (n = 6); *, P < 0.05 vs. sham; #, P < 0.05 vs. Atg5+/+ mice with UUO.
Figure 4.
Figure 4.
Atg5 deficiency abolishes the protective effect of rapamycin against renal fibrosis in mice. (A) Immunoblot analyses of proteins in the sham-operated kidneys of Atg5+/+ and atg5−/− mice treated with or without rapamycin. (B) Relative expression levels of the indicated proteins normalized to ACTB in Atg5+/+ and atg5−/− mice treated with or without rapamycin. Data are means ± SEM (n = 6); *, P < 0.001 vs. vehicle-treated Atg5+/+ mice; #, P < 0.05 vs. rapamycin-treated Atg5+/+ mice. (C) Immunoblot analyses of proteins in the kidneys at day 7 after UUO in Atg5+/+ and atg5−/− mice treated with or without rapamycin. (D) Relative expression levels of the indicated proteins normalized to ACTB in Atg5+/+ and atg5−/- mice treated with or without rapamycin. Data are means ± SEM (n = 6); *, P < 0.001 vs. vehicle-treated Atg5+/+ mice; #, P < 0.05 vs. rapamycin-treated Atg5+/+ mice. (E) Representative micrographs of kidney histology with Masson's trichrome staining from Atg5+/+ and atg5−/− mice. Scale bar: 80 (upper panels), 40 (middle panels), and 20 (lower panels) μm.
Figure 5.
Figure 5.
Tubular cell G2/M arrest is increased in UUO-induced fibrotic kidney. (A) Dual immunofluorescence of MKI67 (red) and p-H3 (green) in sham-operated and UUO kidneys on d 7 and 14 in C57BL/6 mice. DAPI (blue) was used for nuclear staining. Scale bar: 20 μm. (B) The percentage of MKI67+ p-H3+ cells among total MKI67+ tubular cells in different groups. Data represented as mean ± SEM (n = 6); *, P < 0.05 vs. sham. #, P < 0.05 vs. UUO 7 d. (C) Representative immunofluorescence staining of p-H3 (red), COL1 (green), and DAPI (blue) on kidney sections of Atg5-deficient mice from different groups. Scale bar: 20 μm. (D) Quantification of tubular cells with p-H3 positive. Data represented as mean ± SEM (n = 6); *, P < 0.05 vs. sham; #, P < 0.01 vs. obstructed kidney of Atg5+/+ mice.
Figure 6.
Figure 6.
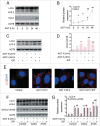
Overexpression of ATG5 augments AGT II-mediated autophagy in vitro. (A) Serum-deprived HK-2 cells were treated with 10−6 mol/L of AGT II for the indicated time period. Cell lysates were probed with antibodies against LC3 and COL1. ACTB was used as a loading control. (B) Densitometry of LC3-II and COL1 proteins in immunoblots (relative to ACTB). Data are means ± SEM (n = 3); *, P <0.001 vs. control group. #, P <0.001 vs. AGT II-treated cells for 12 or 24 h. (C) Cells were treated with AGT II at 10−6 mol/L for 24 and 48 h in the presence or absence of E64d and pepstatin A (E/P). Induction of autophagy was assessed by analyzing the expression of LC3. ACTB was used as a loading control. (D) Densitometry of LC3-II in immunoblots (relative to ACTB). Data are means ± SEM (n = 3); *, P < 0.001 vs. control group; #, P < 0.05 vs. AGT II-treated cells at the same time point in the absence of E/P. (E) Cells were treated with AGT II (10−6 mol/L) for 24 and 48 h in the absence or presence of E/P. Formation of LC3 puncta was analyzed by immunofluorescence under confocal microscopy (×400). (F) Cells were transfected with either pcDNA3.1-ATG5 or pcDNA3.1-HA vector followed by incubation with 10−6 mol/L of AGT II for 24 h. LC3 and ATG12–ATG5 conjugation protein levels were examined by Western blotting. ACTB was used as a loading control. (G) LC3 and ATG5 contents were quantitatively analyzed using a densitometer. Values are mean ± SEM (n = 3); *, P < 0.001 vs. control group in the same condition; #, P < 0.05 vs. AGT II-treated cells in the corresponding condition without E/P; §, P < 0.05 vs. cells transfected with empty vector in the corresponding condition.
Figure 7.
Figure 7.
ATG5 inhibits AGT II-induced COL1 expression in vitro. (A) HK-2 cells were transfected with either pcDNA3.1-ATG5 or pcDNA3.1-HA vector before stimulation with 10−6 mol/L of AGT II for 24 or 48 h. Cell lysates were analyzed by immunoblotting with the indicated antibodies. (B) Densitometry of LC3-II and COL1 proteins in immunoblots. Data are means ± SEM (n = 3); *, P < 0.05 vs. negative and empty control; #, P < 0.05 vs. control and AGT II-treated cells for 24 h with or without ATG5 overexpression; §, P < 0.05 vs. control and AGT II-treated cells for 48 h without ATG5 overexpression. (C) Expression of LC3, ATG12–ATG5 conjugation, SQSTM1/p62, and LRP2/MEGALIN in primary TECs from Atg5+/+ and atg5−/− mice were assessed by Western blot analysis. (D) Primary TECs from Atg5+/+ and atg5−/− mice were stimulated with 10−6 mol/L of AGT II for 24 or 48 h. Cell lysates were probed with antibodies against the indicated proteins.
Figure 8.
Figure 8.
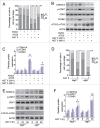
AGT II-induced autophagy is dependent on cell cycle status in HK-2 cells. Cells were treated with10−6 mol/L of AGT II for the indicated time period. (A) Cells were exposed to AGT II, followed by PI staining and flow cytometry. (B) Cell cycle distribution among different groups. Data are means ± SEM (n = 3); *, P < 0.05 vs. control and AGT II-treated cells for 24 h. Symbol indicates the fraction of G2/M phase cells. (C) Cells synchronized at G1/S or G2/M phase were treated with AGT II for the indicated time period. Cell lysates were probed with antibodies against LC3 and COL1. (D) Densitometry of LC3-II and COL1 proteins in immunoblots. Data are means ± SEM (n = 3); *, P < 0.05 vs. respective control group; #, P < 0.05 vs. control and cells synchronized at G1/S phase treated with AGT II for 24 h; §, P < 0.05 vs. cells synchronized at G2/M phase treated with AGT II for 0–24 h, or cells synchronized at G1/S phase treated with or without AGT II.
Figure 9.
Figure 9.
Overexpression of ATG5 attenuates AGT II-induced G2/M cell cycle arrest in HK-2 cells and primary TECs. (A) HK-2 cells were transiently transfected with either pcDNA3.1-ATG5 or pcDNA3.1-HA vector followed by treatment with 10−6 mol/L of AGT II for 48 h, and then cell cycle distribution was analyzed by flow cytometry. Data are means ± SEM (n = 3); *, P < 0.01 vs. AGT II-untreated cells; #, P < 0.05 vs. AGT II-treated cells without ATG5 overexpression. Symbols indicate the fraction of G2/M phase cells. (B) HK-2 cells were treated as described above. Expression of CDKN1A/p21, p-CDK1, and CCNB1 (cyclin B1) was examined by immunoblot. (C) Protein levels were quantified with scanning densitometry and standardized to ACTB. Data are expressed as mean ± SEM (n = 3); *, P < 0.01 vs. control or cells treated with AGT II for 24 h; #, P <0.05 vs. cells treated with AGT II for 48 h without ATG5 overexpression. (D) Primary renal proximal TECs from Atg5+/+ and atg5−/− mice were stimulated with 10−6 mol/L of AGT II for 48 h. Cell cycle distribution was assessed by flow cytometry. Data are expressed as mean ± SEM (n = 3); *, P < 0.01 vs. respective control; #, P < 0.05 vs. AGT II-treated cells from Atg5+/+ mice. Symbols indicate the fraction of G2/M phase cells. (E) Primary renal proximal TECs were treated as described in Figure 5D. Protein expression was detected by immunoblotting. (F) The expression of CDKN1A/p21, p-CDK1, and CCNB1 was quantitatively analyzed using a densitometer. Values are mean ± SEM (n = 3); *, P < 0.05 vs. respective control or cells treated with AGT II for 24 h; #, P < 0.05 vs. cells from Atg5+/+ mice treated with AGT II for 48 h.
Figure 10.
Figure 10.
Autophagy induction is required for ATG5-mediated cell cycle progression. (A) HK-2 cells were transiently transfected with plasmids encoding pcDNA3.1-ATG5-K130R or pcDNA3.1-HA followed by incubation with 10−6 mol/L of AGT II for 24 or 48 h. Expression of LC3, SQSTM1/p62, and ATG5 (ATG12-conjugated and monomeric) were examined by immunoblot. (B) Relative expression levels of the indicated proteins normalized to ACTB. Data are mean ± SEM (n = 3); *, P < 0.05 vs. negative control, empty vector, or ATG5-K130R control vector. (C) HK-2 cells were transiently transfected with plasmids encoding pcDNA3.1-ATG5, pcDNA3.1-ATG5-K130R or pcDNA3.1-HA, or scramble siRNA, ATG5 siRNA, or cells pretreated with 3-MA, and then cell cycle distribution was analyzed in the absence (upper panels) or presence (lower panels) of AGT II for 48 h. (D) HK-2 cells were treated as indicated and the histograms represent the distribution of cells cycle among different groups. Data are means ± SEM (n = 3); *, P < 0.05 vs. cells in the absence of AGT II; #, P < 0.05 vs. cells treated with AGT II without ATG5 overexpression. Symbols indicate the fraction of G2/M phase cells.

References

    1. Radhakrishnan J, Remuzzi G, Saran R, Williams DE, Rios-Burrows N, Powe N, Bruck K, Wanner C, Stel VS, Venuthurupalli SK, et al.. Taming the chronic kidney disease epidemic: a global view of surveillance efforts. Kidney Int 2014; 86:246–50; PMID:24897034; http://dx.doi.org/10.1038/ki.2014.190 - DOI - PMC - PubMed
    1. Canaud G, Bonventre JV. Cell cycle arrest and the evolution of chronic kidney disease from acute kidney injury. Nephrol Dial Transplant 2015; 30(4):575–83; PMID:25016609; http://dx.doi.org/10.1093/ndt/gfu230 - DOI - PMC - PubMed
    1. Thomasova D, Anders HJ. Cell cycle control in the kidney. Nephrol Dial Transplant 2015; 30(10):1622–30; PMID:25538161; http://dx.doi.org/10.1093/ndt/gfu395 - DOI - PubMed
    1. Yang L, Besschetnova TY, Brooks CR, Shah JV, Bonventre JV. Epithelial cell cycle arrest in G2/M mediates kidney fibrosis after injury. Nat Med 2010; 16:535–43, 1p-143p; http://dx.doi.org/10.1038/nm.2144 - DOI - PMC - PubMed
    1. Hale AN, Ledbetter DJ, Gawriluk TR, Rucker ER. Autophagy: regulation and role in development. Autophagy 2013; 9:951–72; PMID:24121596; http://dx.doi.org/10.4161/auto.24273 - DOI - PMC - PubMed

Publication types

MeSH terms

LinkOut - more resources