

Split Spinach Aptamer for Highly Selective Recognition of DNA and RNA at Ambient Temperatures
- PMID: 27305425
- PMCID: PMC5198575
- DOI: 10.1002/cbic.201600323
Split Spinach Aptamer for Highly Selective Recognition of DNA and RNA at Ambient Temperatures
Abstract
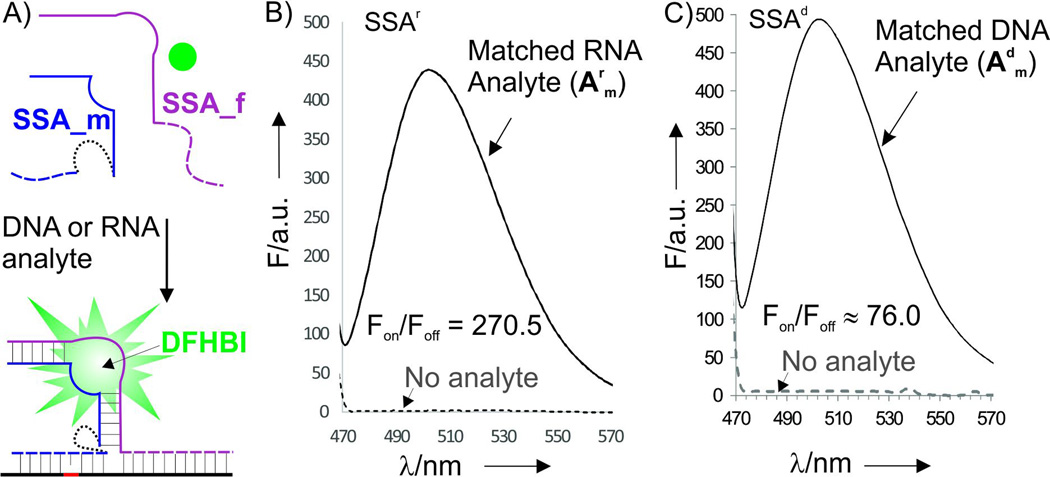
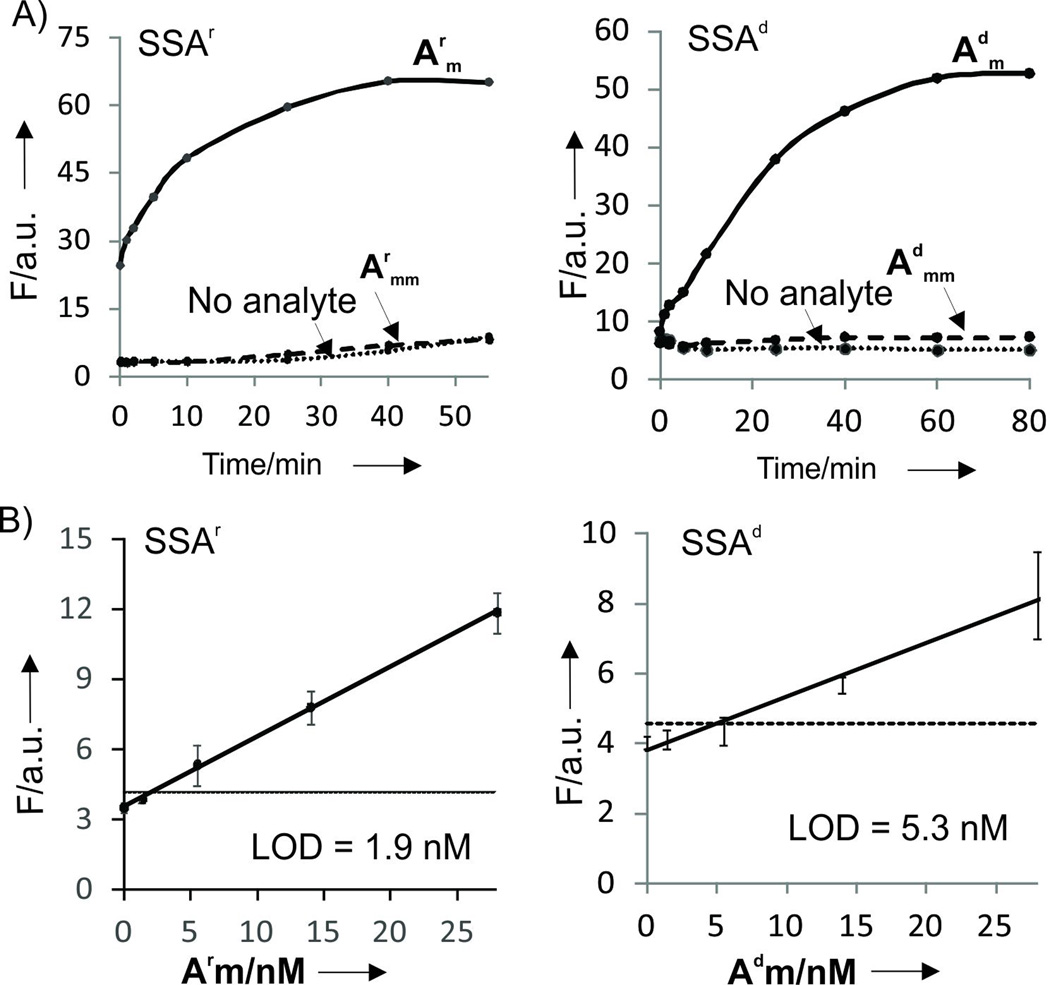
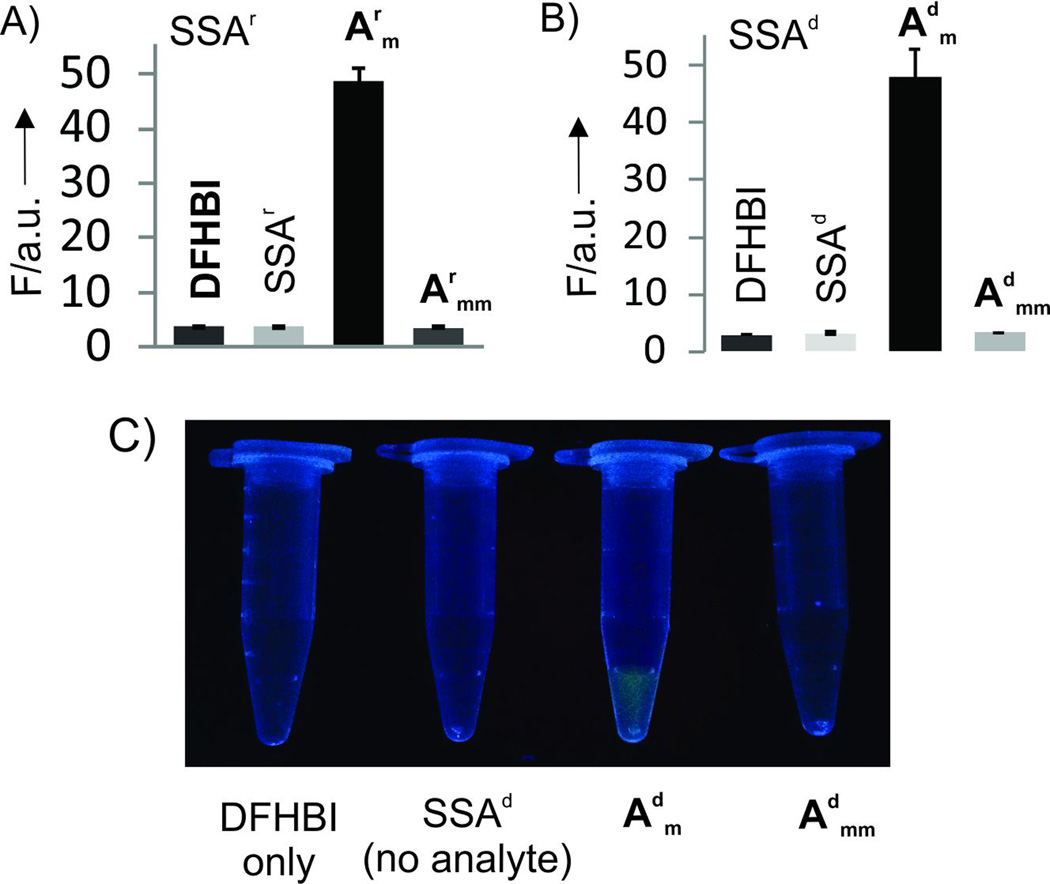
Split spinach aptamer (SSA) probes for fluorescent analysis of nucleic acids were designed and tested. In SSA design, two RNA or RNA/DNA strands hybridized to a specific nucleic acid analyte and formed a binding site for low-fluorescent 3,5-difluoro-4-hydroxybenzylidene imidazolinone (DFHBI) dye, which resulted in up to a 270-fold increase in fluorescence. The major advantage of the SSA over state-of-the art fluorescent probes is high selectivity: it produces only background fluorescence in the presence of a single-base-mismatched analyte, even at room temperature. SSA is therefore a promising tool for label-free analysis of nucleic acids at ambient temperatures.
Keywords: RNA; aptameric sensor; high selectivity; label-free probes; split probes.
© 2016 WILEY-VCH Verlag GmbH & Co. KGaA, Weinheim.
Figures
Similar articles
-
A highly efficient Baby Spinach-based minimal modified sensor (BSMS) for nucleic acid analysis.Org Biomol Chem. 2019 Aug 14;17(30):7222-7227. doi: 10.1039/c9ob01414d. Epub 2019 Jul 22. Org Biomol Chem. 2019. PMID: 31329202
-
Photophysics of DFHBI bound to RNA aptamer Baby Spinach.Sci Rep. 2021 Apr 1;11(1):7356. doi: 10.1038/s41598-021-85091-y. Sci Rep. 2021. PMID: 33795733 Free PMC article.
-
Split light up aptamers as a probing tool for nucleic acids.Methods. 2022 Jan;197:82-88. doi: 10.1016/j.ymeth.2021.05.008. Epub 2021 May 13. Methods. 2022. PMID: 33992774
-
Binary (Split) Light-up Aptameric Sensors.Angew Chem Int Ed Engl. 2021 Mar 1;60(10):4988-4999. doi: 10.1002/anie.201914919. Epub 2020 Oct 8. Angew Chem Int Ed Engl. 2021. PMID: 32208549 Review.
-
In Vivo Production of RNA Aptamers and Nanoparticles: Problems and Prospects.Molecules. 2021 Mar 6;26(5):1422. doi: 10.3390/molecules26051422. Molecules. 2021. PMID: 33800717 Free PMC article. Review.
Cited by
-
Split Green Fluorescent Proteins: Scope, Limitations, and Outlook.Annu Rev Biophys. 2019 May 6;48:19-44. doi: 10.1146/annurev-biophys-051013-022846. Epub 2019 Feb 20. Annu Rev Biophys. 2019. PMID: 30786230 Free PMC article. Review.
-
Recent advances in high-performance fluorescent and bioluminescent RNA imaging probes.Chem Soc Rev. 2017 May 22;46(10):2824-2843. doi: 10.1039/c6cs00675b. Chem Soc Rev. 2017. PMID: 28345687 Free PMC article. Review.
-
Nonequilibrium Hybridization Enables Discrimination of a Point Mutation within 5-40 °C.J Am Chem Soc. 2016 Oct 19;138(41):13465-13468. doi: 10.1021/jacs.6b05628. Epub 2016 Oct 4. J Am Chem Soc. 2016. PMID: 27681667 Free PMC article.
-
Split Dapoxyl Aptamer for Sequence-Selective Analysis of Nucleic Acid Sequence Based Amplification Amplicons.Anal Chem. 2019 Feb 19;91(4):2667-2671. doi: 10.1021/acs.analchem.8b03964. Epub 2019 Feb 4. Anal Chem. 2019. PMID: 30680988 Free PMC article.
-
Detection of SARS-CoV-2 RNA Using a DNA Aptamer Mimic of Green Fluorescent Protein.ACS Chem Biol. 2022 Apr 15;17(4):840-853. doi: 10.1021/acschembio.1c00893. Epub 2022 Mar 26. ACS Chem Biol. 2022. PMID: 35341244 Free PMC article.
References
-
- Liu J, Cao Z, Lu Y. Chem. Rev. 2009;109:1948–1998. - PMC - PubMed
- Khakshoor O, Kool ET. Chem. Commun. 2011;47:7018–7024. - PMC - PubMed
- Marras SA, Tyagi S, Kramer FR. Clin. Chim. Acta. 2006;363:48–60. - PubMed
- Juskowiak B. Anal. Bioanal. Chem. 2011;399:3157–3176. - PMC - PubMed
- Obliosca JM, Liu C, Batson RA, Babin MC, Werner JH, Yeh HC. Biosensors (Basel) 2013;3:185–200. - PMC - PubMed
- Suzuki Y, Yokoyama K. Biosensors. 2015;5:337–363. - PMC - PubMed
- Kato T, Shimada I, Kimura R, Hyuga M. Chem Commun. 2016;52:4041–4044. - PubMed
- Knez K, Spasic D, Janssen KP, Lammertyn J. Analyst. 2014;139:353–370. - PubMed
- Lai YH, Sun SC, Chuang MC. Biosensors (Basel) 2014;4:273–300. - PMC - PubMed
- Østergaard ME, Hrdlicka PJ. Chem. Soc. Rev. 2011;40:5771–5788. - PMC - PubMed
-
- Cardullo RA, Agrawal S, Flores C, Zamecnik PC, Wolf DE. Proc. Natl. Acad. Sci. U.S.A. 1988;85:8790–8794. - PMC - PubMed
- Oser A, Valet G. Angew. Chem., Int. Ed. Engl. 1990;29:1167–1168.
- Silverman AP, Kool ET. Chem. Rev. 2006;106:3775–3789. - PubMed
- Guo J, Ju J, Turro NJ. Anal Bioanal Chem. 2012;402:3115–3125. - PMC - PubMed
-
- Venkatesan N, Seo YJ, Kim BH. Chem. Soc. Rev. 2008;37:648–663. - PubMed
- Satterfield BC, West JA, Caplan MR. Nucleic Acids Res. 2007;35:e76. - PMC - PubMed
- Tan X, Wang Y, Armitage BA, Bruchez MP. Anal Chem. Anal Chem. 2014;86:10864–10869. - PubMed
- Juul S, Obliosca JM, Liu C, Liu YL, Chen YA, Imphean DM, Knudsen BR, Ho YP, Leong KW, Yeh HC. Nanoscale. 2015;7:8332–8337. - PMC - PubMed
- Obliosca JM, Babin MC, Liu C, Liu YL, Chen YA, Batson RA, Ganguly M, Petty JT, Yeh HC. ACS Nano. 2014;8:10150–10160. - PMC - PubMed
-
- Tyagi S. Nat. Methods. 2009;6:331–338. - PubMed
- Weil TT, Parton RM, Davis I. Trends Cell Biol. 2010;7:380–390. - PMC - PubMed
- Broude NE. Mol Microbiol. 2011;5:1137–1147. - PubMed
- Santangelo PJ, Alonas E, Jung J, Lifland AW, Zurla C. Methods Enzymol. 2012;505:383–399. - PMC - PubMed
- Nakamura Y, Ishiguro A, Miyakawa S. Genes Cells. 2012;17:344–364. - PMC - PubMed
- Wang T, Ray J. Protein Cell. 2012;3:739–754. - PMC - PubMed
- Boutorine AS, Novopashina DS, Krasheninina OA, Nozeret K, Venyaminova AG. Molecules. 2013;18:15357–15397. - PMC - PubMed
- Urbanek MO, Galka-Marciniak P, Olejniczak M, Krzyzosiak WJ. RNA Biol. 2014;11:1083–1095. - PMC - PubMed
- Urbanek MO, Galka-Marciniak P, Olejniczak M, Krzyzosiak WJ. RNA Biol. 2014;8:1083–1095. - PMC - PubMed
- Holstein JM, Rentmeister A. Methods. 2016;98:18–25. - PubMed
- Wang Z, Zhang K, Wooley KL, Taylor JS. J. Nucleic Acids. 2012;2012:962652. - PMC - PubMed
Publication types
MeSH terms
Substances
Grants and funding
LinkOut - more resources
Full Text Sources
Other Literature Sources
Research Materials
