. 2016 Jul 20;138(28):8815-23.
doi: 10.1021/jacs.6b03565. Epub 2016 Jul 5.

Picosecond Photobiology: Watching a Signaling Protein Function in Real Time via Time-Resolved Small- and Wide-Angle X-ray Scattering

Affiliations

Picosecond Photobiology: Watching a Signaling Protein Function in Real Time via Time-Resolved Small- and Wide-Angle X-ray Scattering

Hyun Sun Cho et al. J Am Chem Soc. .

Abstract

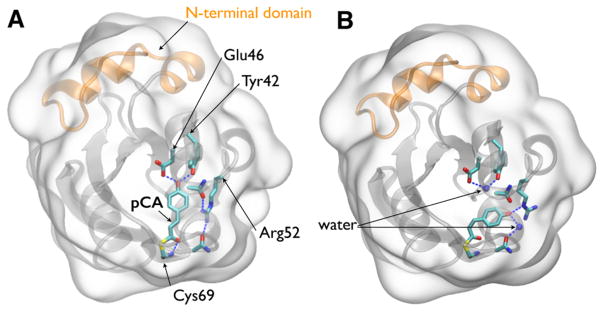
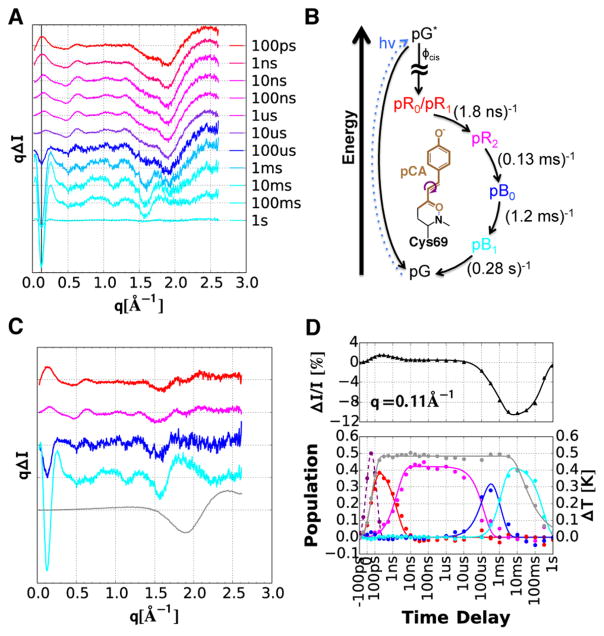
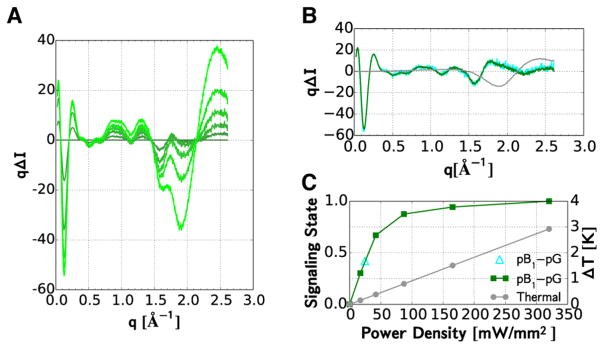
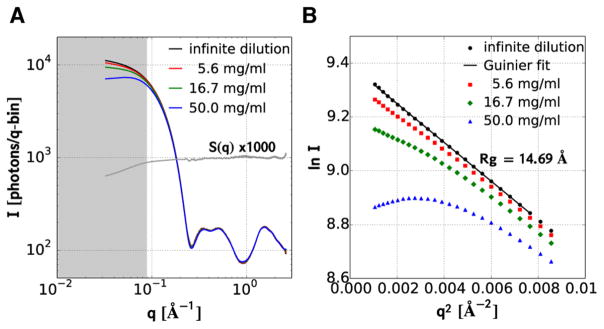
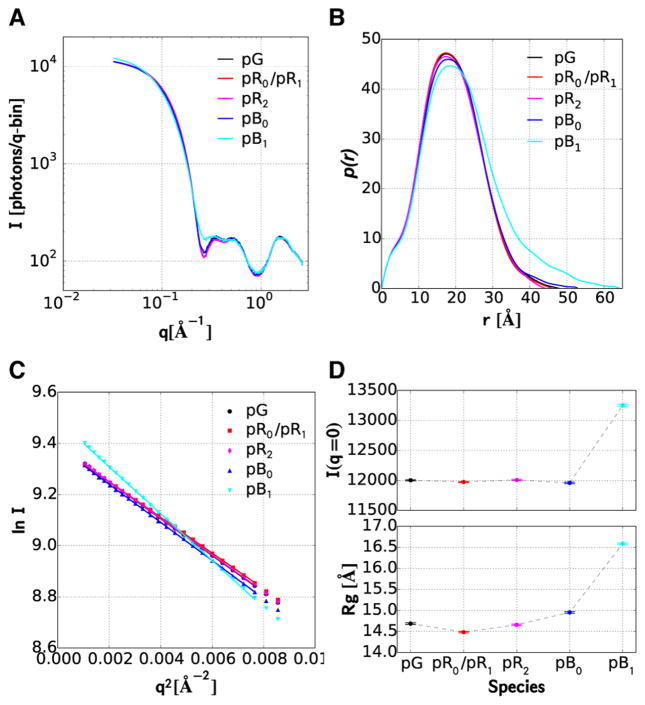
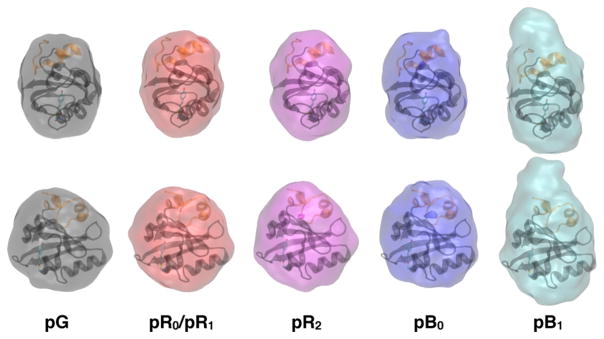
The capacity to respond to environmental changes is crucial to an organism's survival. Halorhodospira halophila is a photosynthetic bacterium that swims away from blue light, presumably in an effort to evade photons energetic enough to be genetically harmful. The protein responsible for this response is believed to be photoactive yellow protein (PYP), whose chromophore photoisomerizes from trans to cis in the presence of blue light. We investigated the complete PYP photocycle by acquiring time-resolved small and wide-angle X-ray scattering patterns (SAXS/WAXS) over 10 decades of time spanning from 100 ps to 1 s. Using a sequential model, global analysis of the time-dependent scattering differences recovered four intermediates (pR0/pR1, pR2, pB0, pB1), the first three of which can be assigned to prior time-resolved crystal structures. The 1.8 ms pB0 to pB1 transition produces the PYP signaling state, whose radius of gyration (Rg = 16.6 Å) is significantly larger than that for the ground state (Rg = 14.7 Å) and is therefore inaccessible to time-resolved protein crystallography. The shape of the signaling state, reconstructed using GASBOR, is highly anisotropic and entails significant elongation of the long axis of the protein. This structural change is consistent with unfolding of the 25 residue N-terminal domain, which exposes the β-scaffold of this sensory protein to a potential binding partner. This mechanistically detailed description of the complete PYP photocycle, made possible by time-resolved crystal and solution studies, provides a framework for understanding signal transduction in proteins and for assessing and validating theoretical/computational approaches in protein biophysics.


Conflict of interest statement

The authors declare no competing financial interest.

Figures

Figure 1
Figure 1
Crystal structures of PYP. (A) Structure of PYP in its pG ground state (PDB ID: 2ZOH). (B) Structure of PYP in its pB0 state (PDB ID: 4BBV), as determined by time-resolved Laue crystallography. In this state, a water molecule penetrates into the interior of the protein and hydrogen-bonds to Glu46 and Tyr42. A second water molecule hydrogen bonds to the pCA phenolate oxygen, which is protonated in this state. The surfaces of both figures are rendered as glass and the backbone as ribbon. The pCA chromophore and Arg52, along with their hydrogen-bonding partners, are rendered as licorice. Dashed blue lines depict hydrogen bonds. The 25-residue N-terminal domain, colored orange, caps the β-scaffold of this sensory protein.
Figure 2
Figure 2
Time-resolved X-ray scattering of PYP in solution (50 mg·mL−1; 150 mM NaCl; 20 mM sodium phosphate buffer, pH 6.0). (A) Scattering differences recorded over 10 decades of time. For clarity, not all time delays are shown. (B) Kinetic model used in the global analysis. The PYP photocycle is triggered by trans-to-cis photo-isomerization of the pCA chromophore (shown in center). The colors in panel A are blended according to the color code of intermediates in this kinetic model. (C) Scattering differences of intermediates recovered by global analysis of the data in panel A. The gray line corresponds to the thermal contribution to the scattering signal (ΔT = 1.0 °C). (D) Upper panel: the black triangles track the time-dependent relative change in the SAXS intensity at q = 0.11 Å−1 (see black vertical line in panel A). The time scale is linear from –100 to 100 ps and logarithmic thereafter. Lower panel: time-dependent population of the intermediates (colored lines) and time-dependent temperature of the solution (gray line). The dashed line near zero time corresponds to the convolution of the laser and X-ray pulse, whose width determines the time resolution of the measurement.
Figure 3
Figure 3
Pump-power-dependent X-ray scattering from the pB1 signaling state. (A) Scattering differences acquired after photo-activation with five different power densities. (B) Protein (green) and thermal (gray) contributions to the scattering differences were obtained by global analysis of the differences in panel A. The population of the signaling state at the highest flux was assumed to be 100%. The thermal difference signal corresponds to ΔT = +1 °C. Overlapping the green curve is the scaled difference curve reported for pB1 in Figure 2C (cyan). (C) Pump-power-dependent amplitudes of the protein (green) and thermal (gray) contributions to the scattering patterns in panel A. The scale factor (cyan triangle) required to put the time-resolved scattering differences reported for (pB1 – pG) in Figure 2C on the same scale as the curve in Panel B corresponds to the signaling-state population achieved with the ~100 ps laser pulse used in the time-resolved study.
Figure 4
Figure 4
Concentration dependence of PYP scattering. (A) Log–log plot of scattering intensities. The two lower concentrations were rescaled to the high-concentration curve according to the ratio of their concentrations. S(q) corresponds to the ratio of the scattering curve acquired at 50 mg·mL−1 and its infinite dilution extrapolation. The gray shaded region corresponds to the Guinier region, i.e., where q ×Rg < 1.3. (B) Guinier plot of the scattering curves in panel A. The black line is a linear least-squares fit of the extrapolation to infinite dilution. The slope of this line corresponds to –Rg2/3.
Figure 5
Figure 5
Scattering of PYP and intermediates in its photocycle. (A) Log–log plot of scattering intensities; corrected for the packing structure factor (50 mg·mL−1). (B) Distance distribution function, p(r), computed from the curves in panel A using GNOM. (C) Guinier plots of the scattering curves in panel A. (D) I0 and Rg determined from linear least-squares fits of the Guinier plots in panel C. Rg (Å): pG (14.7); pR0/pR1 (14.5); pR2 (14.7); pB0, (15.0) and pB1 (16.6). I0 (relative to pG): pG (1.000); pR0/pR1 (0.998); pR2 (1.000); pB0 (0.996); and pB1 (1.104). The error bars correspond to ±1σ.
Figure 6
Figure 6
GASBOR reconstruction of particle shape from the curves shown in Figure 5A. The front and side views are superimposed on the pG structure of PYP. The major and minor dimensions of the 3-D GASBOR models were estimated by linear-least-squares fitting an ellipsoid (a,b,c) to each model. Relative to pG, the magnitudes of the major axes are pR0/pR1 (0.996); pR2 (1.011); pB0, (1.047); and pB1 (1.422).

References

    1. RCSB Protein Data Bank Home Page. www.rcsb.org.
    1. Berman HM, Westbrook J, Feng Z, Gilliland G, Bhat TN, Weissig H, Shindyalov IN, Bourne PE. Nucleic Acids Res. 2000;28:235. - PMC - PubMed
    1. Schotte F, Lim M, Jackson TA, Smirnov AV, Soman J, Olson JS, Phillips GN, Jr, Wulff M, Anfinrud PA. Science. 2003;300:1944. - PubMed
    1. Bourgeois D, Vallone B, Arcovito A, Sciara G, Schotte F, Anfinrud PA, Brunori M. Proc Natl Acad Sci U S A. 2006;103:4924. - PMC - PubMed
    1. Schotte F, Cho HS, Kaila VR, Kamikubo H, Dashdorj N, Henry ER, Graber TJ, Henning R, Wulff M, Hummer G, Kataoka M, Anfinrud PA. Proc Natl Acad Sci U S A. 2012;109:19256. - PMC - PubMed

Publication types

Substances

LinkOut - more resources