. 2016 Jun 16:7:11937.
doi: 10.1038/ncomms11937.

Hypothalamic CRH neurons orchestrate complex behaviours after stress

Affiliations

Hypothalamic CRH neurons orchestrate complex behaviours after stress

Tamás Füzesi et al. Nat Commun. .

Abstract

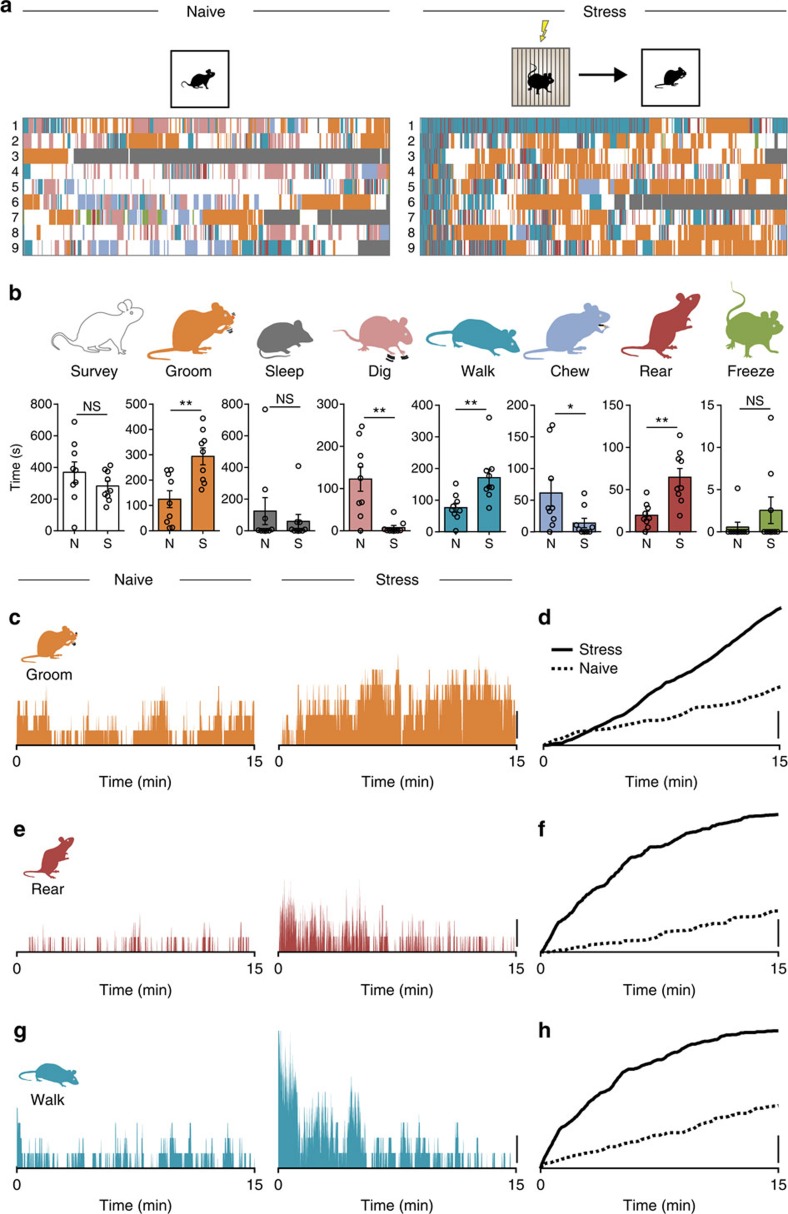
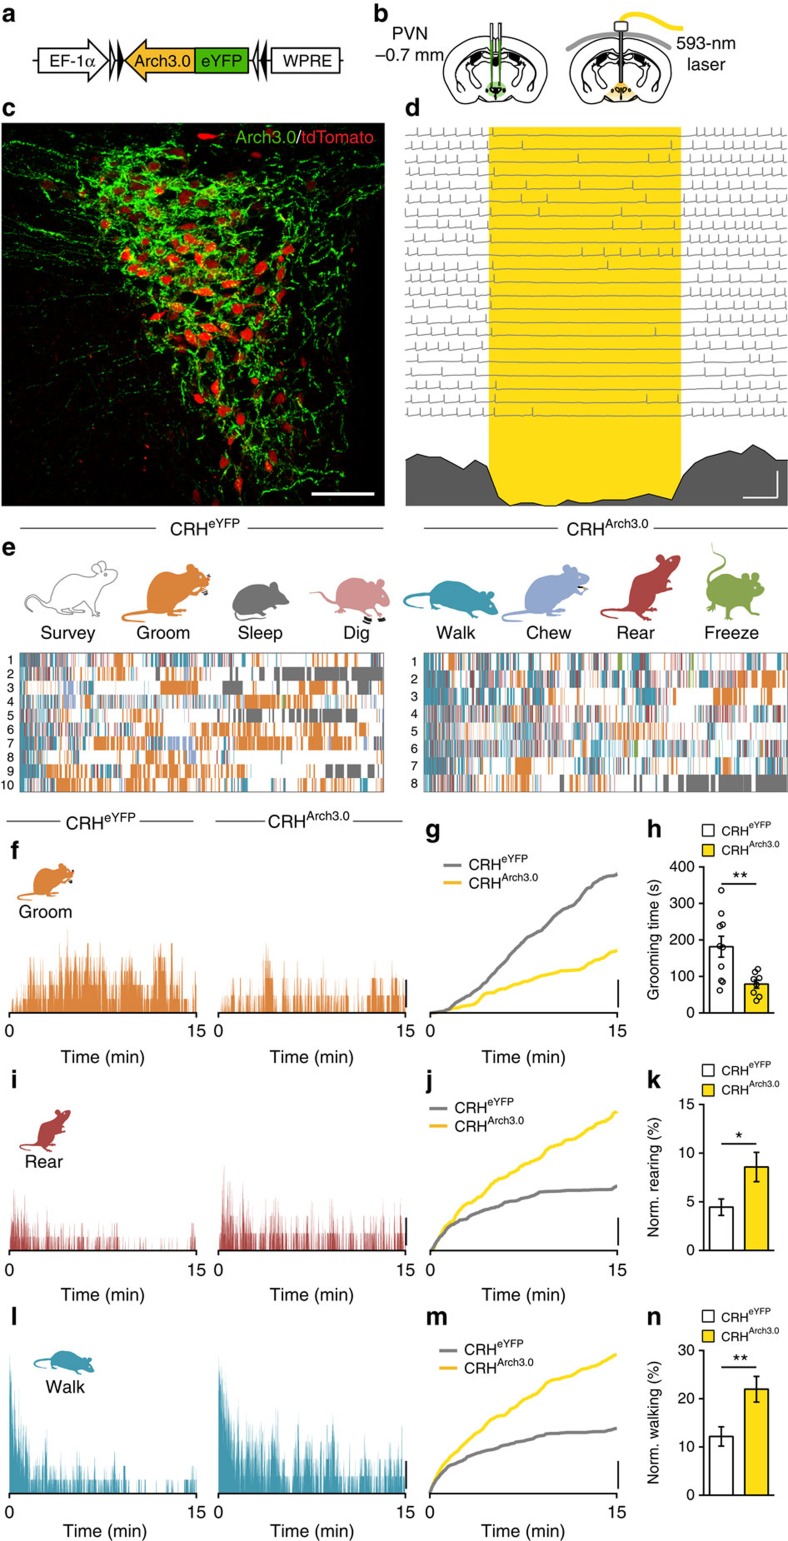
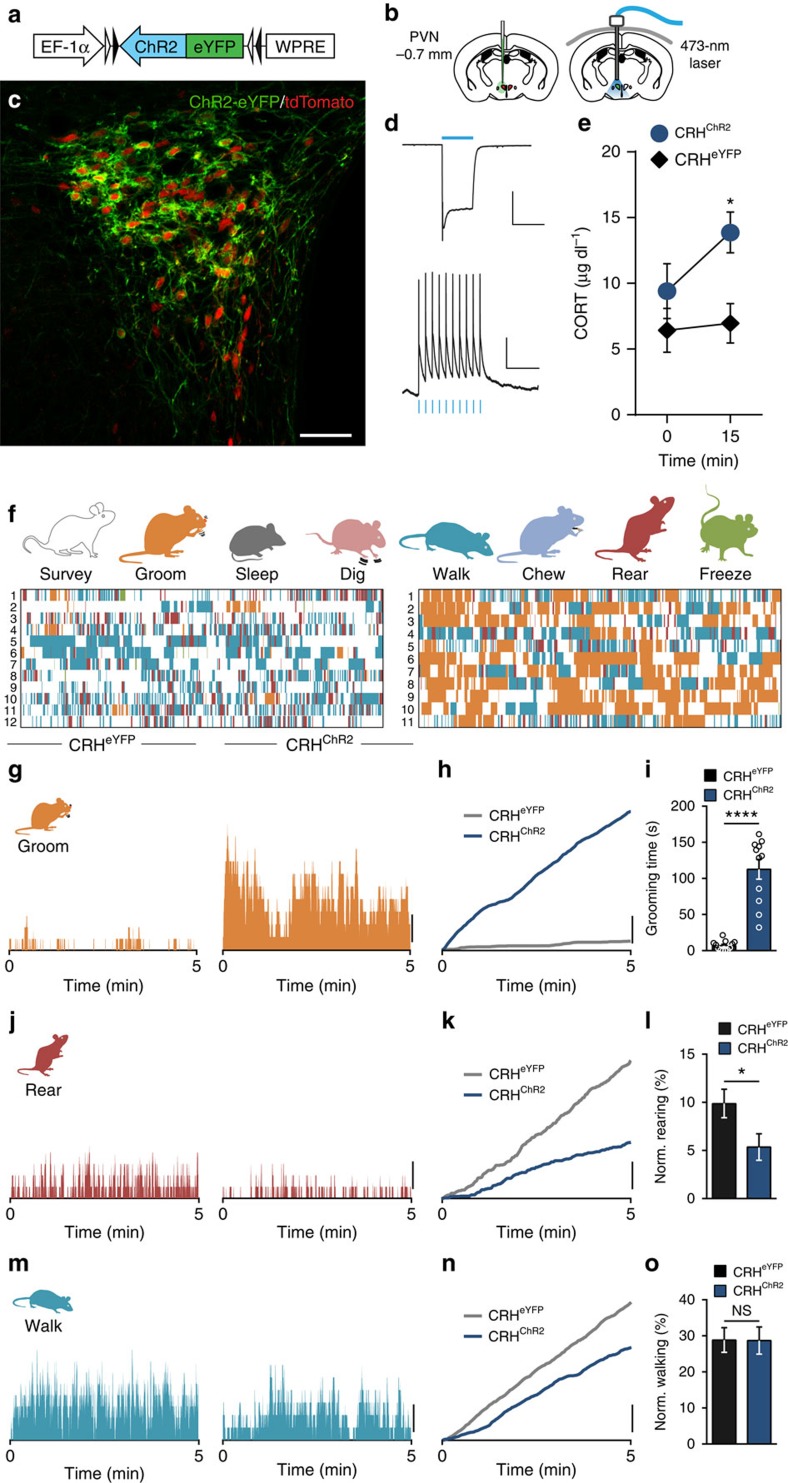
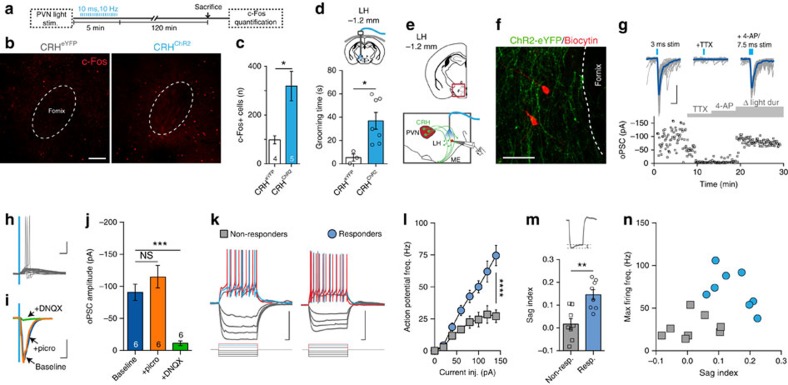
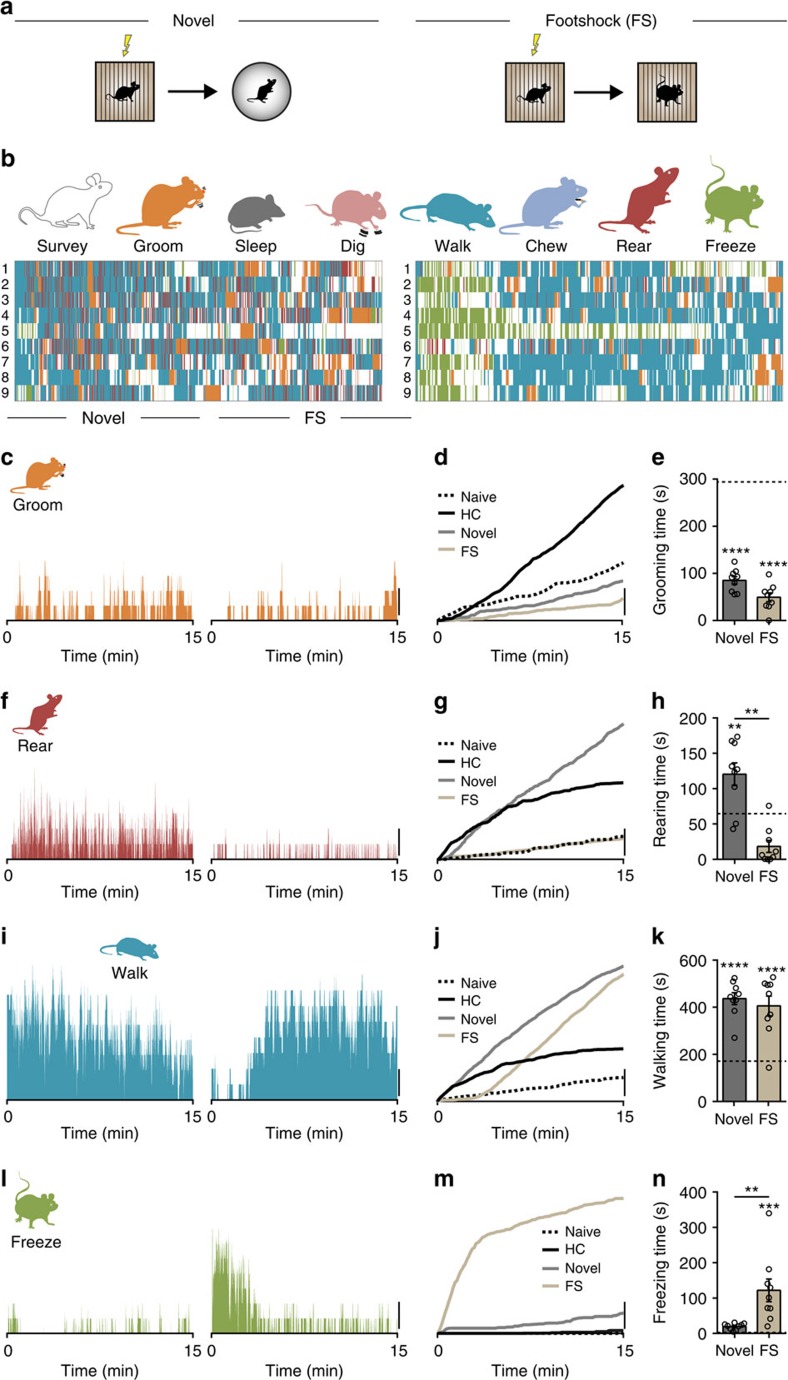
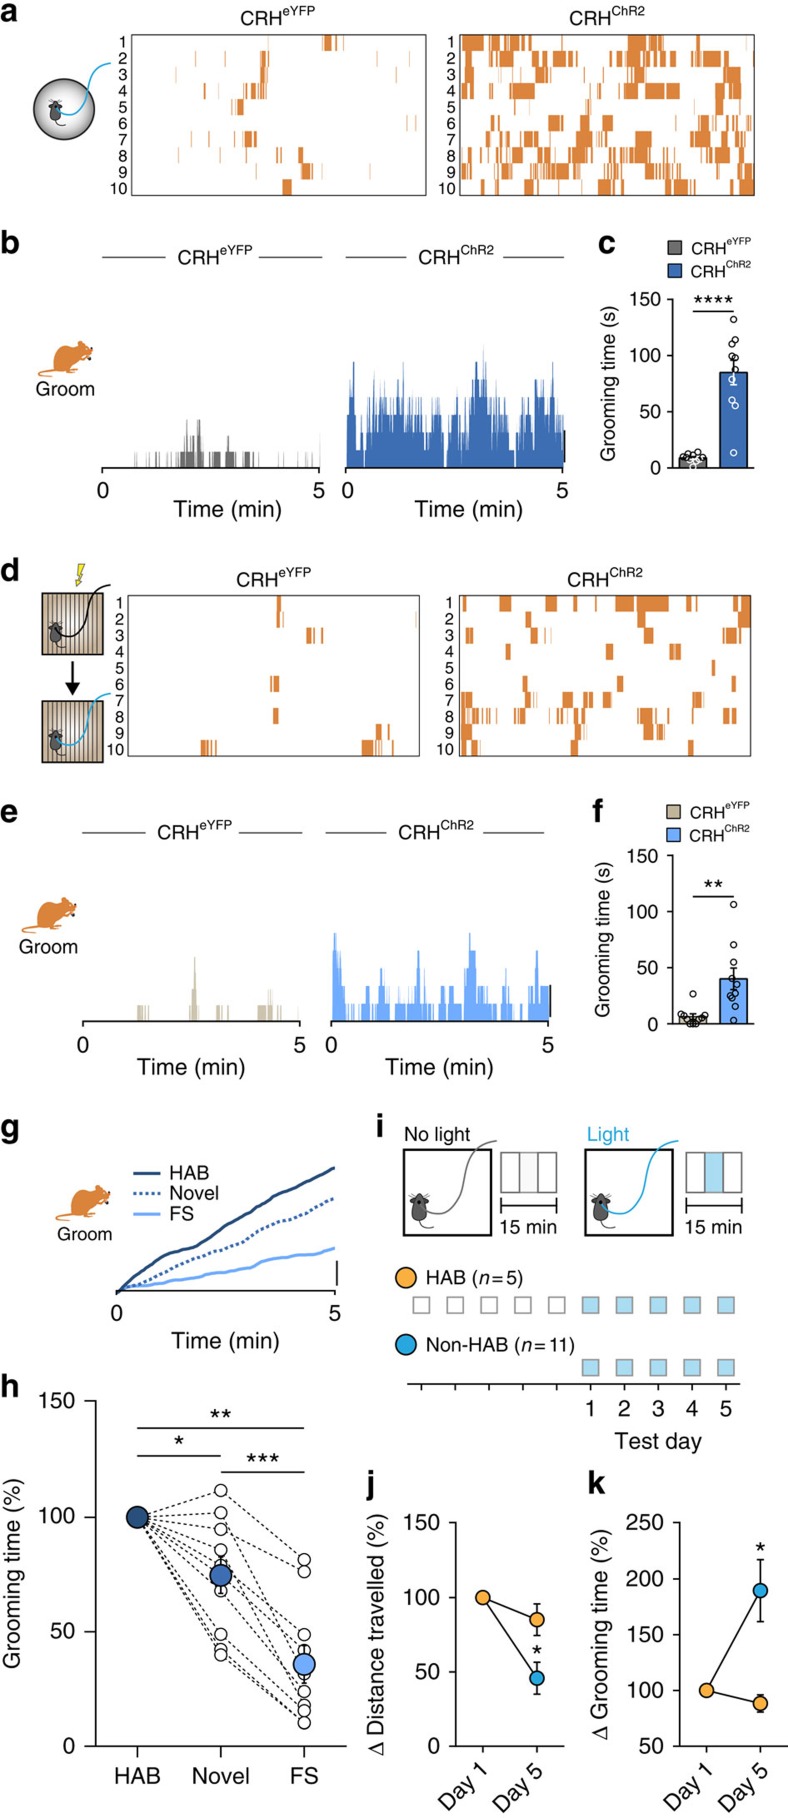
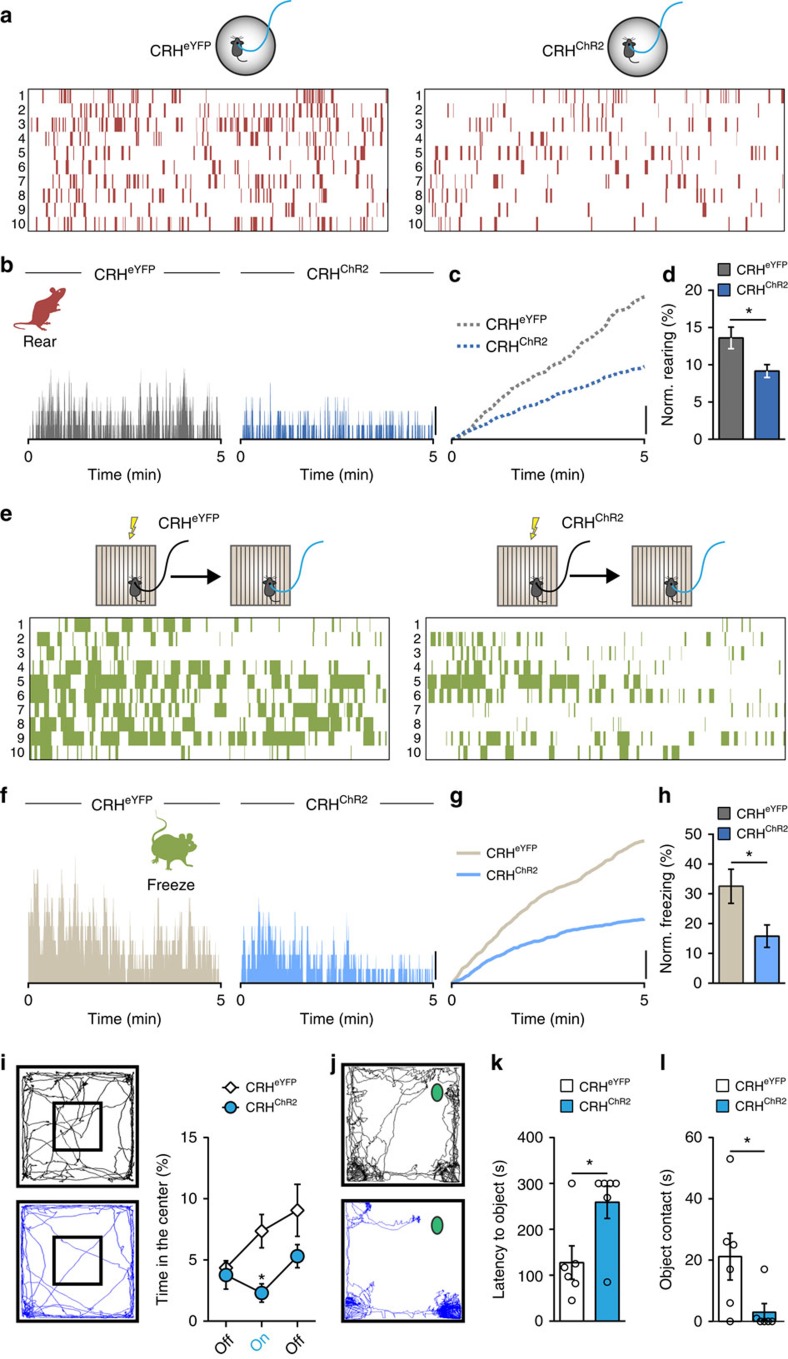
All organisms possess innate behavioural and physiological programmes that ensure survival. In order to have maximum adaptive benefit, these programmes must be sufficiently flexible to account for changes in the environment. Here we show that hypothalamic CRH neurons orchestrate an environmentally flexible repertoire of behaviours that emerge after acute stress in mice. Optical silencing of CRH neurons disrupts the organization of individual behaviours after acute stress. These behavioural patterns shift according to the environment after stress, but this environmental sensitivity is blunted by activation of PVN CRH neurons. These findings provide evidence that PVN CRH cells are part of a previously unexplored circuit that matches precise behavioural patterns to environmental context following stress. Overactivity in this network in the absence of stress may contribute to environmental ambivalence, resulting in context-inappropriate behavioural strategies.


Figures

Figure 1
Figure 1. Distinct and temporally organized behavioural patterns emerge following stress.
(a) Quantification of behavioural activity in 15-min epochs in homecage (HC) of naïve mice and mice immediately after footshock. Eight distinct behaviours are evident in naïve (N, left) and stressed (S, right) mice. Each row represents one mouse. (b) Grooming (naïve: 124.8±33.2 s, n=9 versus stressed: 294.0±33.4 s, n=9; P=0.0024; t-test), rearing (naïve: 19.7±4.8 s, n=9 versus stressed: 64.7±10.0 s, n=9; P=0.0012; t-test) and walking (naïve: 76.4±14.2 s, n=9 versus stressed: 171.4±27.0 s, n=9; P=0.0067; t-test) are increased after stress. Time spent digging (naïve: 122.5±28.9 s, n=9 versus stressed: 7.5±5.0 s, n=9; P=0.0012; t-test) and chewing (naïve: 61.5±21.1 s, n=9 versus stressed: 14.0±7.4 s, n=9; P=0.0492; t-test) are decreased. Surveying (naïve: 369.9±65.1 s, n=9 versus stressed: 282.8±31.6 s, n=9; P=0.2463; t-test), sleeping (naïve: 124.3±85.3 s, n=9 versus stressed: 59.5±44.4 s, n=9; P=0.5096; t-test) and freezing (naïve: 0.6±0.6 s, n=9 versus stressed: 2.6±1.6 s, n=9; P=0.2541; t-test) are unaffected. (ch) Percentage of animals exhibiting stated behaviour at each timepoint and cumulative graphs illustrating the relative extent of grooming (c,d), rearing (e,f) and walking (g,h). Scale bars: ch, 20%; NS, not significant; *P<0.05; **P<0.01; Error bars±s.e.m.
Figure 2
Figure 2. Photoinhibition of PVN CRHArch3.0 neurons disrupts behavioural patterns after stress.
(a) Cre-dependent AAV-DIO-Arch3.0-eYFP virus injected into the PVN. (b) Schematic maps show the injection site (left) and the implantation site of the light ferrule (right). (c) Confocal image shows expression of Arch3.0-eYFP (green) and tdTomato (red) in the PVN. (d) Delivery of yellow light to the slice (denoted by yellow box) decreases firing in PVN CRH neurons in current clamp. Bottom, Summary histogram below of action potentials form repeated trials. (e) Detailed analysis shows all eight behaviours in CRHeYFP (left) and CRHArch3.0 (right) animals in a 15-min epoch immediately after footshock. Each row represents one animal. (f) Histograms show percentage of animals grooming in each group during the 15-min observation period. (g) Cumulative graph illustrates the relative grooming in each condition. (h) Summary graphs show grooming is inhibited during optical inhibition of PVN CRH neurons (CRHeYFP: 181.4±28.7, n=10 versus CRHArch3.0: 79.0±11.2, n=8; P=0.0080; t-test). (i) Histograms show percentage of animals rearing in each group during the 15-min observation period. (j) Cumulative graph illustrates the relative rearing. (k) Rearing time, as a fraction of all non-grooming behaviours, is increased during photoinhibition (CRHeYFP: 4.5±0.8%, n=10 versus CRHArch3.0: 8.6±1.5%, n=8; P=0.0229; t-test). (l) Histograms show percentage walking in each group during the 15-min observation period. (m) Cumulative graph illustrates the relative walking. (n) Fractional walking time is also increased during photoinhibition of PVN CRH neurons (CRHeYFP: 12.2±2.0%, n=10 versus CRHArch3.0: 22.0±2.7%, n=8; P=0.0084; t-test). Scale bars: (c), 50 μm; (d), 2 Hz and 1 s; (f,g,i,j,l,m), 20%; NS, not significant, *P<0.05; **P<0.01; Error bars±s.e.m.
Figure 3
Figure 3. Photostimulation of PVN CRHChR2 neurons triggers behaviours in the absence of stress.
(a) Construct of Cre-dependent AAV-DIO-ChR2-eYFP virus. (b) Schematic maps show the injection of virus into the PVN of CRH-Cre/tdTomato mice (left) and the implantation site of the light ferrule (right). (c) Confocal image shows expression of ChR2-eYFP (green) and tdTomato (red) in the PVN. (d) Optical stimulation in current clamp (top) and voltage clamp (bottom) shows delivery of blue light reliably controls PVN CRH neurons. (e) Blood samples taken before and 15 min after the onset of optical stimulation show increase in CORT levels specifically in CRHChR2 mice (CRHeYFP: 0.528 μg dl−1 increase, n=6; versus CRHChR2: 5.327 μg dl−1 increase, n=5; P=0.0316; t-test). (f) Detailed analysis shows the pattern of eight different behaviours observed in CRHeYFP (left) and CRHChR2 (right) animals during 5 min of optical stimulation in an observational chamber to which mice were previously habituated to in the absence of stress. Each row represents one animal. (g) Histograms show percentage of animals grooming in each group during optical stimulation. (h) Cumulative graph illustrates relative extent grooming. (i) Optical stimulation of PVN CRH neurons increased grooming time (CRHeYFP: 6.8±1.9 s, n=12; versus CRHChR2: 112.6±13.6 s, n=11; P<0.0001; t-test). (j) Histograms show percentage of animals rearing in each group during optical stimulation. (k) Cumulative graph illustrates relative rearing. (l) Rearing time as a fraction of non-grooming behaviours is decreased by photostimulation of CRH neurons (CRHeYFP: 9.9±1.5%, n=12; versus CRHChR2: 5.4±1.4%, n=11; P=0.0396; t-test). (m) Histograms show percentage of animals walking during the optical stimulation. (n) Cumulative graph illustrates relative walking. (o) Fractional walking time is unaltered by optical stimulation (CRHeYFP: 28.8±3.4%, n=12; versus CRHChR2: 28.7±3.8%, n=11; P=0.9784; t-test). Scale bars: c, 50 μm; d, Top: 200 pA and 500 ms, Bottom: 20 mV and 200 ms; (g,h,j,k,m,n), 20%; NS, not significant, *P<0.05; ****P<0.0001; Error bars±s.e.m.
Figure 4
Figure 4. PVN CRH neurons project to the lateral hypothalamus.
(a) Schematic of experimental design. (b) c-Fos-positive cells in LH of CRHeYFP and CRHChR2 following photostimulation in PVN. (c) Summary data of c-Fos in LH (CRHeYFP: 100.5±21.1, n=4 versus CRHChR2: 318.8±60.4, n=5; P=0.0179; t-test). (d) In vivo photostimulation in LH (20hz, 5 min) increases grooming time (CRHeYFP: 5.4±3.0 s, n=3; versus CRHChR2: 36.9±7.3 s, n=7; P=0.0264; t-test). (e) Schematic map and experimental design of in vitro whole-cell recordings from LH neurons. (f) Biocytin filled recorded neurons in LH (red) surrounded by ChR2-eYFP-expressing fibres (green). (g) In voltage clamp (HP=−80 mV), blue light (2–5 ms) elicits fast inward currents (latency: 4.7±0.3 ms) that are abolished by TTX (baseline: 103.1±2.0 pA versus TTX: 4.7±0.7 pA, n=8; P<0.0001; repeated-measures one-way ANOVA) and partially restored by increasing light-pulse duration (7.5–10 ms) during application of 4-aminopyridine (4-AP) (40.1±9.0 pA; P<0.0001 versus baseline; P=0.0222 versus TTX, n=8; repeated-measures one-way ANOVA). (h) Sample traces show effects of optical stimulation on LH neuron firing. (i,j) oPSCs are unaffected by picrotoxin but are potently inhibited by DNQX (baseline: 90.7±12.6 pA, picro: 115.1±17.6 pA, DNQX: 11.3±3.5 pA, n=6; baseline versus DNQX, P=0.0007; repeated-measures one-way ANOVA). (k) Current clamp recordings of LH neurons reveal two distinct electrophysiological profiles. Cells depicted by grey square show no synaptic responses to blue light pulses; blue circle indicates cells with synaptic responses. (l) Action potential frequency–current relationship in responding/non-responding cells (n=16; P<0.0001; two-way ANOVA). (m) Differential hyperpolarization-induced ‘sag' between groups (non-responder: 0.017±0.024, n=8; responder: 0.146±0.022, n=8; P=0.0016; t-test). Sag index calculation: (Vm max—Vm steady state)/Vm max, in response to −80 pA hyperpolarizing step). (n) Firing frequency (+60 pA step) versus sag index in responding and non-responding cells. Scale bars: (b) and (f), 50 μm; (g) and (i), 50 pA and 10 ms; (h) and (k), 50 mV and 50 ms; NS, not significant; *P<0.05; **P<0.01; ***P<0.0005; ****P<0.0001; Error bars,±s.e.m.
Figure 5
Figure 5. Stress-induced behavioural patterns are sensitive to context.
(a) Schematic of experiment showing the two different environments, the novel context (Novel) and footshock chamber (FS) immediately after footshock. (b) Detailed analysis shows the pattern of behaviours exhibited by the animals in different contexts. Each row represents one animal. The different environments change the behavioural pattern expressed by the animal. (c) Percentage of animals grooming at each timepoint. (d) Cumulative graphs illustrate the relative grooming in different contexts including homecage (HC) immediately after stress and compared with naïve mice (Fig. 1). (e) Grooming is the dominant in HC (dotted line represents mean grooming time in HC; Novel: 85.1±8.0 s; FS: 49.3±9.4 s; Novel versus HC P<0.0001; FS versus HC P<0.0001; n=9 in each group; one-way ANOVA). (f) Percentage of animals rearing at each timepoint. (g) Cumulative graphs illustrate the relative amount of rearing in different contexts including HC immediately after stress and the naïve mice (Fig. 1). (h) Mice spend more time rearing in Novel (dotted line represents mean rearing time in HC; Novel: 120.4±16.0 s; FS: 18.3±8.5 s; Novel versus HC P=0.0097; Novel versus FS P<0.0001; n=9 in each group; one-way ANOVA). (i) Percentage of animals walking at each timepoint. (j) Cumulative graphs illustrate the relative walking time in different contexts including HC immediately after stress and in naïve mice (Fig. 1). (k) Mice spend the same amount of time walking in Novel and FS (dotted line represents mean walking time in HC; Novel: 436.7±25.2 s; FS: 405.6±41.7 s; Novel versus HC P<0.0001; FS versus HC P<0.0001; n=9 in each group; one-way ANOVA). (l) Percentage of animals freezing at each timepoint. (m) Cumulative graphs illustrate the relative freezing in different contexts including HC immediately after stress and the naïve mice (Fig. 1). (n) Freezing behaviour was only significant in FS (dotted line represents mean freezing time in HC; Novel: 19.5±3.0 s; FS: 121.8±32.0 s; Novel versus FS P=0.0021; FS versus HC P=0.0004; n=9 in each group; one-way ANOVA). Scale bars: (c,d,f,g,i,j,l,m), 20%; **P<0.01; ***P<0.0005; ****P<0.0001; Error bars±s.e.m.
Figure 6
Figure 6. Photostimulation-induced grooming is sensitive to the context.
(ah) Identical light delivery protocol (10 hz for 5 min) used in novel environment (Novel) and in the FS immediately after footshock stress. (ac) Photostimulation of PVN CRH neurons in Novel. (a) Each row represents an individual animal. (b) Histogram showing percentage of animals grooming. (c) Quantification of grooming in Novel (CRHeYFP: 8.9±1.2 s, n=10; versus CRHChR2: 85.0±10.9 s, n=10; P<0.0001; t-test). (df) Optical stimulation of PVN CRH neurons in FS. (d) Each row represents an individual animal. (e) Histogram showing percentage of animals grooming. (f) Quantification of grooming in FS (CRHeYFP: 6.4±2.5 s, n=10; versus CRHChR2: 40.1±9.5 s, n=10; P=0.0031; t-test). (g) Cumulative graphs illustrate the relative effect of different contexts on optically evoked grooming including habituated (HAB) context (data shown in Fig. 3). (h) Optically evoked grooming time is gradually attenuated as the presumptive threat level of the context increases (Novel: 74.7±7.9% of HAB, P=0.0405 versus HAB; FS: 35.8±8.3% of HAB, P=0.0013 versus HAB, P=0.0006 versus Novel; n=10; repeated-measures one-way ANOVA). (i) Schematic of experiment showing effects of habituation on ChR2-induced grooming. (j) Increased familiarity in the paradigm causes a decrease in baseline locomotion distance in the arena in the non-HAB (day 5: 45.79±10.78% of day 1, n=11; P=0.0004 versus day 1; paired t-test), but not in the HAB animals (day 5: 85.13±10.62% of day 1, n=5; P=0.21 versus day 1, paired t-test; P=0.0431 versus non-HAB, t-test). (k) Optically evoked grooming time is higher on the fifth day in non-HAB mice (day 5: 189.6±27.8% compared with the day 1, n=11; P=0.0016; paired t-test). In contrast, HAB animals show invariant response to optical activation (day 5: 88.5±7.7% compared with day 1; n=5, P=0.323 versus day1, paired t-test; P=0.0316 versus Non-HAB, t-test). Scale bars: (b,e,g), 20%; *P<0.05; **P<0.01; ***P<0.0005; ****P<0.0001. Error bars±s.e.m.
Figure 7
Figure 7. Photostimulation of PVN CRHChR2 neurons overrides contextual cues.
(ad) Optical stimulation of PVN CRH neurons attenuates rearing in novel environment (Novel). (a) Each row represents an individual animal. (b) Histograms showing percentage of animals rearing. (c) Cumulative graphs demonstrate the relative extent of rearing. (d) Rearing time as a fraction of all behaviours after exclusion of time spent grooming (CRHeYFP: 13.6±1.4%, n=10; versus CRHChR2: 9.2±0.9%, n=10; P=0.0165; t-test). (eh) Optical stimulation of PVN CRH neurons disrupts freezing in FS. (e) Each row represents an individual animal. (f) Histograms show percentage of animals freezing. (g) Cumulative graphs demonstrate the relative extent of freezing. (h) Quantification of fractional freezing time if time spent grooming is excluded from the analysis (CRHeYFP: 32.5±5.7%, n=10; versus CRHChR2: 15.8±3.8%, n=10; P=0.0251; t-test). (i) Assessment of locomotion in an open field test. Representative locomotor trajectory plots during optical stimulation in CRHeYFP (black) and CRHChR2 (blue) mice. Accompanying graph shows CRHChR2 mice spend significantly less time spent in the centre zone during photostimulation (CRHeYFP: before: 3.9±0.5%, during: 6.1±0.5%. after: 6.6±0.9, n=16; versus CRHChR2: before: 4.3±1.0%, during: 3.3±0.8%, after: 5.3±0.8%, n=14; CRHeYFP during versus CRHChR2 during, P=0.0291; repeated-measures two-way ANOVA). (j) Representative locomotor trajectory plots during optical stimulation in CRHeYFP (black) and CRHChR2 (blue) mice in a novel object (green shape) test. Optical stimulation reduces exploration of a novel object as measured by the latency to touch (k, CRHeYFP: 127.7±36.4 s, n=6; versus CRHChR2: 259.0±35.2 s, n=6; P=0.0267; t-test) and the time spent in close proximity (l, CRHeYFP: 21.2±7.6 s, n=6; versus CRHChR2: 3.0±2.8 s, n=6; P=0.0494; t-test). Scale bars: (b,c,f,g), 20%; *P<0.05; Error bars±s.e.m.

References

    1. Cannon W. B. Bodily Changes in Pain, Hunger, Fear, and Rage Appleton (1915).
    1. Selye H. A syndrome produced by diverse nocuous agents. Nature 138, 32 (1936). - PubMed
    1. Blanchard D. C., Blanchard R. J. & Griebel G. Defensive responses to predator threat in the rat and mouse. Curr. Protoc. Neurosci Chapter 8, Unit 8.19 (2005). - PubMed
    1. Mongeau R., Miller G. A., Chiang E. & Anderson D. J. Neural correlates of competing fear behaviors evoked by an innately aversive stimulus. J. Neurosci. 23, 3855–3868 (2003). - PMC - PubMed
    1. Blanchard D. C., Griebel G., Pobbe R. & Blanchard R. J. Risk assessment as an evolved threat detection and analysis process. Neurosci. Biobehav. Rev. 35, 991–998 (2011). - PubMed

Publication types

MeSH terms

Substances