. 2016 Jun 16:6:28290.
doi: 10.1038/srep28290.

IgE-mediated enhancement of CD4(+) T cell responses requires antigen presentation by CD8α(-) conventional dendritic cells

Affiliations

IgE-mediated enhancement of CD4(+) T cell responses requires antigen presentation by CD8α(-) conventional dendritic cells

Zhoujie Ding et al. Sci Rep. .

Abstract

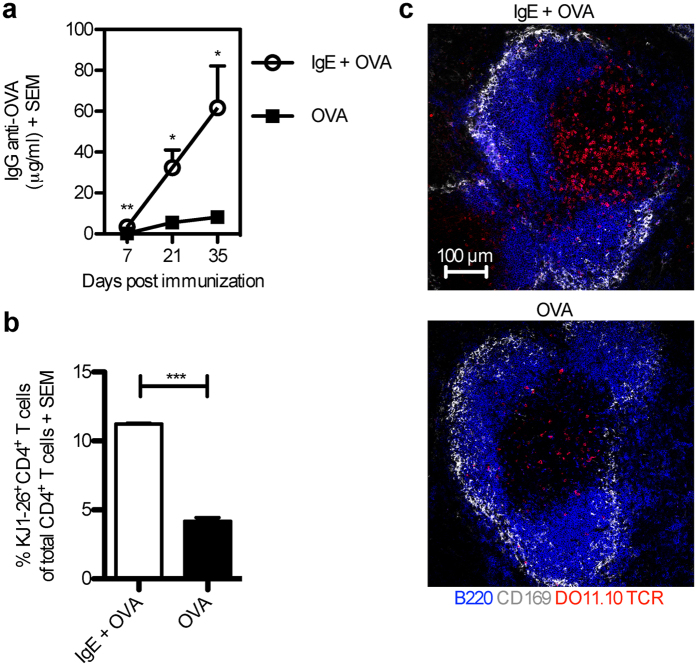
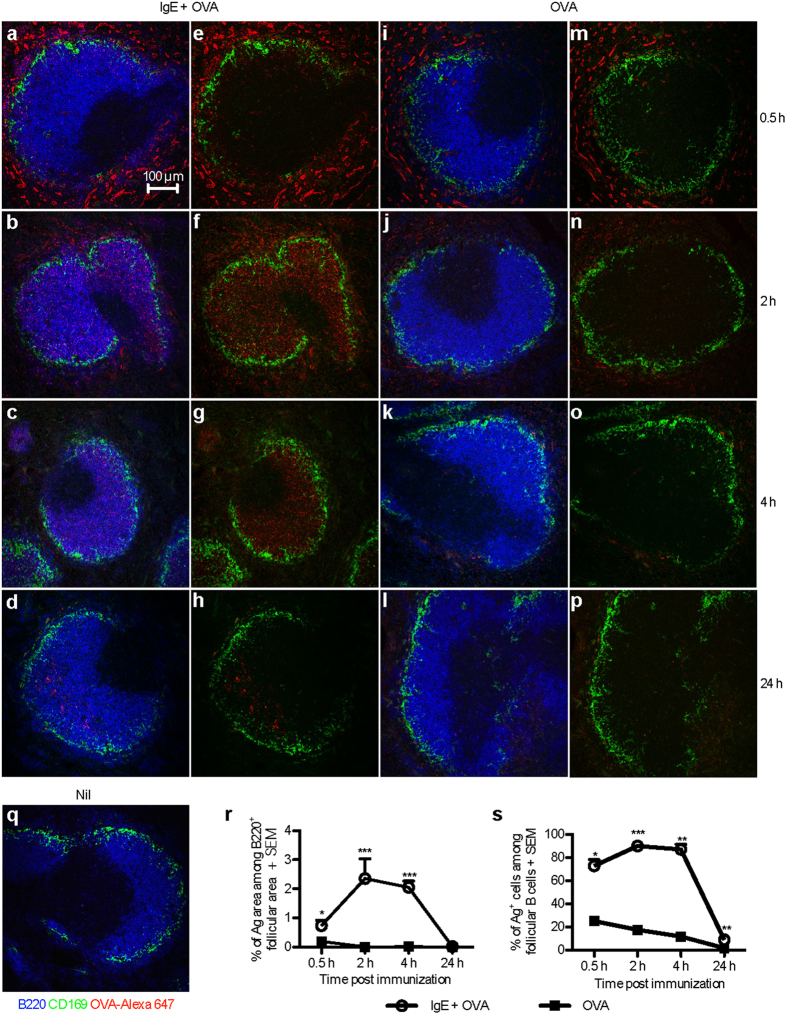
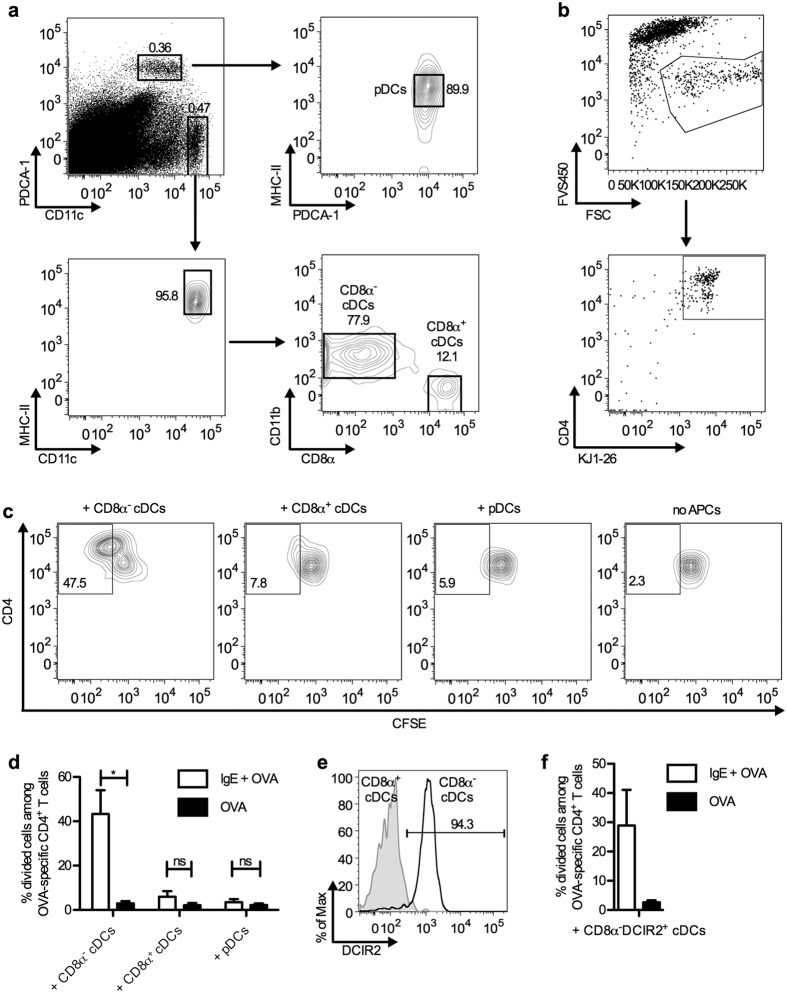
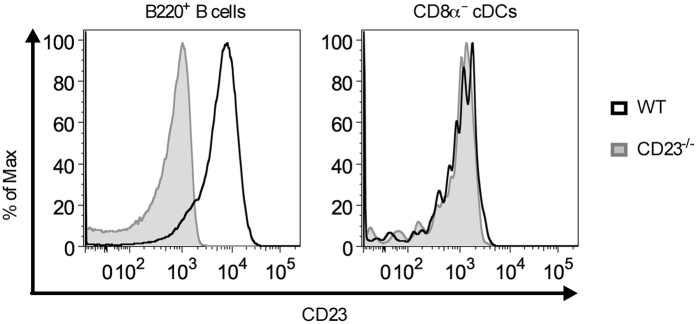
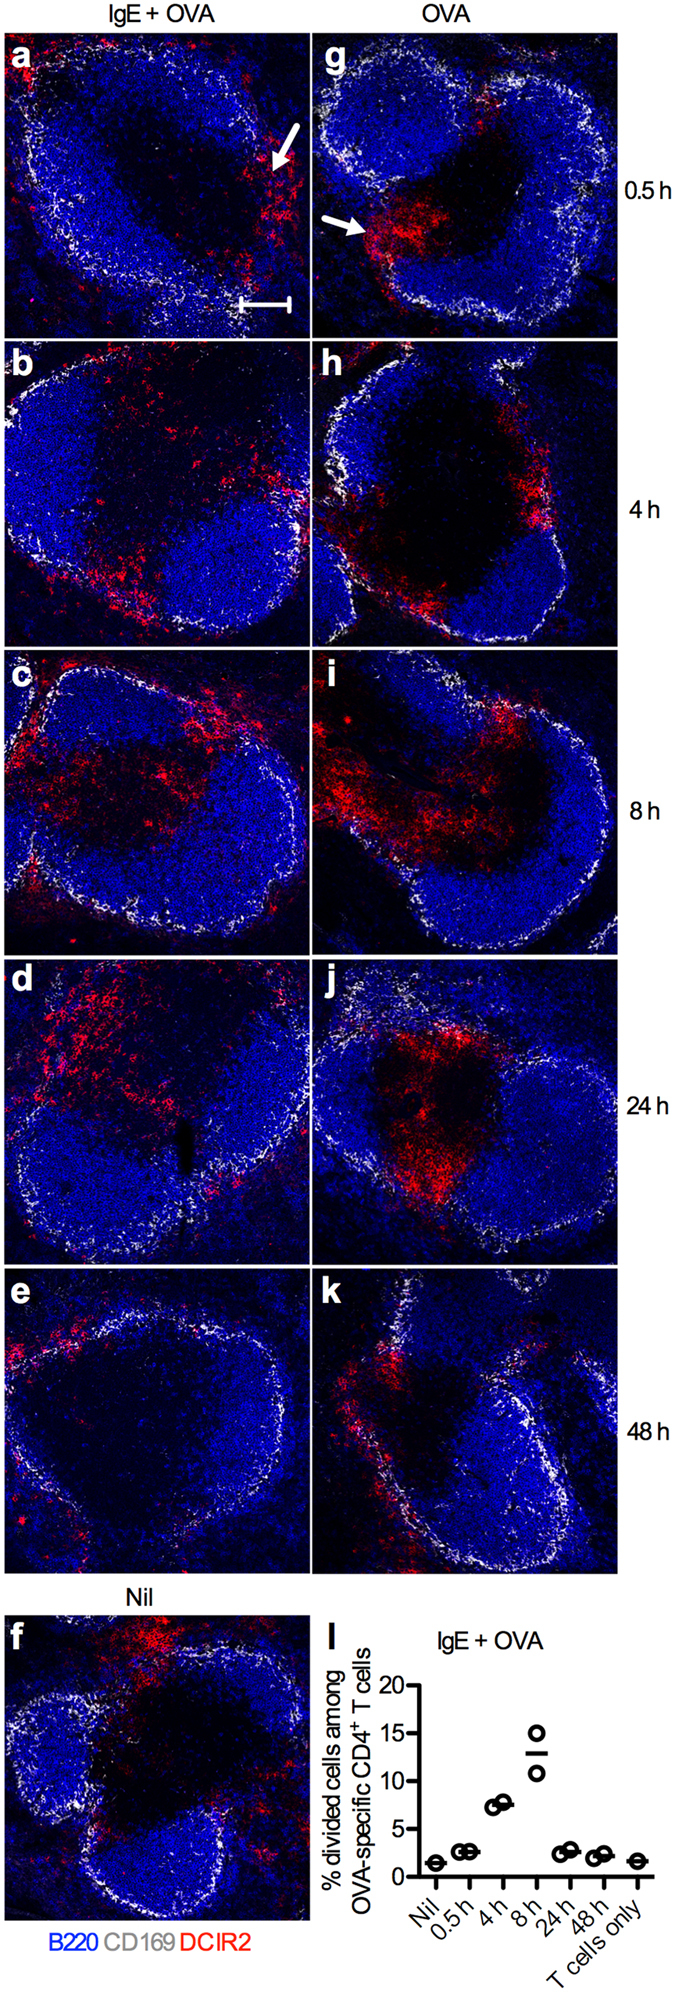
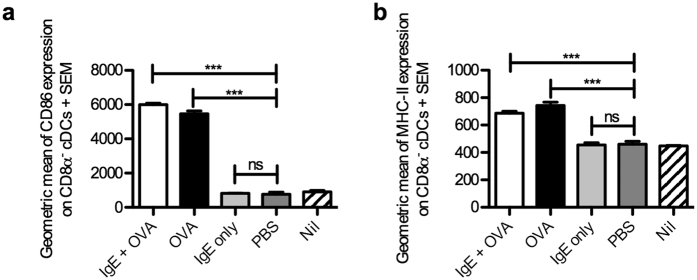
IgE, forming an immune complex with small proteins, can enhance the specific antibody and CD4(+) T cell responses in vivo. The effects require the presence of CD23 (Fcε-receptor II)(+) B cells, which capture IgE-complexed antigens (Ag) in the circulation and transport them to splenic B cell follicles. In addition, also CD11c(+) cells, which do not express CD23, are required for IgE-mediated enhancement of T cell responses. This suggests that some type of dendritic cell obtains IgE-Ag complexes from B cells and presents antigenic peptides to T cells. To elucidate the nature of this dendritic cell, mice were immunized with ovalbumin (OVA)-specific IgE and OVA, and different populations of CD11c(+) cells, obtained from the spleens four hours after immunization, were tested for their ability to present OVA. CD8α(-) conventional dendritic cells (cDCs) were much more efficient in inducing specific CD4(+) T cell proliferation ex vivo than were CD8α(+) cDCs or plasmacytoid dendritic cells. Thus, IgE-Ag complexes administered intravenously are rapidly transported to the spleen by recirculating B cells where they are delivered to CD8α(-) cDCs which induce proliferation of CD4(+) T cells.


Figures

Figure 1
Figure 1. IgE anti-OVA enhances both OVA-specific IgG and CD4+ T cell responses.
(a) BALB/c mice were immunized with 50 μg IgE anti-OVA pre-mixed with 20 μg OVA (n = 7), or 20 μg OVA alone (n = 7). Sera from d 7, 21, and 35 after immunization were analysed for IgG anti-OVA by ELISA. (b) BALB/c mice were adoptively transferred with splenocytes from DO11.10 mice one day before administration of 50 μg IgE anti-OVA pre-mixed with 20 μg OVA (n = 3) or 20 μg OVA alone (n = 3). Spleens were harvested 3 days after immunization and half of each spleen was analysed for proliferation of OVA-specific CD4+ T cells by flow cytometry. The gating strategy is shown in Supplementary Fig. S2. Percentages of KJ1-26+CD4+ T cells among total CD4+ T cells of each group were then quantified. (c) The other half of each spleen as in (b) was frozen and spleen sections were stained and analysed by confocal microscopy. B220, blue; CD169, grey; DO11.10 TCR, red. Images show T cell areas (640 μm × 640 μm) representative of 6 T cell zones from 2 non-consecutive sections per sample in each group. Scale bar represents 100 μm. (a,b) Data are representative of three independent experiments and are shown as mean + SEM. Significance was determined between the group immunized with IgE-OVA complexes and the group immunized with OVA alone by Student’s t-test. *p < 0.05; **p < 0.01; ***p < 0.001.
Figure 2
Figure 2. OVA administered together with specific IgE is rapidly transported to splenic B cell follicles.
BALB/c mice were immunized with 50 μg IgE anti-OVA pre-mixed with 150 μg OVA-Alexa 647 (n = 2 per time point) (a–h), 150 μg OVA-Alexa 647 alone (n = 2 per time point) (i–p), or left unimmunized (q). Spleens were harvested 0.5, 2, 4, or 24 h after immunization. Non-consecutive sections of spleens were stained and analysed by confocal microscopy. B220+ B cells, blue; CD169+ metallophilic macrophages, green; OVA-Alexa 647, red. (a–d,i–l,q) All colors are shown. (e–h,m–p) All colors expect blue are shown. (a–q) Images show follicular areas (640 μm × 640 μm) representative of 3–4 follicular areas from 2 non-consecutive sections per sample in each group. Scale bar represents 100 μm. Data represent one experiment at 0.5 h and 2 h and two experiments at 4 h and 24 h. (r) Quantification of the Ag+ area within the B220+ follicular area. (s) Percentages of Ag+ cells among follicular B cells was analysed by flow cytometry on splenocytes from the other half of each spleen in (a–p). Follicular B cells are gated as B220+CD21+CD23high cells (Supplementary Fig. S3). (r,s) Data are shown as mean + SEM. Significance was determined between the group immunized with IgE-OVA complexes and the group immunized with OVA alone by Student’s t-test. *p < 0.05; ***p < 0.001.
Figure 3
Figure 3. CD8α cDCs/CD8αDCIR2+ cDCs are the cells primarily presenting IgE-complexed Ag to specific CD4+ T cells.
BALB/c mice were immunized with 250 μg IgE anti-OVA pre-mixed with 100 μg OVA, or with 100 μg OVA. Four hours after immunization, their spleens were harvested and the splenocytes were sorted into different APC populations: (a) CD8α cDCs (PDCA-1CD11chighMHC-IIhighCD11b+CD8α), CD8α+ cDCs (PDCA-1CD11chighMHC-IIhighCD11bCD8α+) and pDCs (PDCA-1+CD11cintMHC-IIint), or (e) CD8αDCIR2+ cDCs (first gated for CD8α cDCs as above and then on DCIR2). Each of these APC populations was co-cultured with 5000 CFSE-labeled CD4+ T cells from DO11.10 spleens. After incubation at 37 °C for 3 days, the number of proliferating T cells was determined by flow cytometry measuring CFSE dilution (divided cells) among OVA-specific CD4+ T cells. (b) Gating of OVA-specific CD4+ T cells. Dead cells were excluded by FVS450 staining. OVA-specific CD4+ T cells were gated as CD4+KJ1-26+ among live cells. (c) Gating of divided cells among OVA-specific CD4+ T cells. Numbers indicate percentages of divided cells among OVA-specific CD4+ T cells. CD4+ T cells cultured without APC were used as negative controls. (d,f) Percentages of divided cells among OVA-specific CD4+ T cells, incubated with the indicated APCs. Data are pooled from three independent experiments using 5000 or 1200 CD8α cDCs, CD8α+ cDCs, or pDCs as APCs (d) and from two independent experiments using 5000 CD8αDCIR2+ cDCs (f). Data are shown as mean + SEM. Significance was determined between the groups immunized with IgE-OVA complexes and OVA alone by Student’s t-test. *p < 0.05; no significance (ns), p > 0.05.
Figure 4
Figure 4. CD8α cDCs do not express CD23.
Splenocytes from naïve wildtype (WT) BALB/c or CD23−/− mice were stained and analysed by flow cytometry. B220+ B cells (B220+CD11c) were gated as in Supplementary Fig. S4. CD8α cDCs were gated as in Fig. 3a. The expression of CD23 on B220+ B cells (left panel) and CD8α cDCs (PDCA-1CD11chighMHC-IIhighCD11b+CD8α; right panel) from the same wildtype or CD23−/− mouse are shown as histograms. Data are representative of two independent experiments with 2–3 mice of each strain in each experiment.
Figure 5
Figure 5. DCIR2+ cDCs migrate from the marginal zone bridging channel to the T cell zone after immunization.
Spleens from BALB/c mice (n = 2 per time point) immunized with 250 μg IgE anti-OVA pre-mixed with 100 μg OVA or with 100 μg OVA alone were harvested after 0.5, 4, 8, 24, or 48 h. One unimmunized mouse (Nil) was used as control. (a–k) Half of each spleen was snap-frozen and non-consecutive spleen sections were stained and analyzed by confocal microscopy. Localization of DCIR2+ cDCs in spleens harvested at indicated time points after immunization was followed. B220+ B cells, blue; CD169+ metallophilic macrophages, grey; DCIR2+ cDCs, red. Marginal zone bridging channels are indicated with arrows in (a,g). Images show representative areas (640 μm × 640 μm) of 3–4 T cell zones from 2 non-consecutive sections of each sample in every group. Scale bar represents 100 μm. Data represent one experiment where mice were immunized with IgE-OVA or OVA alone and one where they were immunized with IgE-OVA. (l) The other halves of the spleens from mice immunized with IgE-OVA complexes in (a–e) were prepared into single cell suspensions and 6 × 105 cells were used as APCs in co-cultures with 105 CFSE-labeled CD4+ T cells isolated from DO11.10 splenocytes. Percentages of divided cells among OVA-specific CD4+ T cells after incubation for 3 days with APCs taken from an unimmunized mouse (Nil) or from mice immunized with IgE-OVA complexes are quantified by flow cytometry as shown in Fig. 3. CD4+ T cells cultured alone were used as negative control. Each circle represents one mouse and the lines represent the mean values.
Figure 6
Figure 6. CD86 and MHC-II expression on CD8α cDCs 8 h after immunization.
BALB/c mice were immunized with 250 μg IgE anti-OVA pre-mixed with 100 μg OVA (n = 3), 100 μg OVA alone (n = 3), 250 μg IgE anti-OVA alone (n = 3) or with PBS (n = 3). Mice left unimmunized (Nil) were used as negative control (n = 3). Spleens were harvested 8 h after immunization and prepared for flow cytometry analysis. CD8α cDCs were gated as in Fig. 3a (except that MHC-II was not used in the gating strategy when MHC-II expression was quantified). Geometric means of CD86 (a) or MHC-II (b) expression on CD8α cDCs from all groups were quantified. Data are representative of two independent experiments (except for the IgE alone-group which was only analysed in the experiment shown) and are shown as mean + SEM. Significance was determined between the groups immunized with IgE-OVA complexes, OVA alone or IgE and PBS by Student’s t-test. ***p < 0.01; no significance (ns), p > 0.05.

Similar articles

Cited by

References

    1. Heyman B. Regulation of antibody responses via antibodies, complement, and Fc receptors. Annu. Rev. Immunol. 18, 709–737 (2000). - PubMed
    1. Heyman B., Tianmin L. & Gustavsson S. In vivo enhancement of the specific antibody response via the low-affinity receptor for IgE. Eur. J. Immunol. 23, 1739–1742 (1993). - PubMed
    1. Gustavsson S., Hjulström S., Liu T. & Heyman B. CD23/IgE-mediated regulation of the specific antibody response in vivo. J. Immunol. 152, 4793–4800 (1994). - PubMed
    1. Fujiwara H. et al.. The absence of IgE antibody-mediated augmentation of immune responses in CD23-deficient mice. Proc. Natl. Acad. Sci. USA 91, 6835–6839 (1994). - PMC - PubMed
    1. Getahun A., Hjelm F. & Heyman B. IgE enhances antibody and T cell responses in vivo via CD23+ B cells. J. Immunol. 175, 1473–1482 (2005). - PubMed

Publication types