. 2016 Jun 15;8(343):343ra82.
doi: 10.1126/scitranslmed.aad7121.

Antibiotics, birth mode, and diet shape microbiome maturation during early life

Affiliations

Antibiotics, birth mode, and diet shape microbiome maturation during early life

Nicholas A Bokulich et al. Sci Transl Med. .

Abstract

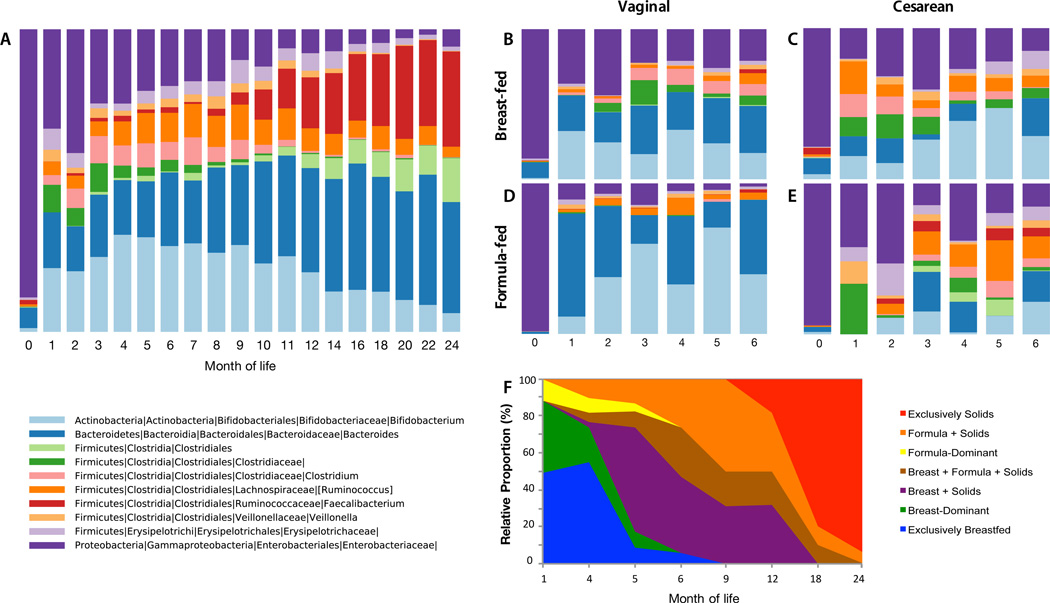
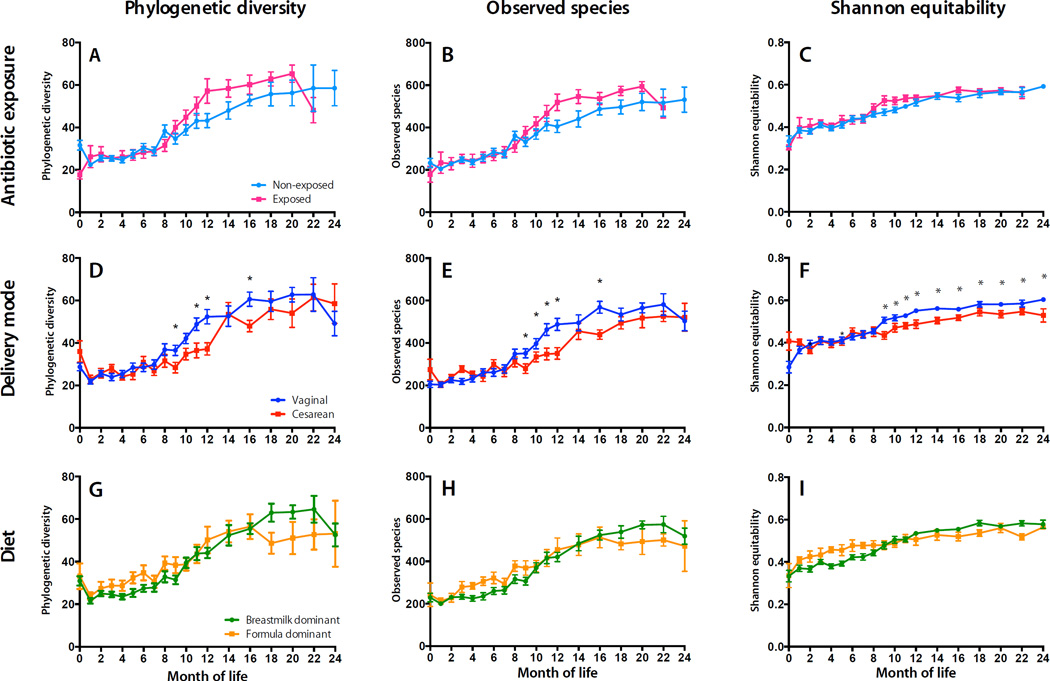
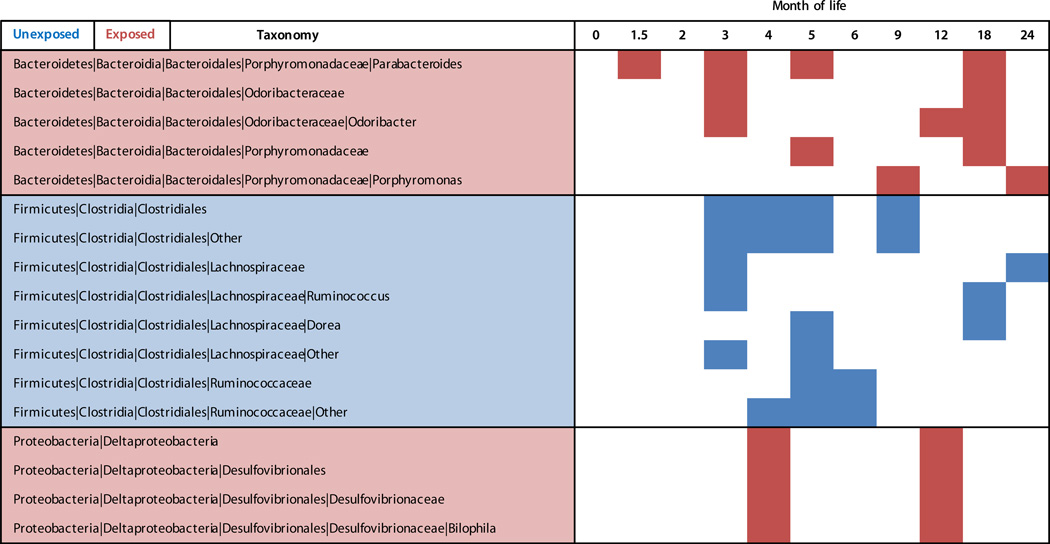
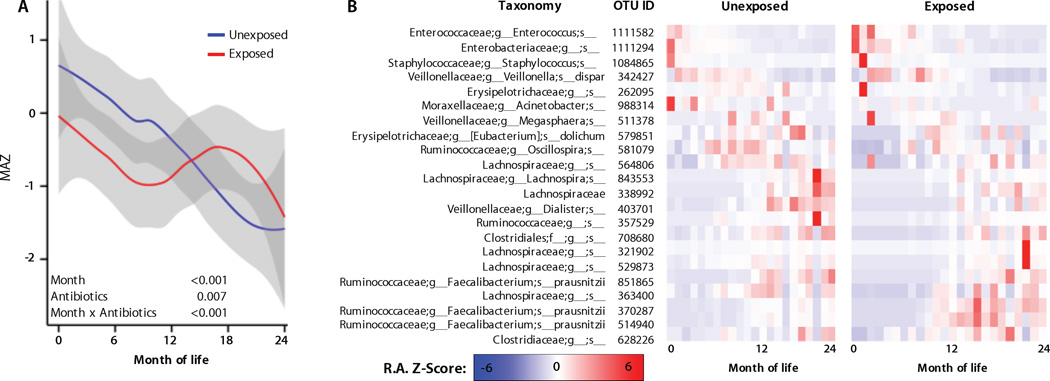
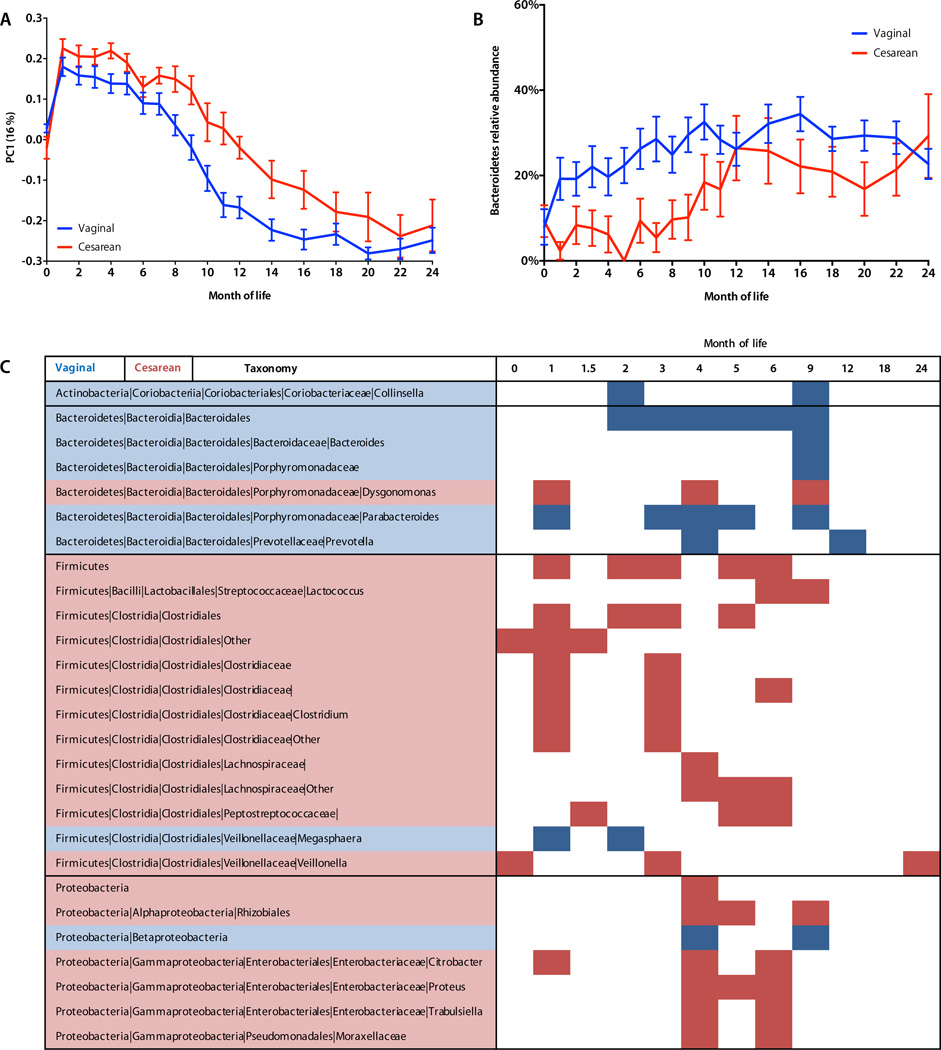
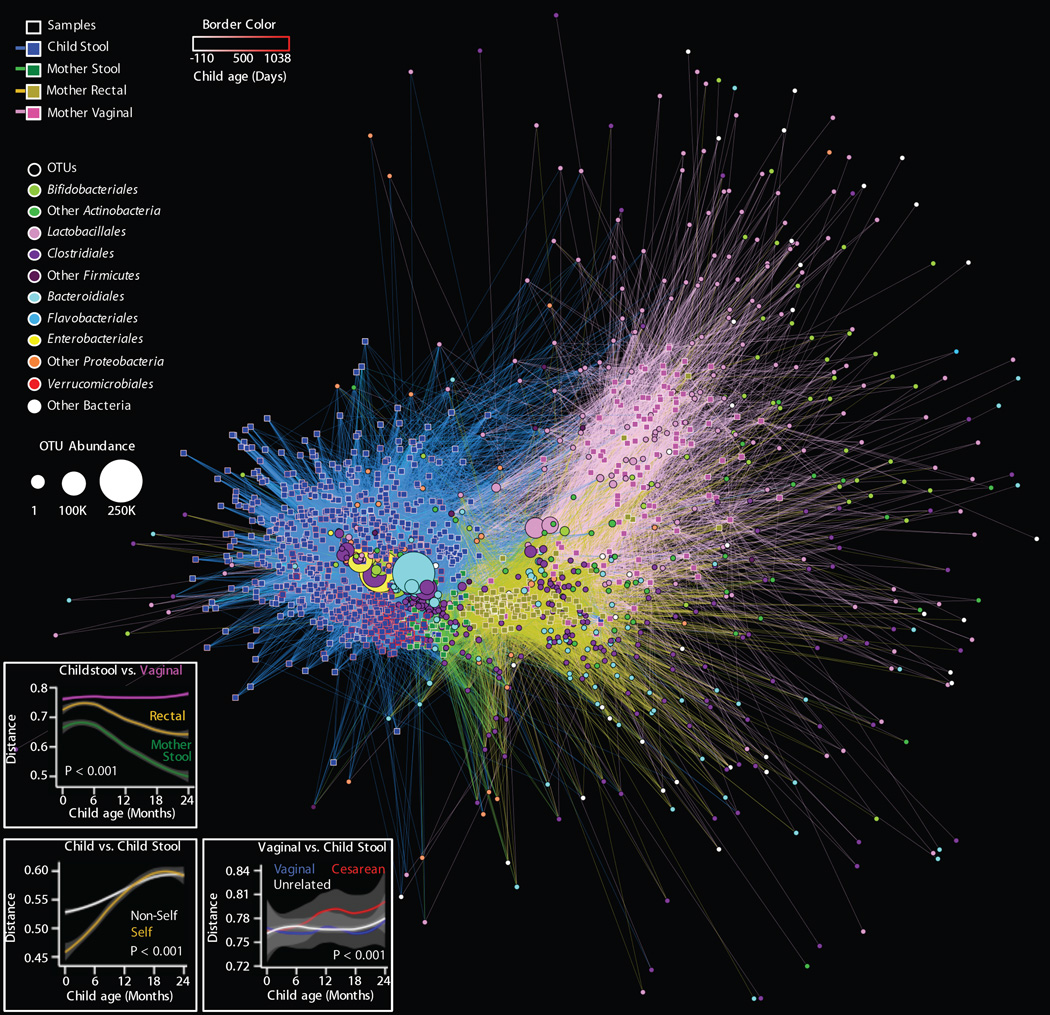
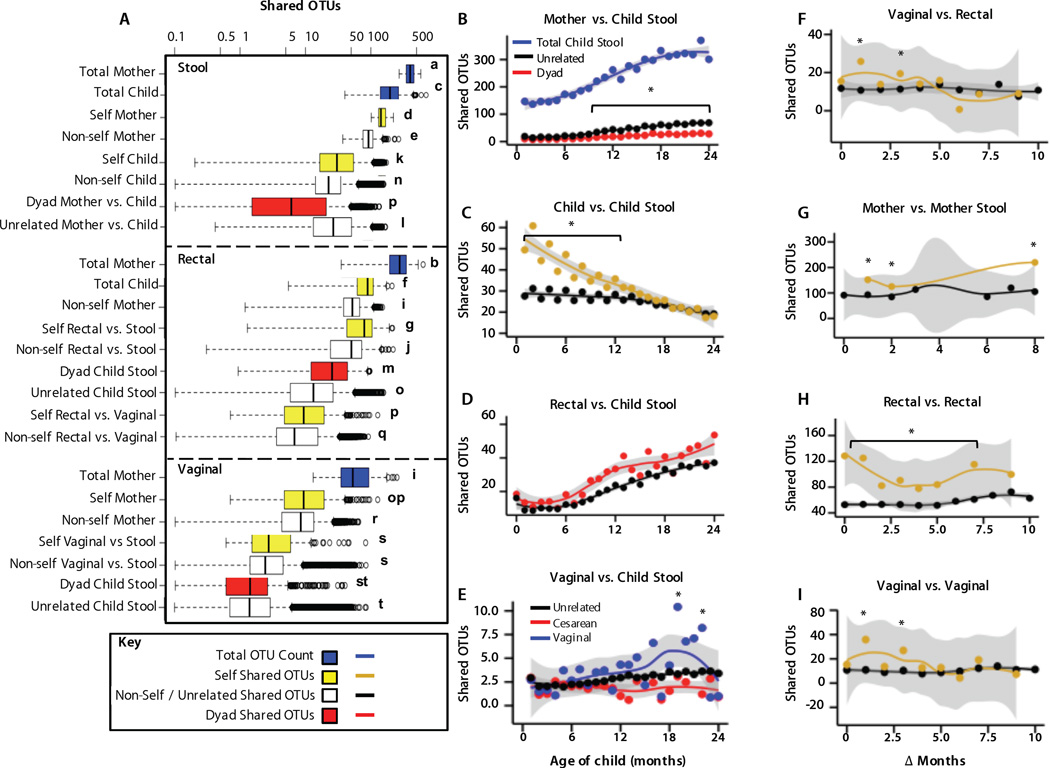
Early childhood is a critical stage for the foundation and development of both the microbiome and host. Early-life antibiotic exposures, cesarean section, and formula feeding could disrupt microbiome establishment and adversely affect health later in life. We profiled microbial development during the first 2 years of life in a cohort of 43 U.S. infants and identified multiple disturbances associated with antibiotic exposures, cesarean section, and formula feeding. These exposures contributed to altered establishment of maternal bacteria, delayed microbiome development, and altered α-diversity. These findings illustrate the complexity of early-life microbiome development and its sensitivity to perturbation.


Figures

Fig. 1
Fig. 1. Microbial and dietary succession viewed over the first two years of life
Mean relative abundance of fecal bacteria at the genus level at each month of life, for taxa with ≥1% mean relative abundance across all samples. Panel A. All subjects, first 2 years. Panels B–E: The first 6 months of life for the 32 subjects who were not antibiotic-exposed, organized by delivery mode [Vaginal (V), or Cesarean (C)], and predominant feeding mode [Breast (B), Formula (F). Group n’s are: V-B (15), C-B (7), V-F (3), C-F (7). Panel F: Dietary trends in all infants across the study period.
Fig. 2
Fig. 2. α-Diversity over the first two years of life in relation to early-life exposures
Left column, Mean Phylogenetic Diversity (PD) ± SEM; second column, Mean observed OTUs ± SEM; third column, Mean Shannon Equitability (evenness) ± SEM. α-Diversity levels are shown for antibiotic use (Panels A-C), delivery mode (D-F), and diet (G-I). Asterisks and brackets indicate significant (LME P < 0.05) group differences at baseline or rate-of-change differences across age ranges.
Fig. 3
Fig. 3. Antibiotic exposure alters bacterial abundance
Antibiotic exposure significantly altered abundance of diverse bacterial taxa over the first two years of life. Based on LefSe analysis, red-shaded taxa (rows) were significantly (P < 0.05) more abundant in antibiotic-exposed infants at the given time points (columns); blue shading indicates more abundant in unexposed infants.
Fig. 4
Fig. 4. Antibiotic exposure delays microbiota maturation during early life
A, Microbiota-by-age Z-scores (MAZ) at each month of life between antibiotic-exposed and unexposed infants (infants never exposed to systemic pharmacologic antibiotic doses prior to the sampling time). MAZ scores indicate the number of standard deviations from the mean predicted age of age-matched control samples, as a function of microbiota maturation. Grey margins represent 95% confidence limits. Asterisks and brackets indicate significant (LME P < 0.05) group differences at baseline or rate-of-change differences across age ranges. The “unexposed” group contains both training set samples (from children who were never exposed to pre-, peri-, or post-natal systemic antibiotics; were vaginally delivered; and dominantly breast-fed), and all other samples from children who had not been previously exposed to systemic post-natal antibiotics. B, OTU abundance heat maps illustrate the relative abundance (RA) Z-scores of 22 maturity-marker OTUs in the antibiotic-exposed and unexposed groups throughout life. These OTUs were selected as those that best predict age of life in the control group, and hence can be used as markers of normal maturity. Substantial departures from the normal maturation profile alter predicted age of other samples. The color scale represents relative abundance (RA) Z-scores for each OTU, (i.e., the number of standard deviations from the mean RA of that OTU) across all samples at that age.
Fig. 5
Fig. 5. Delivery mode alters microbial diversity and composition
A, Unweighted UniFrac principal coordinates analysis of the infant microbiome in relation to delivery mode over the first two years of life. Permutational MANOVA P < 0.05 (Table S7). B, Bacteroidetes relative abundance (Mean ± SEM) over time in relation to delivery mode. C, Cesarean section significantly alters abundance of diverse bacterial taxa over time. Red-shaded taxa (rows) were significantly more abundant (LEfSe P < 0.05) in cesarean-delivered infants at the given time points (columns); blue shading indicates more abundant in vaginally delivered infants
Fig. 6
Fig. 6. Bipartite network comparing the relationships among all samples (squares) and OTUs (circles)
A, The distance between sample nodes and OTU nodes is a function of shared microbial composition. Samples with a large degree of OTU overlap (weighted by the number of observations of that OTU) form clusters. Edges connect a sample to each OTU detected in that sample, revealing shared OTUs between samples. Sample nodes and edges are colored by sample type; the border of sample nodes is a function of the age of the child, including pre-partum (negative) values for maternal samples (key at top-left). OTU nodes are colored by taxonomic family affiliation; the size of each OTU node is a function of that OTU's overall abundance, registered as OTU count in all samples (key at middle-left). See Fig 7 for specific analyses. B, Unweighted UniFrac distance between maternal vaginal, rectal, and stool microbiota and child stool microbiota as a function of child age. Shorter distance indicates greater similarity between microbial communities. C, Unweighted UniFrac distance between stool microbiota from the same child (self) and other children (non-self) as a function of the difference in age between sampling (Δ months). D, Unweighted UniFrac distance between maternal vaginal microbiota and stool microbiota of vaginally born dyads, unrelated children, or cesarean-delivered dyads as a function of child age. For panels B-D, lines indicate rolling-average mean values, grey shading = 95% CI. Grey shading = 95% CI. ANOVA P values are shown.
Fig. 7
Fig. 7. Shared OTUs reveal microbial relatedness among mothers and children
(A) Shared OTU counts (median ± quartiles) between individual stool samples (top), rectal swabs and stool samples (middle), and vaginal swabs and stool samples (bottom), represented in Fig. 6. Distributions represent the total number of OTUs within a single sample (blue) or shared OTUs between samples from the same individual (self, yellow), another individual (nonself, white/black), or a mother-infant dyad (red). Lowercase letters indicate significantly different shared OTU count distributions [one-way ANOVA, P < 0.0001, followed by false discovery rate (FDR)–corrected Fisher’s protected least significant difference (PLSD) test]. Key indicates coloring for box plots in (A) or line plots in (B) to (I). (B to I) Shared OTU counts over time between mothers and unrelated children, mother-infant dyads, and total OTUs in child stool samples. (C) Samples from the same child or unrelated children at different times (Δ months). (D) Mothers’ rectal swabs and stool samples from their own children (dyad) or unrelated children. (E) Mothers’ vaginal swabs and stool samples from unrelated children or dyads of children delivered vaginally or by cesarean section. (F) Vaginal and rectal swabs from the same mother or other mothers. (G) Stool samples from the same mother or other mothers. (H) Rectal swabs from the same mother or other mothers. (I) Vaginal swabs from the same mother or other mothers. (B), (D), and (E) compare mothers versus children, and x axes indicate the child’s age (months). For (C) and (F) to (I), x axes indicate the differences in child age (Δ months) between the times when these samples were obtained. Lines indicate rolling average mean values, and gray shading is equal to 95% CI. *P < 0.0001, ANOVA, followed by FDR-corrected Fisher’s PLSD test.

Comment in

References

    1. Renz H, Brandtzaeg P, Hornef M. The impact of perinatal immune development on mucosal homeostasis and chronic inflammation. Nature Reviews Immunology. 2012;12:9–23. - PubMed
    1. Turnbaugh PJ, Ley RE, Mahowald MA, Magrini V, Mardis ER, Gordon JI. An obesity-associated gut microbiome with increased capacity for energy harvest. Nature. 2006;444:1027–1031. - PubMed
    1. Ivanov, Atarashi K, Manel N, Brodie EL, Shima T, Karaoz U, Wei D, Goldfarb KC, Santee CA, Lynch SV, Tanoue T, Imaoka A, Itoh K, Takeda K, Umesaki Y, Honda K, Littman DR. Induction of intestinal Th17 cells by segmented filamentous bacteria. Cell. 2009;139:485–498. - PMC - PubMed
    1. Olszak T, An D, Zeissig S, Vera MP, Richter J, Franke A, Glickman JN, Siebert R, Baron RM, Kasper DL, Blumberg RS. Microbial exposure during early life has persistent effects on natural killer T cell function. Science. 2012;336:489–493. - PMC - PubMed
    1. Subramanian S, Huq S, Yatsunenko T, Haque R, Mahfuz M, Alam MA, Benezra A, DeStefano J, Meier MF, Muegge BD, Barratt MJ, VanArendonk LG, Zhang Q, Province MA, Petri WA, Jr, Ahmed T, Gordon JI. Persistent gut microbiota immaturity in malnourished Bangladeshi children. Nature. 2014;510:417–421. - PMC - PubMed

Publication types

Substances