Uncovering ancient transcription systems with a novel evolutionary indicator
- PMID: 27307191
- PMCID: PMC4910066
- DOI: 10.1038/srep27922
Uncovering ancient transcription systems with a novel evolutionary indicator
Abstract
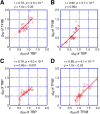
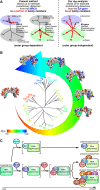
TBP and TFIIB are evolutionarily conserved transcription initiation factors in archaea and eukaryotes. Information about their ancestral genes would be expected to provide insight into the origin of the RNA polymerase II-type transcription apparatus. In obtaining such information, the nucleotide sequences of current genes of both archaea and eukaryotes should be included in the analysis. However, the present methods of evolutionary analysis require that a subset of the genes should be excluded as an outer group. To overcome this limitation, we propose an innovative concept for evolutionary analysis that does not require an outer group. This approach utilizes the similarity in intramolecular direct repeats present in TBP and TFIIB as an evolutionary measure revealing the degree of similarity between the present offspring genes and their ancestors. Information on the properties of the ancestors and the order of emergence of TBP and TFIIB was also revealed. These findings imply that, for evolutionarily early transcription systems billions of years ago, interaction of RNA polymerase II with transcription initiation factors and the regulation of its enzymatic activity was required prior to the accurate positioning of the enzyme. Our approach provides a new way to discuss mechanistic and system evolution in a quantitative manner.
Figures


Similar articles
-
The σ enigma: bacterial σ factors, archaeal TFB and eukaryotic TFIIB are homologs.Transcription. 2014;5(4):e967599. doi: 10.4161/21541264.2014.967599. Transcription. 2014. PMID: 25483602 Free PMC article.
-
Same same but different: The evolution of TBP in archaea and their eukaryotic offspring.Transcription. 2017 May 27;8(3):162-168. doi: 10.1080/21541264.2017.1289879. Epub 2017 Feb 8. Transcription. 2017. PMID: 28340330 Free PMC article.
-
Genetic and transcriptomic analysis of transcription factor genes in the model halophilic Archaeon: coordinate action of TbpD and TfbA.BMC Genet. 2007 Sep 24;8:61. doi: 10.1186/1471-2156-8-61. BMC Genet. 2007. PMID: 17892563 Free PMC article.
-
Transcription initiation in Archaea: facts, factors and future aspects.Mol Microbiol. 1999 Mar;31(5):1295-305. doi: 10.1046/j.1365-2958.1999.01273.x. Mol Microbiol. 1999. PMID: 10200952 Review.
-
Determinants of transcription initiation by archaeal RNA polymerase.Curr Opin Microbiol. 2005 Dec;8(6):677-84. doi: 10.1016/j.mib.2005.10.016. Epub 2005 Oct 24. Curr Opin Microbiol. 2005. PMID: 16249119 Review.
Cited by
-
Displacement of the transcription factor B reader domain during transcription initiation.Nucleic Acids Res. 2018 Nov 2;46(19):10066-10081. doi: 10.1093/nar/gky699. Nucleic Acids Res. 2018. PMID: 30102372 Free PMC article.
-
The Possible Crystallization Process in the Origin of Bacteria, Archaea, Viruses, and Mobile Elements.Biology (Basel). 2024 Dec 24;14(1):3. doi: 10.3390/biology14010003. Biology (Basel). 2024. PMID: 39857234 Free PMC article.
-
Protein interaction network revealed by quantitative proteomic analysis links TFIIB to multiple aspects of the transcription cycle.Biochim Biophys Acta Proteins Proteom. 2024 Jan 1;1872(1):140968. doi: 10.1016/j.bbapap.2023.140968. Epub 2023 Oct 19. Biochim Biophys Acta Proteins Proteom. 2024. PMID: 37863410 Free PMC article.
References
-
- Matsui T., Segall J., Weil P. A. & Roeder R. G. Multiple factors required for accurate initiation of transcription by purified RNA polymerase II. J. Biol. Chem. 255, 11992–11996 (1980). - PubMed
-
- Horikoshi M., Hai T., Lin Y. S., Green M. R. & Roeder R. G. Transcription factor ATF interacts with the TATA factor to facilitate establishment of a preinitiation complex. Cell 54, 1033–1042 (1988). - PubMed
-
- Hai T. W., Horikoshi M., Roeder R. G. & Green M. R. Analysis of the role of the transcription factor ATF in the assembly of a functional preinitiation complex. Cell 54, 1043–1051 (1988). - PubMed
-
- Buratowski S., Hahn S., Guarente L. & Sharp P. A. Five intermediate complexes in transcription initiation by RNA polymerase II. Cell 56, 549–561 (1989). - PubMed
-
- Roeder R. G. The eukaryotic transcriptional machinery: complexities and mechanisms unforeseen. Nat. Med. 9, 1239–1244 (2003). - PubMed
Publication types
MeSH terms
Substances
LinkOut - more resources
Full Text Sources
Other Literature Sources

