. 2016 Jun 16:5:e10575.
doi: 10.7554/eLife.10575.

Mitochondrial dysfunction remodels one-carbon metabolism in human cells

Affiliations

Mitochondrial dysfunction remodels one-carbon metabolism in human cells

Xiaoyan Robert Bao et al. Elife. .

Abstract

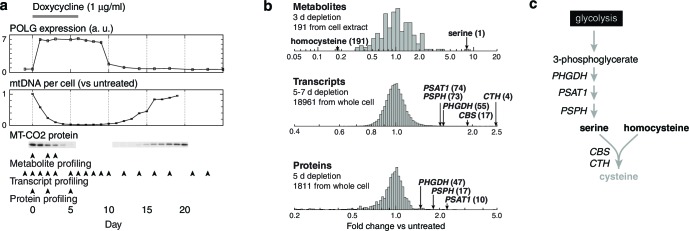
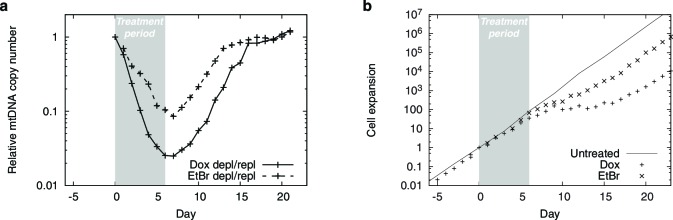
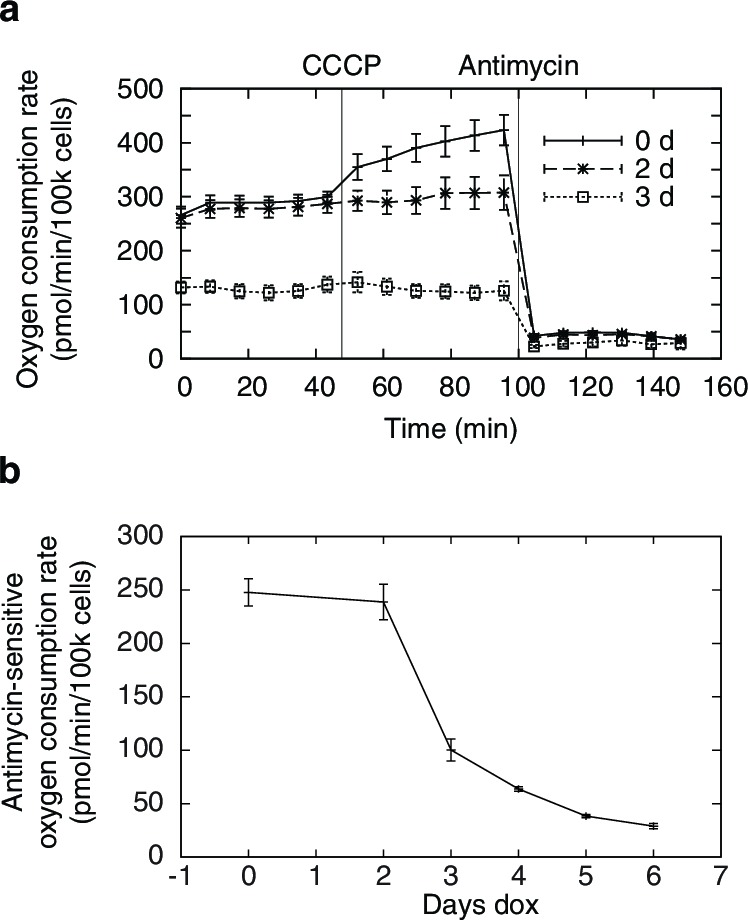
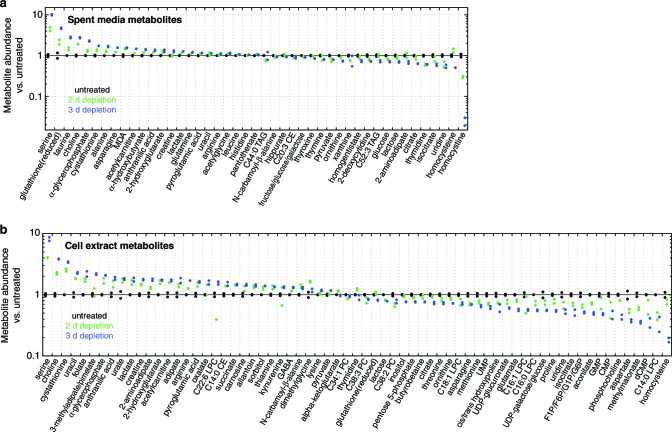
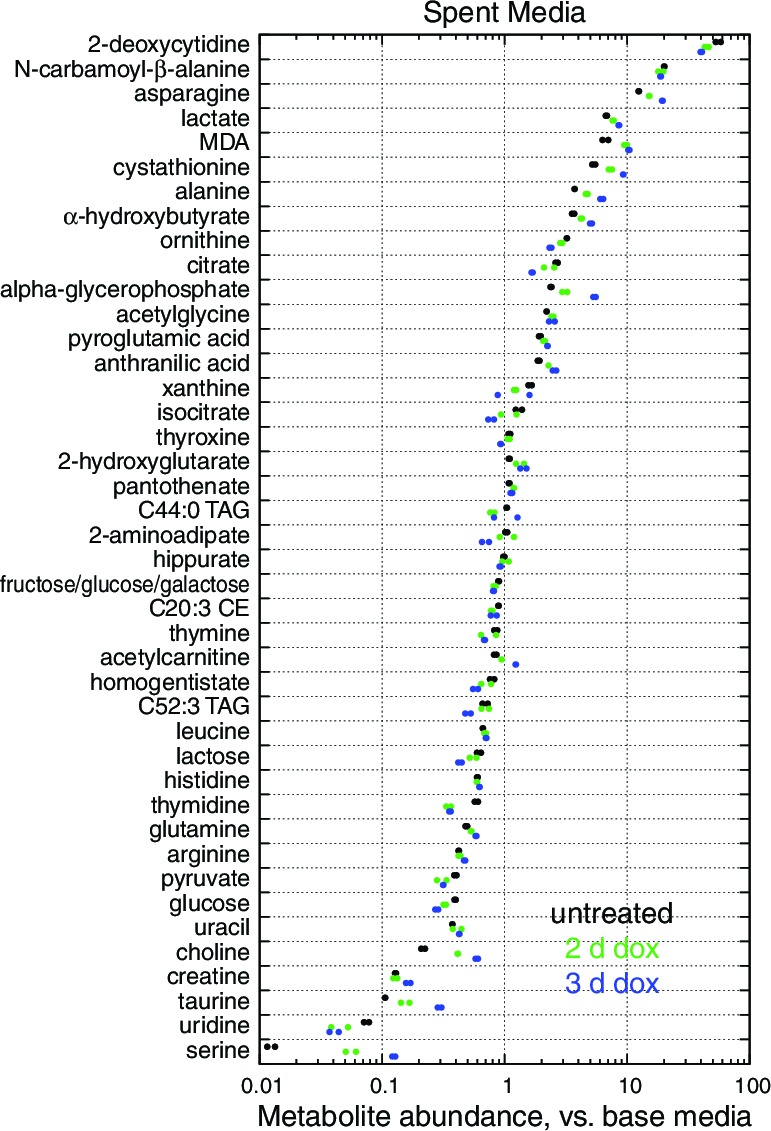
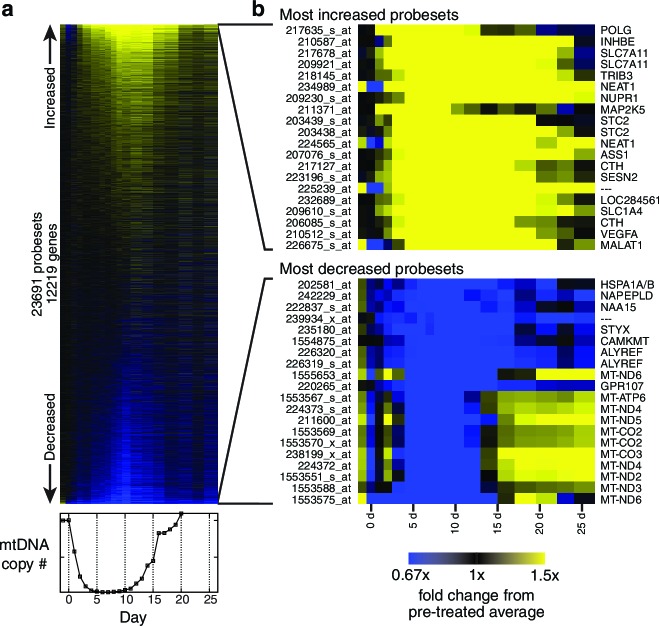
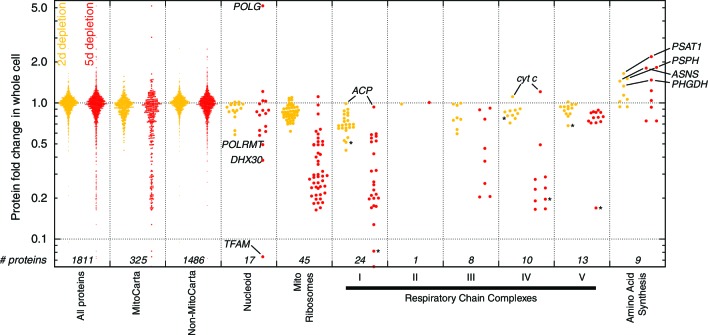
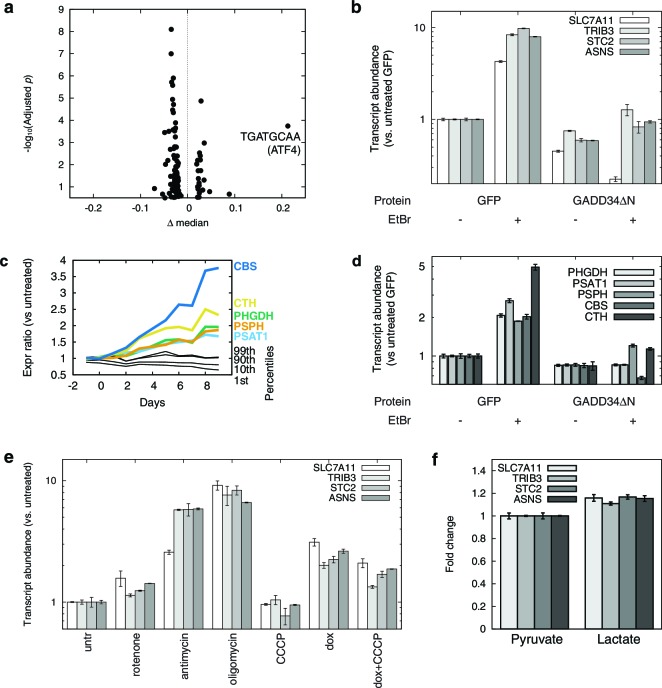
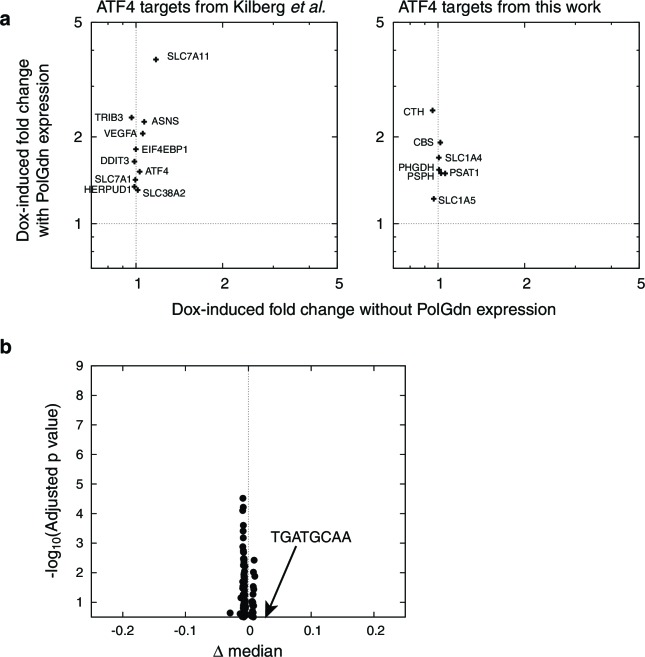
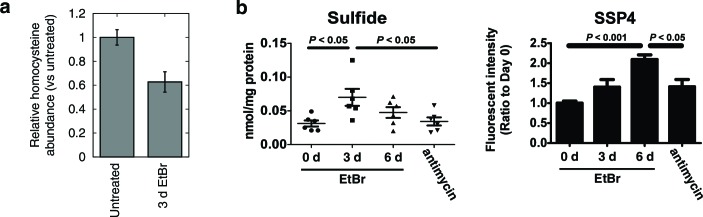
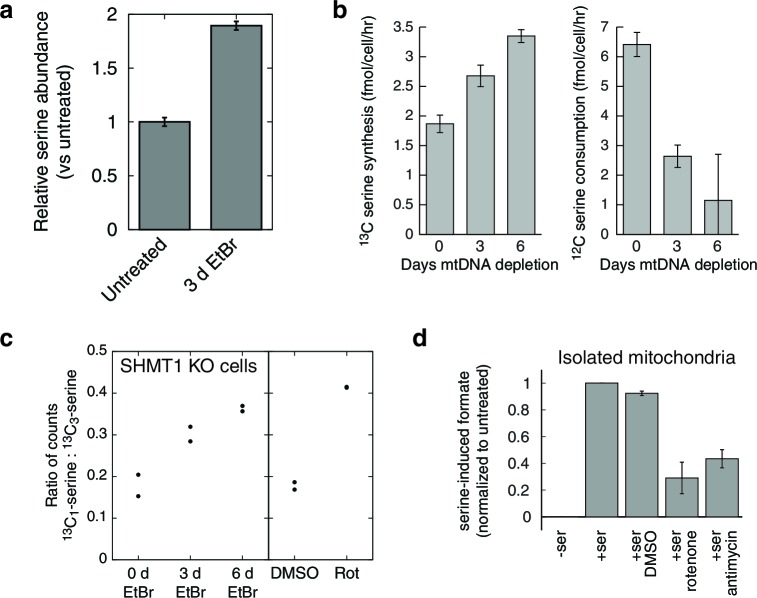
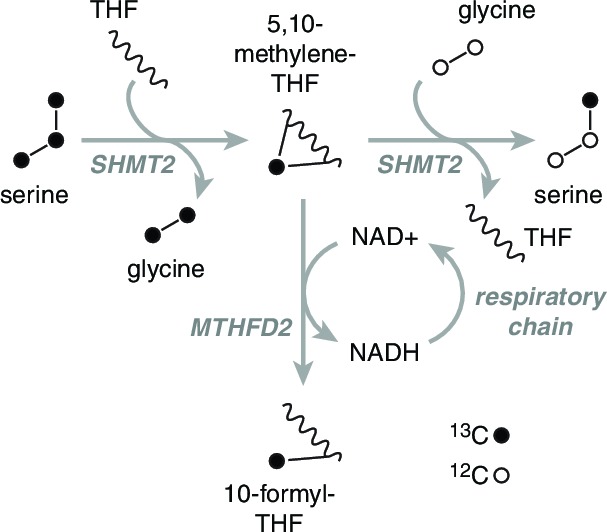
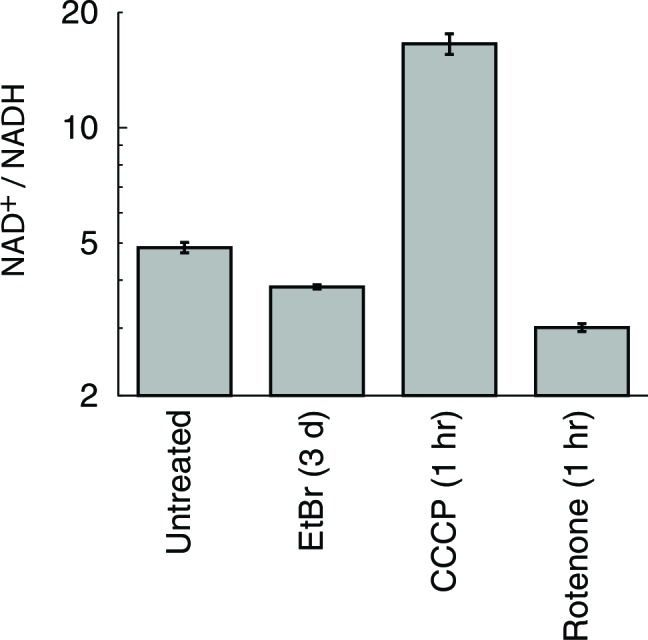
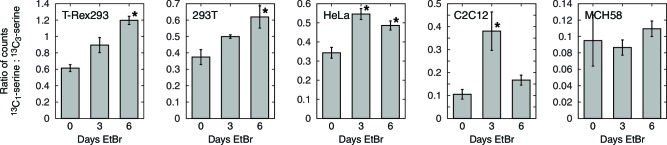
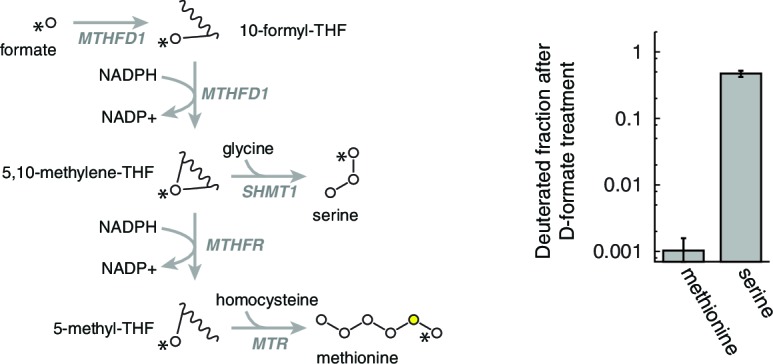
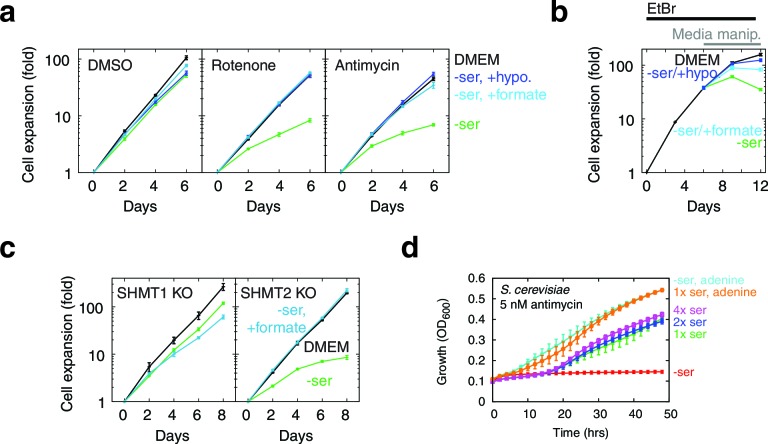
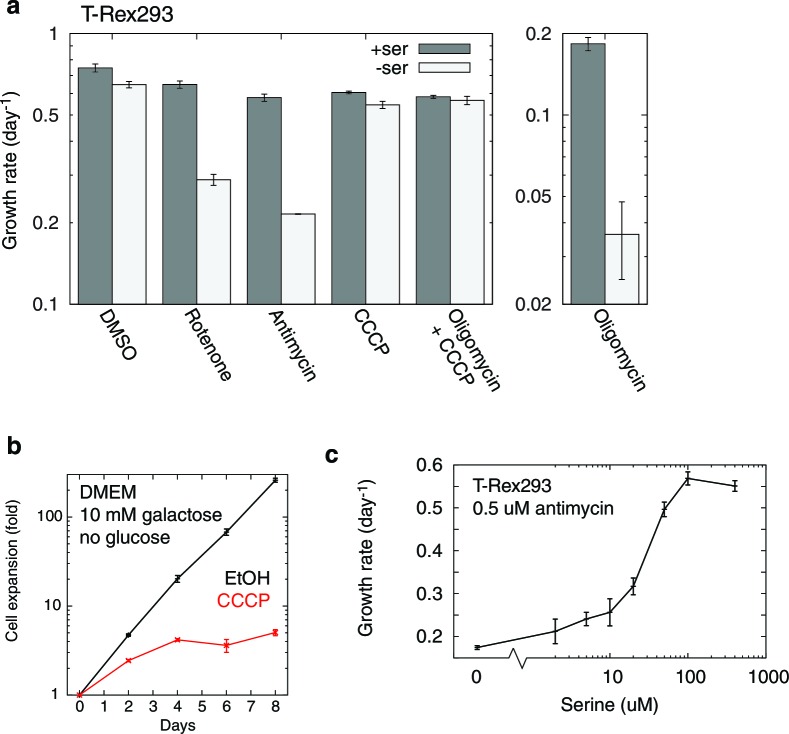
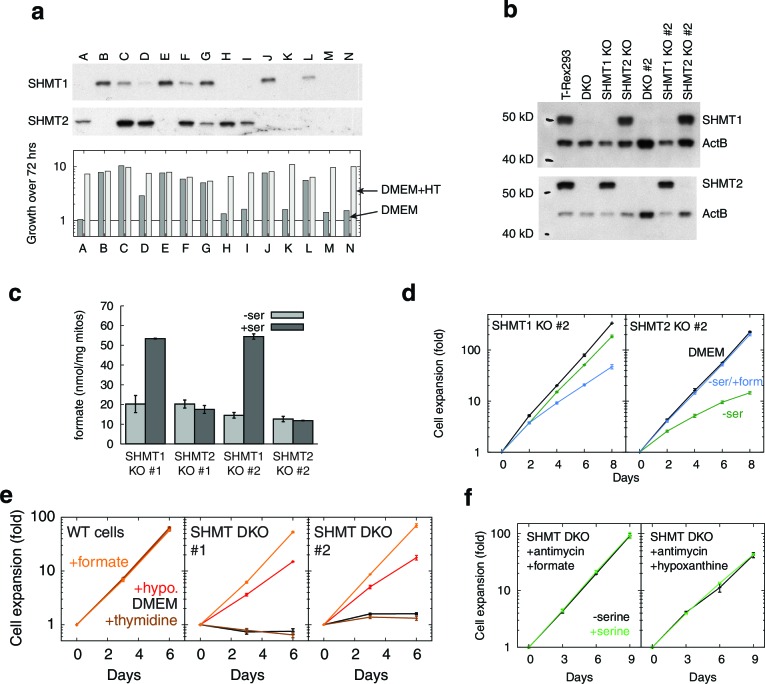
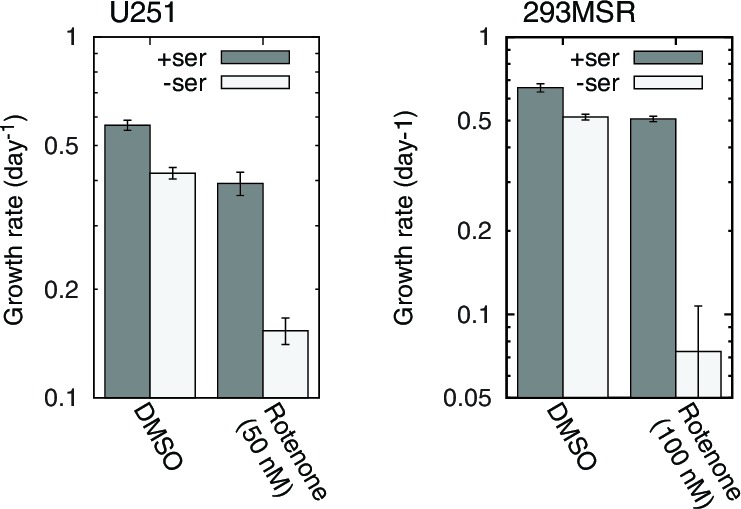
Mitochondrial dysfunction is associated with a spectrum of human disorders, ranging from rare, inborn errors of metabolism to common, age-associated diseases such as neurodegeneration. How these lesions give rise to diverse pathology is not well understood, partly because their proximal consequences have not been well-studied in mammalian cells. Here we provide two lines of evidence that mitochondrial respiratory chain dysfunction leads to alterations in one-carbon metabolism pathways. First, using hypothesis-generating metabolic, proteomic, and transcriptional profiling, followed by confirmatory experiments, we report that mitochondrial DNA depletion leads to an ATF4-mediated increase in serine biosynthesis and transsulfuration. Second, we show that lesioning the respiratory chain impairs mitochondrial production of formate from serine, and that in some cells, respiratory chain inhibition leads to growth defects upon serine withdrawal that are rescuable with purine or formate supplementation. Our work underscores the connection between the respiratory chain and one-carbon metabolism with implications for understanding mitochondrial pathogenesis.

Keywords: computational biology; folate metabolism; human; human biology; medicine; metabolite profiling; mitochondrial disease; mouse; proteomics; sulfur metabolism; systems biology; transcriptional profiling.


Conflict of interest statement

AR: is a senior editor at eLife.

VKM: is a founder and holds a financial interest in Raze Therapeutics, which is targeting one-carbon metabolism for cancer.

The other authors declare that no competing interests exist.

Figures

Figure 1.
Figure 1.. Integrated RNA, protein, and metabolite profiling of mtDNA depletion.
(a) Experimental model. Doxycycline treatment induces PolGdn expression, mtDNA depletion, and reduction in oxidative phosphorylation complexes (n = 1 for all data). Arrowheads indicate time points analyzed by metabolite, proteomic, and transcriptional profiling. (b) Results from hypothesis-generating integrated profiling (n = 2 for metabolites; n = 1 for transcripts and proteins) showing serine- and homocysteine-related measurements. Numbers in parentheses represent ranks of the respective measurements. (c) Serine biosynthesis and transsulfuration pathways. DOI: http://dx.doi.org/10.7554/eLife.10575.003
Figure 1—figure supplement 1.
Figure 1—figure supplement 1.. mtDNA depletion time courses using PolGdn overexpression or EtBr treatment.
(a) Relative mtDNA copy number. (b) Cell growth. n = 1 for all data. DOI: http://dx.doi.org/10.7554/eLife.10575.004
Figure 1—figure supplement 2.
Figure 1—figure supplement 2.. Changes in oxygen consumption induced by mtDNA depletion.
(a) oxygen consumption time courses showing basal and uncoupler-stimulated respiration. (b) changes in basal respiration rates with mtDNA depletion. n = 5 for each trace. DOI: http://dx.doi.org/10.7554/eLife.10575.005
Figure 1—figure supplement 3.
Figure 1—figure supplement 3.. Metabolite profiling results.
Spent media (a) and cell extract (b) metabolites with nominally significant changes after 2 or 3 d of mtDNA depletion, as compared to untreated cell samples (n = 2, nominal p<0.05). Only metabolites detected in all three time points are shown. Metabolites are ordered by mean fold change with 3 d of mtDNA depletion, compared to untreated cell samples. DOI: http://dx.doi.org/10.7554/eLife.10575.006
Figure 1—figure supplement 4.
Figure 1—figure supplement 4.. Spent media metabolite levels shown relative to levels in base media.
Only metabolites present in the base media and significant changed with 2 or 3 d mtDNA depletion are shown. n = 2. DOI: http://dx.doi.org/10.7554/eLife.10575.007
Figure 1—figure supplement 5.
Figure 1—figure supplement 5.. Transcriptional profiling results.
(a) Heat map showing genes changed (see Materials and methods) during the course of mtDNA depletion and repletion. Time course of mtDNA copy number is shown below the heat map for comparison. n = 1 for each time point. (b) Most strongly upregulated and downregulated probesets in the microarray data. DOI: http://dx.doi.org/10.7554/eLife.10575.008
Figure 1—figure supplement 6.
Figure 1—figure supplement 6.. Protein profiling results (n = 1) at 2 d (yellow) and 5 d (red) of mtDNA depletion.
The leftmost box shows fold changes for all proteins quantitated by mass spectrometry. Subsequent boxes show subsets of these data. Starred data points are mtDNA-encoded proteins. DOI: http://dx.doi.org/10.7554/eLife.10575.009
Figure 2.
Figure 2.. mtDNA depletion activates ATF4.
(a) Volcano plot of motifADE analysis results (see Results). Δ median denotes the normalized rank of the median gene associated with each motif. (b) Fold changes of four of the most-upregulated genes in microarray data, in response to mtDNA depletion by ethidium bromide (EtBr) treatment (100 ng/ml, 9 d), and with expression of either GFP or GADD34ΔN. (c) Activation of serine and homocysteine biosynthesis genes, compared to that of genes at the 1st, 10th, 90th, and 99th percentiles in each transcriptional profiling timepoint. (d) Activation of serine and cysteine biosynthesis genes in response to mtDNA depletion, with and without GADD34ΔN expression. (e) Activation of ATF4 target genes in response to mitochondrial inhibitors. (f) Activation of ATF4 target genes in response to cytoplasmic redox imbanace elicited by lactate. n = 3 for b, d, e, and f. DOI: http://dx.doi.org/10.7554/eLife.10575.010
Figure 2—figure supplement 1.
Figure 2—figure supplement 1.. Doxycycline control treatment data.
(a) Activation of ATF4 target genes in response to PolGdn expression, and in response to 6 d doxycycline treatment (1 μg/ml) in the absence of PolGdn induction in the parental T-REX-293 cell line. Left side, ATF4-responsive genes listed in (Kilberg et al., 2009). Right, ATF4-responsive genes identified in this paper. For all genes except PSAT1, the activation in the absence of PolGdn induction was less than 10% of the activation with PolGdn induction. (b) motifADE results from doxycycline control treatment data. n = 1 for data with PolGdn expression, and n = 3 for data without. DOI: http://dx.doi.org/10.7554/eLife.10575.011
Figure 3.
Figure 3.. Alterations in transsulfuration-associated metabolites upon mtDNA depletion.
(a) Confirmation of decreased homocysteine abundance in spent media with EtBr-induced mtDNA depletion. n = 3. (b) Hydrogen sulfide levels in cells measured either directly (sulfide) or indirectly by its sulfane products (SSP4). Acute antimycin treatment (1 hr) was used to control for increased H2S levels arising from decreased H2S degradation due to loss of the respiratory chain. n = 6 for both plots. DOI: http://dx.doi.org/10.7554/eLife.10575.012
Figure 4.
Figure 4.. Respiratory chain dysfunction impairs mitochondrial 1C metabolism.
(a) Confirmation of altered serine levels in spent media with EtBr-induced mtDNA depletion. n = 3. (b) Tracing serine metabolism using 13C-labeled glucose. Serine synthesis rates are inferred by labeling cells for 30 min with 13C6-glucose and measuring the amount of 13C3-serine that emerges. Simultaneously, serine consumption rates can be inferred by the amount of unlabeled serine that disappears during the labeling. n = 3. (c) Testing impairment of mitochondrial 1C metabolism using serine isotope scrambing in SHMT1 KO cells. Impairments in mitochondrial 1C metabolism downstream of 13CH2-THF are reflected in increased generation of 13C1-serine (see Figure 4—figure supplement 1). n = 2. (d) Testing impairment of mitochondrial 1C metabolism by assaying formate production from serine using isolated mitochondria with acute RC inhibition. n = 3. DOI: http://dx.doi.org/10.7554/eLife.10575.013
Figure 4—figure supplement 1.
Figure 4—figure supplement 1.. Rationale of serine isotope scrambling assay.
Fully labeled serine (left) is broken down to glycine and methylene-THF by SHMT2. The labeled methylene-THF has two fates: oxidation by MTHFD2 to formyl-THF and recombination with unlabeled glycine, which is present in excess, to form singly labeled serine. Decreased MTHFD2 turnover is expected to give rise to increased synthesis of singly labeled serine. DOI: http://dx.doi.org/10.7554/eLife.10575.014
Figure 4—figure supplement 2.
Figure 4—figure supplement 2.. Alterations in cellular NAD+/NADH ratio elicited by mitochondrial manipulations.
Cellular NAD+ and NADH were determined using a commercially available assay kit (Sullivan et al., 2015). n = 3. DOI: http://dx.doi.org/10.7554/eLife.10575.015
Figure 4—figure supplement 3.
Figure 4—figure supplement 3.. Serine isotope scrambling in other cell types. *, different from 0 day EtBr with p<0.05 (n = 3).
DOI: http://dx.doi.org/10.7554/eLife.10575.016
Figure 4—figure supplement 4.
Figure 4—figure supplement 4.. Determination of homocysteine remethylation.
Deuterium label was traced from labeled formate to labeled methionine, to determine the amount of homocysteine that is consumed by remethylation. n = 3. DOI: http://dx.doi.org/10.7554/eLife.10575.017
Figure 5.
Figure 5.. Serine dependence in cells with compromised mitochondrial function.
(a) Growth of T-REx-293 cells treated with OXPHOS inhibitors, with and without serine, and with serine replaced by formate or hypoxanthine. (b) Same, but of T-REx-293 cells depleted of mtDNA using EtBr. (c) Growth of T-REx-293 cells with knockouts of SHMT1 or SHMT2, with and without serine, and with serine replaced by formate. (d) Growth of S. cerevisiae in nonfermentable media with 5 nM antimycin (see Materials and methods), in the presence or absence of serine and adenine. n = 3 for panels a-c; n = 4 for panel d. DOI: http://dx.doi.org/10.7554/eLife.10575.018
Figure 5—figure supplement 1.
Figure 5—figure supplement 1.. Additional data on RC inhibition-induced serine dependency in T-REx-293 cells.
(a) Quantitated growth rates, with and without media serine, for T-REx-293 cells treated with different mitochondrial inhibitors. n = 3. (b) Suppression of cellular growth in galactose, a nonfermentable sugar (Gohil et al., 2010), by a dose of CCCP (5 μM) that does not elicit serine dependency. n = 3. (c) Serine dose response curve of T-REx-293 cell growth in the presence of antimycin. n = 2. DOI: http://dx.doi.org/10.7554/eLife.10575.019
Figure 5—figure supplement 2.
Figure 5—figure supplement 2.. SHMT1 and SHMT2 single and double knockouts.
(a) Western blots (top) and growth rates (bottom) for fourteen single cell clones derived from simultaneous CRISPR transfection for SHMT1 and SHMT2 knockout. All clones were expanded in the presence of hypoxanthine and thymidine (HT). (b) Western blots showing SHMT1 and SHMT2 single and double knockouts. (c) Formate synthesis from mitochondria isolated from SHMT1 and SHMT2 knockout cell lines. (d) Replicate serine dependence data from single knockouts. (e) Growth of SHMT1/SHMT2 double KO cells (two independent clones) with different 1C-related supplements. (f) 1C-rescued double knockouts do not show serine dependence, even when treated with RC inhibitor. n = 1 for panel a; n = 3 for panels c–f. DOI: http://dx.doi.org/10.7554/eLife.10575.020
Figure 5—figure supplement 3.
Figure 5—figure supplement 3.. RC inhibition-induced serine dependence in other cell types.
n = 3. DOI: http://dx.doi.org/10.7554/eLife.10575.021

References

    1. Amuthan G, Biswas G, Zhang SY, Klein-Szanto A, Vijayasarathy C, Avadhani NG. Mitochondria-to-nucleus stress signaling induces phenotypic changes, tumor progression and cell invasion. The EMBO Journal. 2001;20:1910–1920. doi: 10.1093/emboj/20.8.1910. - DOI - PMC - PubMed
    1. Anderson DD, Stover PJ. SHMT1 and SHMT2 are functionally redundant in nuclear de novo thymidylate biosynthesis. PLoS ONE. 2009;4:e10575. doi: 10.1371/journal.pone.0005839. - DOI - PMC - PubMed
    1. Baughman JM. Computational and Genetic Screens for Regulators of Oxidative Phosphorylation. Harvard University: 2011.
    1. Ben-Sahra I, Hoxhaj G, Ricoult SJH, Asara JM, Manning BD. mTORC1 induces purine synthesis through control of the mitochondrial tetrahydrofolate cycle. Science. 2016;351:728–733. doi: 10.1126/science.aad0489. - DOI - PMC - PubMed
    1. Birsoy K, Wang T, Chen WW, Freinkman E, Abu-Remaileh M, Sabatini DM. An Essential Role of the Mitochondrial Electron Transport Chain in Cell Proliferation Is to Enable Aspartate Synthesis. Cell. 2015;162:540–591. doi: 10.1016/j.cell.2015.07.016. - DOI - PMC - PubMed

Publication types