. 2016 Jun 15;36(24):6382-92.
doi: 10.1523/JNEUROSCI.0430-16.2016.

Enhanced Spatial Resolution During Locomotion and Heightened Attention in Mouse Primary Visual Cortex

Affiliations

Enhanced Spatial Resolution During Locomotion and Heightened Attention in Mouse Primary Visual Cortex

Patrick J Mineault et al. J Neurosci. .

Abstract

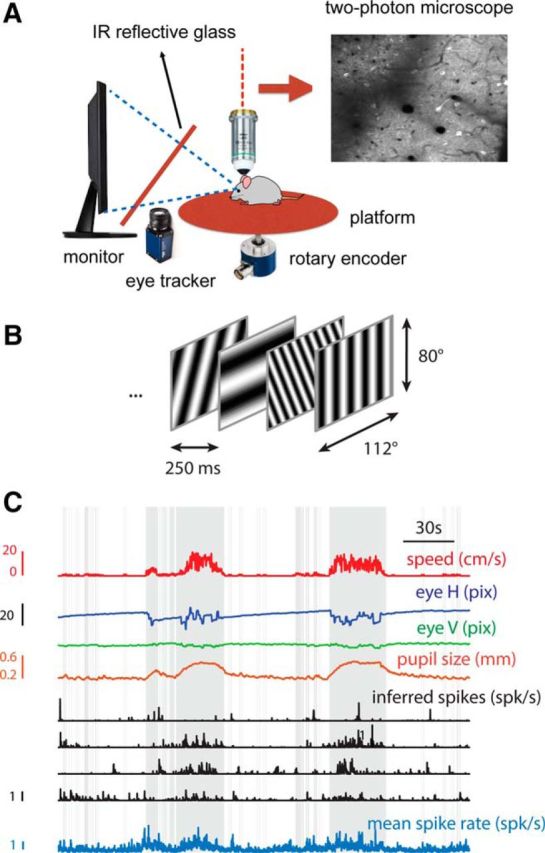
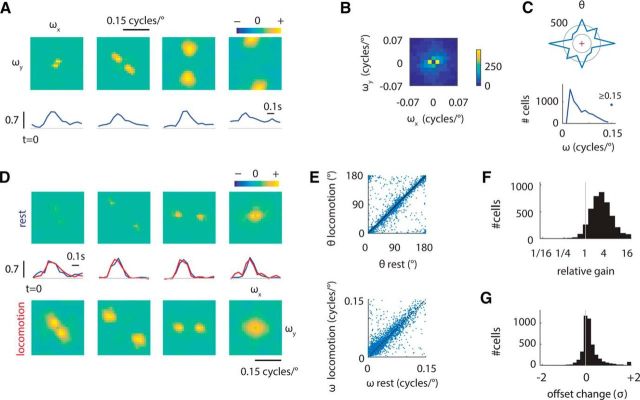
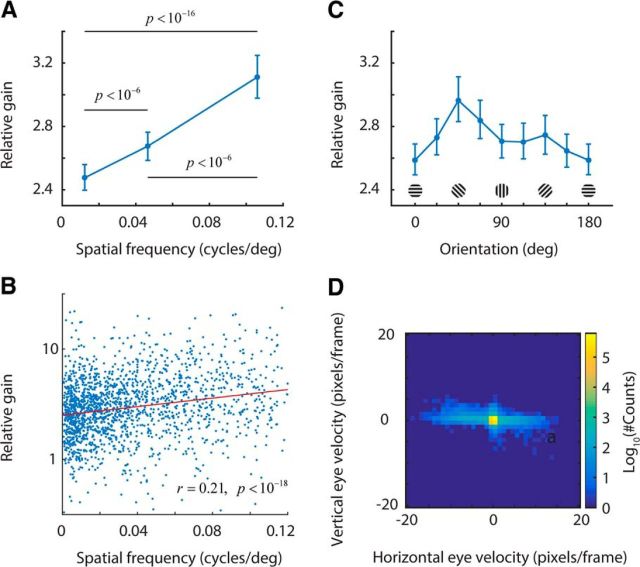
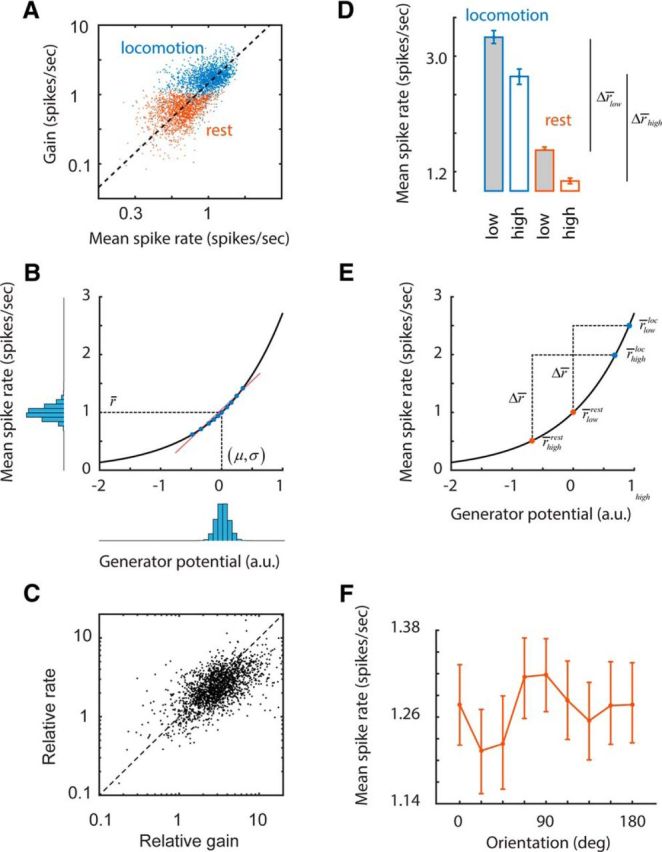
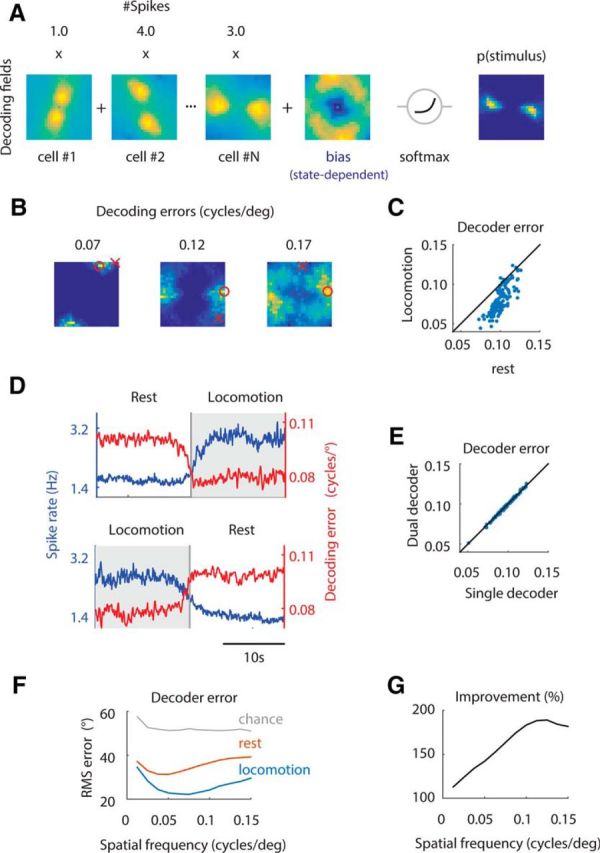
We do not fully understand how behavioral state modulates the processing and transmission of sensory signals. Here, we studied the cortical representation of the retinal image in mice that spontaneously switched between a state of rest and a constricted pupil, and one of active locomotion and a dilated pupil, indicative of heightened attention. We measured the selectivity of neurons in primary visual cortex for orientation and spatial frequency, as well as their response gain, in these two behavioral states. Consistent with prior studies, we found that preferred orientation and spatial frequency remained invariant across states, whereas response gain increased during locomotion relative to rest. Surprisingly, relative gain, defined as the ratio between the gain during locomotion and the gain during rest, was not uniform across the population. Cells tuned to high spatial frequencies showed larger relative gain compared with those tuned to lower spatial frequencies. The preferential enhancement of high-spatial-frequency information was also reflected in our ability to decode the stimulus from population activity. Finally, we show that changes in gain originate from shifts in the operating point of neurons along a spiking nonlinearity as a function of behavioral state. Differences in the relative gain experienced by neurons with high and low spatial frequencies are due to corresponding differences in how these cells shift their operating points between behavioral states.

Significance statement: How behavioral state modulates the processing and transmission of sensory signals remains poorly understood. Here, we show that the mean firing rate and neuronal gain increase during locomotion as a result in a shift of the operating point of neurons. We define relative gain as the ratio between the gain of neurons during locomotion and rest. Interestingly, relative gain is higher in cells with preferences for higher spatial frequencies than those with low-spatial-frequency selectivity. This means that, during a state of locomotion and heightened attention, the population activity in primary visual cortex can support better spatial acuity, a phenomenon that parallels the improved spatial resolution observed in human subjects during the allocation of spatial attention.

Keywords: alertness; locomotion; neuronal gain; operating point; spatial acuity; visual cortex.


Figures

Figure 1.
Figure 1.
Experimental setup. A, Activity of cells in V1 was imaged while a mouse, on a freely rotating platform, observed a continuous visual stimulus. The head was horizontal. B, Sample of a visual stimulus sequence. The stimulus consisted of a pseudorandom sequence of gratings drawn from a Hartley basis set presented at a rate of 4 frames/s. C, Segment of a data record depicting platform speed, eye position, pupil size, the inferred spikes of four sample cells, and the mean spike rate of the population. Gray bars in this and subsequent figures indicate periods of locomotion defined by a threshold on the speed signal.
Figure 2.
Figure 2.
Effect of behavioral state on the tuning of V1 neurons in the orientation and spatial-frequency (Fourier) plane. A, Tuning of four sample cells in the Fourier domain (origin is at the center) and their corresponding temporal kernels (bottom). These estimates were obtained by fitting a linear model to the data (Materials and Methods, Eq. 2). All temporal kernels are shown starting at t = 0. Spatial frequency along the horizontal meridian is represented by ωx and the spatial frequency along the vertical meridian by ωy. All Fourier kernels share the same pseudocolor scale. Positive values (red hues) represent stimuli with orientation and spatial frequency that led to increases in the response of the cell; negative values (blue hues) represent stimuli that suppressed the response of the cell; neutral stimuli are represented by a green hue. B, Distribution of peak kernel positions in the Fourier domain across the population. The distribution is symmetric because the Fourier kernel is symmetric. C, Top, Distribution of preferred orientations, θ. Bottom, Distribution of preferred spatial frequencies, ω = ωx2+ωy2. The symmetry of preferred orientations is a consequence of the symmetry of the Fourier kernels as well. Only well fit neurons (cross-validated r > 0.15, n = 3476; see Materials and Methods for details) are considered in this analysis. D, Tuning of four sample cells in the Fourier domain during rest (top) and locomotion (bottom). Temporal responses are shown in the middle (blue: rest, red: locomotion). This was obtained by fitting a model that allowed changes in gain between locomotion and rest (Materials and Methods, Eq. 6). E, Preferred spatial frequency and orientation are largely preserved across states. F, Response gain increases substantially during locomotion. G, There is a small but significant increase in baseline firing rate of 0.12 ± 0.01 SDs of the response during locomotion (p < 0.001, bootstrap test).
Figure 3.
Figure 3.
Relative gain depends on preferred spatial frequency and orientation. A, Relative gain increases with preferred spatial frequency. The population was split into three groups preferring low (0 < ω < 0.025 cycles/°), medium (0.025 < ω ≥ 0.075 cycles/°), and high (ω > 0.075 cycles/°) spatial frequencies. Mean relative gain (error bars are bootstrapped 95% confidence intervals) is shown for each group. There is an evident dependence of relative gain on the preferred spatial frequency of neurons. B, Relative gain is correlated with preferred spatial frequency. This is the same data as in A replotted without binning to convey the degree of variability. Red line is best linear fit. C, Dependence of relative gain with orientation. There is a moderate tendency for relative gain to be larger at oblique orientations. D, Distribution of eye velocity during the experiments (color code is in a log scale). Although most of the time the eyes are still, when they move, they tend to do so along the horizontal axis. The frequency of such movements is higher during locomotion (Fig. 1C).
Figure 4.
Figure 4.
Changes in the operating point of neurons may explain differential gain changes. A, Scatter plot of the mean rate and gain of cells during periods of rest and locomotion. The dashed line represents the best linear fit. B, An exponential spiking nonlinearity with a Gaussian input has the property that the mean response is proportional to the gain, consistent with the data in A. Here, represents the mean spike rate and (μ, σ) represent the mean and SD of the generator potential. The blue filled dots represent a small subset of data of the joint distribution of the generator potential and the mean spike rate as related by the nonlinearity. The red line represents the best linear fit to these points. The slope of this line is the gain. C, As predicted by this simple rectification model, relative changes in gain are closely related to relative changes in mean spike rate. D, Cells with low- and high-spatial-frequency preferences have different operating points during rest and locomotion. The relative ordering of these rates, along with the approximate identity relationship shown in C, explain how differential gain increases may occur. E, Graphic summary of the relationship in D depicting the relative positioning of operating points of cells with low- and high-spatial-frequency preferences along the spiking nonlinearity. F, There is a trend of mean rate with orientation that complements the dependence of relative gain with orientation (Fig. 3B), consistent with the proposed explanation based on the shifts of the operating points.
Figure 5.
Figure 5.
Locomotion enhances the population code and the cortical representation of high spatial frequencies. A, The decoder consisted of the linear weighting of decoding fields by spike rates over the Fourier domain plus a state-dependent bias term, followed by a soft-max nonlinearity (Materials and Methods). The result is an estimate of the probability of the stimulus given the population firing rate, p(stimulus). B, Examples of p(stimulus), along with the estimated (red circle) and presented (red cross) stimuli together with the decoding error measured as the Euclidean distance between these two points on the Fourier plane. C, Decoding error is smaller during locomotion compared with during rest. D, Average changes in population spike rate and decoding error during transitions from rest to locomotion (top) and from locomotion to rest (bottom). E, A single decoder that only modifies the bias in a state-dependent manner performs as well as two separate decoders for each state. In other words, there is no increase in performance if we allow the model to fit different Fourier kernels during locomotion and rest. F, Decoding of orientation as a function of behavioral state and spatial frequency. Gray line represents chance performance. The lowest decoding errors are achieved during locomotion. G, Relative improvement of decoder performance during locomotion versus rest. The relative improvement, in percentage, is defined as 100 * (RMS_loc − RMS_chance)/(RMS_rest − RMS_chance). The relative improvement in decoding accuracy is concentrated at high spatial frequencies, where gain increases are more pronounced.

Comment in

References

    1. Adesnik H, Bruns W, Taniguchi H, Huang ZJ, Scanziani M. A neural circuit for spatial summation in visual cortex. Nature. 2012;490:226–231. doi: 10.1038/nature11526. - DOI - PMC - PubMed
    1. Ahrens MB, Paninski L, Sahani M. Inferring input nonlinearities in neural encoding models. Network. 2008;19:35–67. doi: 10.1080/09548980701813936. - DOI - PubMed
    1. Anton-Erxleben K, Carrasco M. Attentional enhancement of spatial resolution: linking behavioural and neurophysiological evidence. Nat Rev Neurosci. 2013;14:188–200. doi: 10.1038/nrn3443. - DOI - PMC - PubMed
    1. Arroyo S, Bennett C, Hestrin S. Nicotinic modulation of cortical circuits. Front Neural Circuits. 2014;8:30. doi: 10.3389/fncir.2014.00030. - DOI - PMC - PubMed
    1. Ayaz A, Saleem AB, Schölvinck ML, Carandini M. Locomotion controls spatial integration in mouse visual cortex. Curr Biol. 2013;23:890–894. doi: 10.1016/j.cub.2013.04.012. - DOI - PMC - PubMed

Publication types