

Calcium-Dependent Protein Kinase C Is Not Required for Post-Tetanic Potentiation at the Hippocampal CA3 to CA1 Synapse
- PMID: 27307229
- PMCID: PMC5015777
- DOI: 10.1523/JNEUROSCI.0708-16.2016
Calcium-Dependent Protein Kinase C Is Not Required for Post-Tetanic Potentiation at the Hippocampal CA3 to CA1 Synapse
Abstract
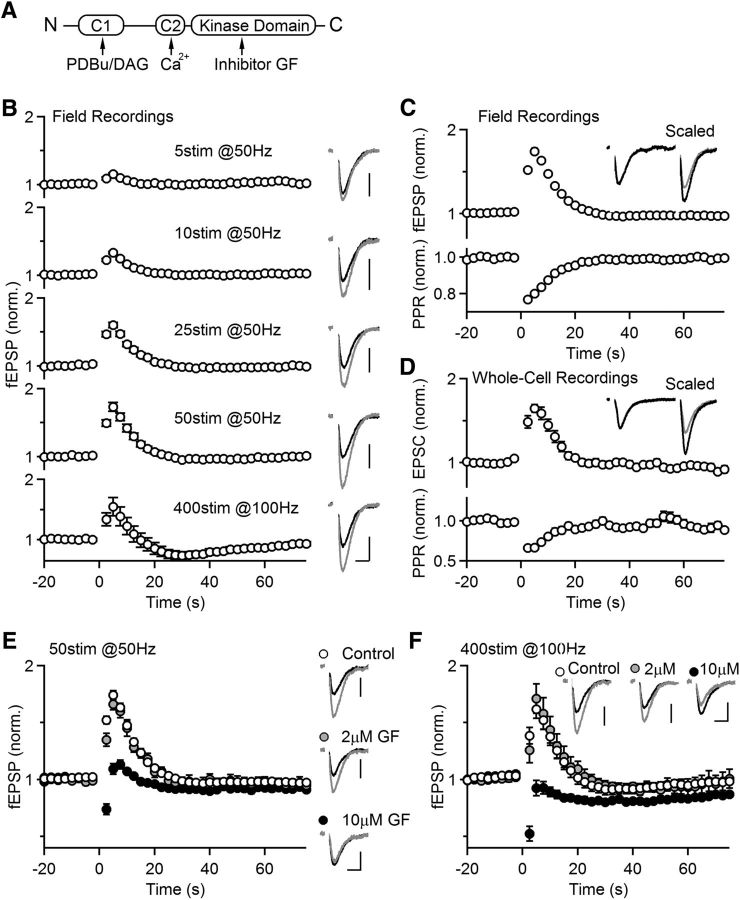
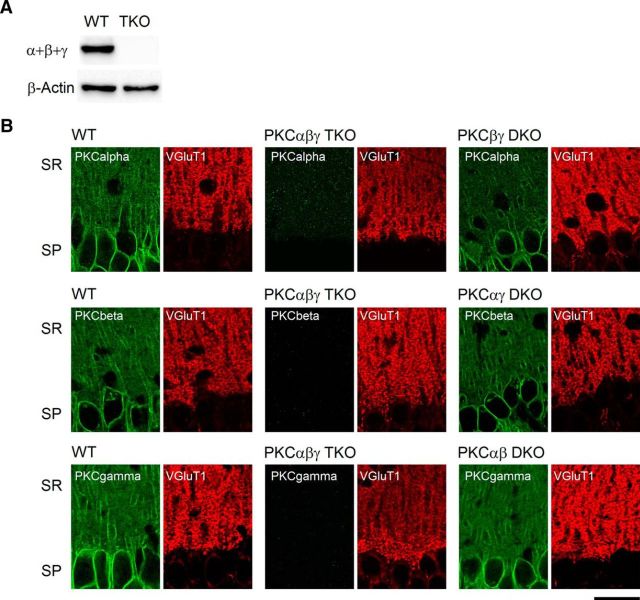
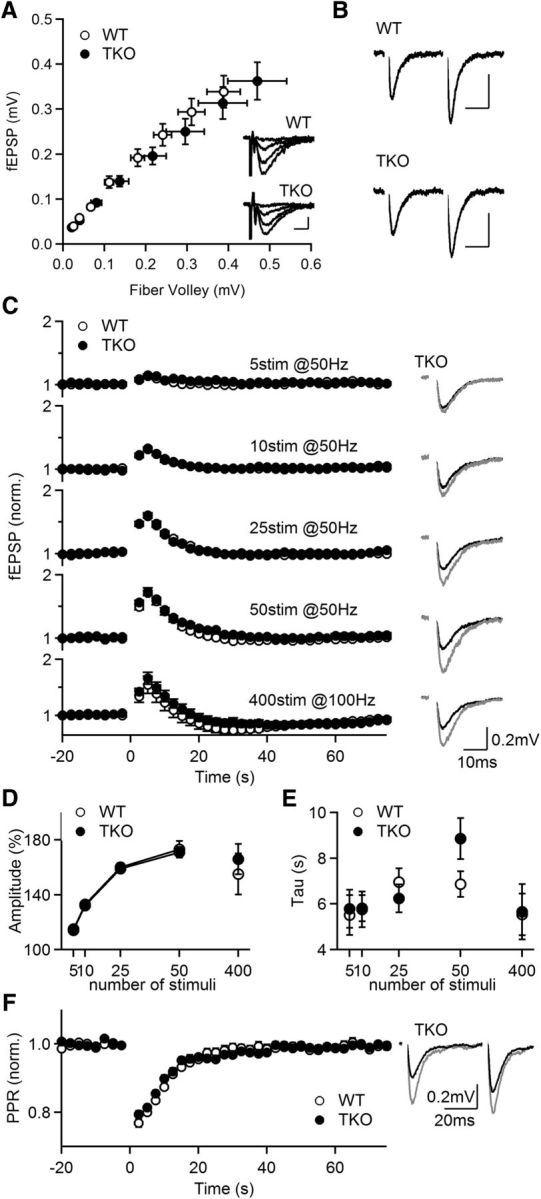
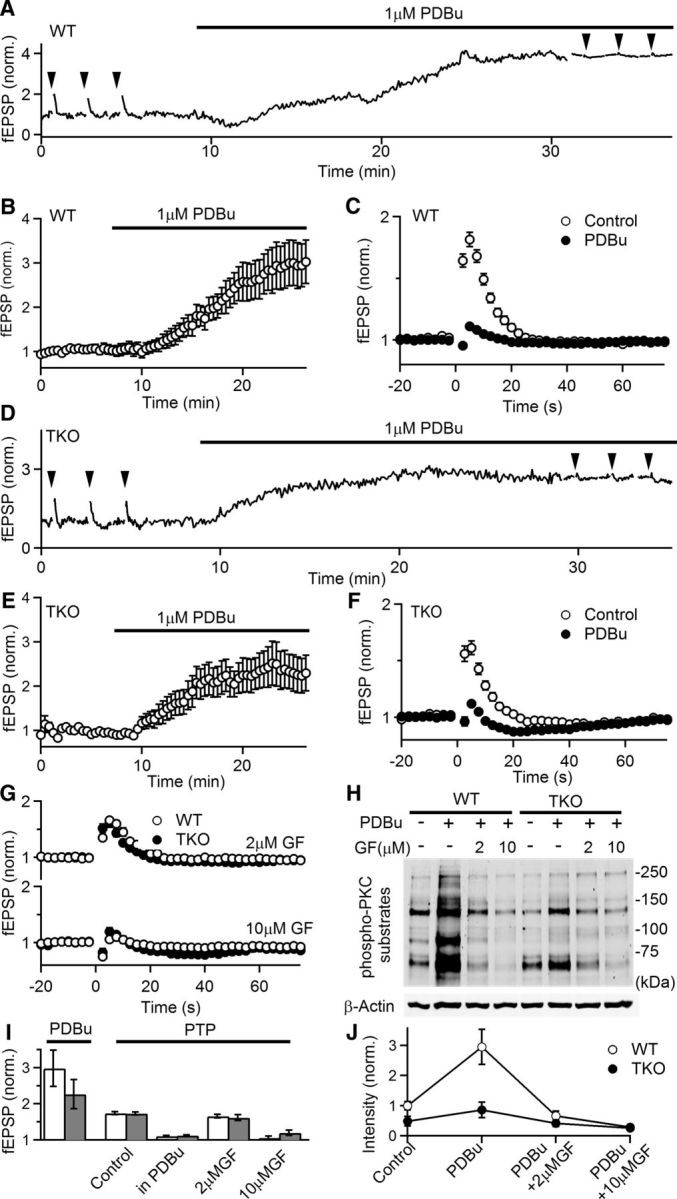
Post-tetanic potentiation (PTP) is a widespread form of short-term synaptic plasticity in which a period of elevated presynaptic activation leads to synaptic enhancement that lasts tens of seconds to minutes. A leading hypothesis for the mechanism of PTP is that tetanic stimulation elevates presynaptic calcium that in turn activates calcium-dependent protein kinase C (PKC) isoforms to phosphorylate targets and enhance neurotransmitter release. Previous pharmacological studies have implicated this mechanism in PTP at hippocampal synapses, but the results are controversial. Here we combine genetic and pharmacological approaches to determine the role of classic PKC isoforms in PTP. We find that PTP is unchanged in PKC triple knock-out (TKO) mice in which all calcium-dependent PKC isoforms have been eliminated (PKCα, PKCβ, and PKCγ). We confirm previous studies and find that in wild-type mice 10 μm of the PKC inhibitor GF109203 eliminates PTP and the PKC activator PDBu enhances neurotransmitter release and occludes PTP. However, we find that the same concentrations of GF109203 and PDBu have similar effects in TKO animals. We also show that 2 μm GF109203 does not abolish PTP even though it inhibits the PDBu-dependent phosphorylation of PKC substrates. We conclude that at the CA3 to CA1 synapse Ca(2+)-dependent PKC isoforms do not serve as calcium sensors to mediate PTP.
Significance statement: Neurons dynamically regulate neurotransmitter release through many processes known collectively as synaptic plasticity. Post-tetanic potentiation (PTP) is a widespread form of synaptic plasticity that lasts for tens of seconds that may have important computational roles and contribute to short-term memory. According to a leading mechanism, presynaptic calcium activates protein kinase C (PKC) to increase neurotransmitter release. Pharmacological studies have also implicated this mechanism at hippocampal CA3 to CA1 synapses, but there are concerns about the specificity of PKC activators and inhibitors. We therefore used a molecular genetic approach and found that PTP was unaffected when all calcium-dependent PKC isozymes were eliminated. We conclude that PKC isozymes are not the calcium sensors that mediate PTP at the CA3 to CA1 synapse.
Keywords: post-tetanic potentiation; protein kinase C; synaptic plasticity.
Copyright © 2016 the authors 0270-6474/16/366393-10$15.00/0.
Figures
Similar articles
-
Adaptive regulation maintains posttetanic potentiation at cerebellar granule cell synapses in the absence of calcium-dependent PKC.J Neurosci. 2012 Sep 19;32(38):13004-9. doi: 10.1523/JNEUROSCI.0683-12.2012. J Neurosci. 2012. PMID: 22993418 Free PMC article.
-
Presynaptic Short-Term Plasticity Persists in the Absence of PKC Phosphorylation of Munc18-1.J Neurosci. 2021 Sep 1;41(35):7329-7339. doi: 10.1523/JNEUROSCI.0347-21.2021. Epub 2021 Jul 21. J Neurosci. 2021. PMID: 34290081 Free PMC article.
-
Calcium-dependent isoforms of protein kinase C mediate posttetanic potentiation at the calyx of Held.Neuron. 2011 Jun 9;70(5):1005-19. doi: 10.1016/j.neuron.2011.04.019. Neuron. 2011. PMID: 21658591 Free PMC article.
-
Learning-induced alterations in hippocampal PKC-immunoreactivity: a review and hypothesis of its functional significance.Prog Neuropsychopharmacol Biol Psychiatry. 1997 Apr;21(3):531-72. doi: 10.1016/s0278-5846(97)00017-1. Prog Neuropsychopharmacol Biol Psychiatry. 1997. PMID: 9153071 Review.
-
The role of protein kinase C in long-term potentiation: a testable model.Brain Res Brain Res Rev. 1989 Jul-Sep;14(3):279-96. doi: 10.1016/0165-0173(89)90004-0. Brain Res Brain Res Rev. 1989. PMID: 2679942 Review.
Cited by
-
Changes in synaptic plasticity are associated with electroconvulsive shock-induced learning and memory impairment in rats with depression-like behavior.Neuropsychiatr Dis Treat. 2018 Jul 2;14:1737-1746. doi: 10.2147/NDT.S163756. eCollection 2018. Neuropsychiatr Dis Treat. 2018. PMID: 29997435 Free PMC article.
-
A Novel and Selective Dopamine Transporter Inhibitor, (S)-MK-26, Promotes Hippocampal Synaptic Plasticity and Restores Effort-Related Motivational Dysfunctions.Biomolecules. 2022 Jun 24;12(7):881. doi: 10.3390/biom12070881. Biomolecules. 2022. PMID: 35883437 Free PMC article.
-
The Onset and Progression of Hippocampal Synaptic Plasticity Deficits in the Q175FDN Mouse Model of Huntington Disease.Front Cell Neurosci. 2019 Jul 17;13:326. doi: 10.3389/fncel.2019.00326. eCollection 2019. Front Cell Neurosci. 2019. PMID: 31379510 Free PMC article.
-
Role of Munc18-1 in the biological functions and pathogenesis of neurological disorders (Review).Mol Med Rep. 2021 Mar;23(3):198. doi: 10.3892/mmr.2021.11837. Epub 2021 Jan 26. Mol Med Rep. 2021. PMID: 33495808 Free PMC article. Review.
-
Post-tetanic potentiation lowers the energy barrier for synaptic vesicle fusion independently of Synaptotagmin-1.Elife. 2020 Aug 24;9:e55713. doi: 10.7554/eLife.55713. Elife. 2020. PMID: 32831174 Free PMC article.
References
-
- Abeliovich A, Paylor R, Chen C, Kim JJ, Wehner JM, Tonegawa S. PKC gamma mutant mice exhibit mild deficits in spatial and contextual learning. Cell. 1993;75:1263–1271. - PubMed
Publication types
MeSH terms
Substances
Grants and funding
LinkOut - more resources
Full Text Sources
Other Literature Sources
Molecular Biology Databases
Miscellaneous