. 2016 Jun 15;36(24):6471-87.
doi: 10.1523/JNEUROSCI.0299-16.2016.

Strength of ERK1/2 MAPK Activation Determines Its Effect on Myelin and Axonal Integrity in the Adult CNS

Affiliations

Strength of ERK1/2 MAPK Activation Determines Its Effect on Myelin and Axonal Integrity in the Adult CNS

Akihiro Ishii et al. J Neurosci. .

Abstract

Myelin growth is a tightly regulated process driven by multiple signals. ERK1/2-MAPK signaling is an important regulator of myelin thickness. Because, in demyelinating diseases, the myelin formed during remyelination fails to achieve normal thickness, increasing ERK1/2 activity in oligodendrocytes is of obvious therapeutic potential for promoting efficient remyelination. However, other studies have suggested that increased levels of ERK1/2 activity could, in fact, have detrimental effects on myelinating cells. Because the strength, duration, or timing of ERK1/2 activation may alter the biological outcomes of cellular responses markedly, here, we investigated the effect of modulating ERK1/2 activity in myelinating cells using transgenic mouse lines in which ERK1/2 activation was upregulated conditionally in a graded manner. We found enhanced myelin gene expression and myelin growth in the adult CNS at both moderate and hyperactivated levels of ERK1/2 when upregulation commenced during developmental myelination or was induced later during adulthood in quiescent preexisting oligodendrocytes, after active myelination is largely terminated. However, a late onset of demyelination and axonal degeneration occurred at hyperelevated, but not moderately elevated, levels regardless of the timing of the upregulation. Similarly, myelin and axonal pathology occurred with elevated ERK1/2 activity in Schwann cells. We conclude that a fine tuning of ERK1/2 signaling strength is critically important for normal oligodendrocyte and Schwann cell function and that disturbance of this balance has negative consequences for myelin and axonal integrity in the long term. Therefore, therapeutic modulation of ERK1/2 activity in demyelinating disease or peripheral neuropathies must be approached with caution.

Significance statement: ERK1/2-MAPK activation in oligodendrocytes and Schwann cells is an important signal for promoting myelin growth during developmental myelination. Here, we show that, when ERK1/2 are activated in mature quiescent oligodendrocytes during adulthood, new myelin growth is reinitiated even after active myelination is terminated, which has implications for understanding the mechanism underlying plasticity of myelin in adult life. Paradoxically, simply increasing the "strength" of ERK1/2 activation changed the biological outcome from beneficial to detrimental, adversely affecting myelin and axonal integrity in both the CNS and PNS. Therefore, this study highlights the complexity of ERK1/2-MAPK signaling in the context of oligodendrocyte and Schwann cell function in the adult animal and emphasizes the need to approach potential therapeutic modulation of ERK1/2 activity with caution.

Keywords: Schwann cells; myelin; oligodendrocyte.


Figures

Figure 1.
Figure 1.
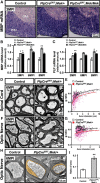
Increase in constitutively active Mek1 gene dosage in transgenic mice correlates with a graded increase in ERK1/2 activity and EGFP expression in oligodendrocytes. A, Transverse sections of spinal cords from control, CnpCre;Mek/+, and CnpCre;Mek/Mek mice show graded EGFP signal intensity in the white matter of spinal cords of transgenic but not control mice (top). Sections labeled for phospho-ERK1/2 (bottom) show increased cellular signal in the white matter of transgenic compared with control mice. B, Control, PlpCreERT;Mek/+, and PlpCreERT;Mek/Mek mice were injected with tamoxifen either at 2 months or P10 for 8–10 d. Double immunolabeling for CC1 (red) and EGFP (green) at 1–2 MPI shows graded increase in EGFP expression in the spinal cords of PlpCreERT;Mek/+ and PlpCreERT;Mek/Mek mice. C, Immunoblot analysis for phospho-ERK1/2 in lysates of spinal cord white matter from CnpCre;Mek/+, CnpCre;Mek/Mek, and littermate control mice or from PlpCreERT;Mek/+, PlpCreERT;Mek/Mek, and littermate control mice showing a statistically significant increase in its expression in the Mek/Mek compared with the Mek/+ or control mice. GAPDH is used as a loading control. Error bars indicate SEM. *p < 0.05, **p < 0.01, one-way ANOVA. n = 3 for each condition.
Figure 2.
Figure 2.
Incremental trend in myelin gene expression and size of oligodendrocytes upon graded upregulation of ERK1/2 activity. A, Transverse sections of cervical spinal cord from control, CnpCre;Mek/+, and CnpCre;Mek/Mek mice analyzed at 3 months (M) by in situ hybridization for MBP mRNA expression show elevated signal intensity in the CnpCre;Mek/+ compared with control mice, which appeared to be further increased in the CnpCre;Mek/Mek mice. B, Quantification of mRNA levels for MOG, MBP, MAG, and PLP by qRT-PCR show a statistically significant increase of MOG and a trend toward an increase of other transcripts in the CnpCre;Mek/Mek compared with CnpCre;Mek/+ mice. Compared with controls, both the transgenics show statistically significant increases. Error bars indicate SEM. *p < 0.05, **p < 0.01. n = 3–6 for each condition. C, EM images of ventral cervical spinal cord sections from control, CnpCre;Mek/+, and CnpCre;Mek/Mek mice at 3 months show that the axons are wrapped by disproportionately thicker myelin sheaths in both the CnpCre;Mek/+ and CnpCre;Mek/Mek mice compared with controls. D, Quantification of myelin thickness by g-ratio analysis in matched regions of the ventral cervical spinal cord confirmed the relative increase in myelin thickness (lower g-ratios) in both the CnpCre;Mek/+ and CnpCre;Mek/Mek mice compared with littermate controls (average g-ratios of axons between 0.5 and 3 μm: control, 0.752 ± 0.003; CnpCre;Mek/+, 0.644 ± 0.006; CnpCre;Mek/Mek, 0.607 ± 0.007, p = 0.42 × 10−46 and p = 0.3 × 10−66, respectively; ∼140 axons were analyzed from at least 2 mice per group). Comparison of CnpCre;Mek/+ and CnpCre;Mek/Mek mice show significant differences only for axons between 0.5 and 1 μm (p = 1.5 × 10⁻¹⁰); other differences in g-ratios are not statistically significant. E, F, Toulidine-blue-stained semithin sections of cervical spinal cords from 3-month-old mice show a trend toward an increase in the size of oligodendrocytes (OLs) in the CnpCre;Mek/Mek compared with CnpCre;Mek/+ mice (outlined in red). Compared with controls, both the transgenic mice show statistically significant increases in the size of OL cell bodies. Areas (μm2) of at least 60 cell bodies was measured per group from at least 2 mice per group. G, Anti-CC1-immunolabeled transverse sections also show this trend. H, EM images of the spinal cord of control and CnpCre;Mek/Mek mice show enlarged cytoplasmic inner tongue and associated periaxonal collar of myelin (colored). The axon identified by red asterisks in C is shown at higher magnification in H. I, Quantification of the relative area of the cytoplasmic inner tongue with associated periaxonal collar and the area of the axon (ratio of area) shows that the increase in CnpCre;Mek/Mek is statistically significant compared with control mice. Approximately 145 axons were analyzed per group from at least two mice per group. Error bars indicate SEM. **p < 0.01. WM, White matter; GM, gray matter.
Figure 3.
Figure 3.
Elevation of ERK1/2 activity during adulthood can reactivate quiescent mature oligodendrocytes to upregulate myelin gene expression and myelin growth. A, Control, PlpCreERT;Mek/+, and PlpCreERT;Mek/Mek mice injected with tamoxifen at 2 months of age, analyzed at 3 MPI by in situ hybridization, show that the signal intensity of MBP mRNA expression is increased in the spinal cords of PlpCreERT;Mek/+ and PlpCreERT;Mek/Mek mice compared with littermate controls. B, C, Quantification of MBP and PLP mRNA levels by qRT-PCR at 3, 6, and 8 MPI shows a significant increase in their levels in both PlpCreERT;Mek/+ and PlpCreERT;Mek/Mek mice compared with controls at all time points. Control values are normalized to 1. Error bars indicate SEM. *p < 0.05, **p < 0.01. n = 3–4 for each condition. WM, White matter; GM, gray matter. D, E, EM images and quantification of myelin thickness by g-ratio analysis (scatter plot) in ventral cervical spinal cord sections from control and PlpCreERT;Mek/+ mice at 6 MPI show a relative increase in myelin thickness (lower g-ratios) in the PlpCreERT;Mek/+ compared with littermate controls (average g-ratios: control, 0.74 ± 0.003; PlpCreERT;Mek/+, 0.68 ± 0.004, p = 4.29 × 10⁻²⁶; ∼500 axons were analyzed per genotype from at least 2 mice in each group). F, G, EM images and quantification of myelin thickness by g-ratio analysis (scatter plot) in optic nerve sections from control and PlpCreERT;Mek/+ mice at 6 MPI show an increase in myelin thickness (lower g-ratios) in the PlpCreERT;Mek/+ compared with littermate controls (average g-ratios: control, 0.78 ± 0.002; PlpCreERT;Mek/+, 0.73 ± 0.004, p = 0.19 × 10⁻¹⁰; ∼500 axons were analyzed from at least two mice per group). H, EM images from optic nerves show enlarged cytoplasmic inner tongue and associated periaxonal collar of myelin (colored) in PlpCreERT;Mek/+ compared with control mice. I, Quantification of the relative area of the cytoplasmic inner tongue with associated periaxonal collar and the area of the axon, (ratio of area) shows that the increase is staistically significant. Approximately 85 axons per group from at least two mice per group were analyzed. Error bars indicate SEM. **p < 0.01.
Figure 4.
Figure 4.
ERK1/2 overactivation upregulates phospho-mTOR in oligodendrocytes of the adult CNS. A, Spinal cord sections from control, PlpCreERT;Mek/+, and PlpCreERT;Mek/Mek mice injected with tamoxifen at 2 months and analyzed at 1 MPI by immunolabeling for phospho-mTOR2448 show that the intensity of cellular staining in the white matter increases in the PlpCreERT;Mek/+ and PlpCreERT;Mek/Mek compared with control mice. Representative images from the analysis of three animals per genotype are shown. Arrowheads point to phospho-mTOR+ cell bodies B, Immunoblot analysis for phospho-mTOR2448 in lysates of spinal cords white matter from control, PlpCreERT;Mek/+, and PlpCreERT;Mek/Mek mice show statistically significant increases in its expression in both the PlpCreERT;Mek/+ and PlpCreERT;Mek/Mek mice compared with controls and a trend toward an increase in the PlpCreERT;Mek/Mek compared with PlpCreERT;Mek/+ mice. GAPDH is shown as the loading control. Error bars indicate SEM. **p < 0.01, one-way ANOVA. n = 3 for each condition.
Figure 5.
Figure 5.
Progressive motor function impairment is caused at later ages in the PlpCreERT;Mek/Mek mice, but not in the PlpCreERT;Mek/+ mice. Rotarod (A) and wire-hanging (B) tests performed at 2–3, 6, and 8 MPI show that PlpCreERT;Mek/Mek, but not PlpCreERT;Mek/+, mice display a progressive reduction in the latency to fall. C, Imprints of hindpaws taken at 6 MPI show that, whereas the control and PlpCreERT;Mek/+ mice have a normal gait, the PlpCreERT;Mek/Mek mice show a dragging motion of their hind feet. Error bars indicate SEM. **p < 0.01. n = 4–9.
Figure 6.
Figure 6.
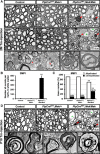
Increasing the strength of ERK1/2 activation in oligodendrocytes results in myelin and axonal pathology at higher doses (Mek/Mek), but not at lower doses (Mek/+) regardless of the timing of its activation. A, Transverse semithin sections of ventral spinal cord from control, PlpCreERT;Mek/+, and PlpCreERT;Mek/Mek mice injected with Tm at 2 months of age and analyzed at 3 and 8 MPI show abnormal myelin profiles with darkly stained ovals (red arrowheads) and degenerating axons, which often appeared as empty spaces surrounded by thin wraps of myelin (green asterisk) in the PlpCreERT;Mek/Mek, but not in the PlpCreERT;Mek/+ or control mice. High-magnification EM images of ventral spinal cords from PlpCreERT;Mek/Mek mice at 8 MPI show unmyelinated (red asterisk) and thinly myelinated axons (Aa), redundant or collapsed myelin profiles representing myelin remaining after axonal loss (Ab), and a degenerating axon with deteriorating myelin sheath (Ac). B, Quantification of darkly stained ovals in half sections of lateral–ventral (L–V) white matter of spinal cord from mice injected with Tm at 2 months and analyzed at 3 MPI show a statistically significant increase in the PlpCreERT;Mek/Mek mice compared with the PlpCreERT;Mek/+ and control mice. C, Quantification of myelinated and unmyelinated axons from EM images of ventral spinal cords shows that the percentage of unmyelinated axons is significantly higher in the PlpCreERT;Mek/Mek mice (∼31%) compared with control and PlpCreERT;Mek/+ mice (∼9%) and the number of myelinated axons is significantly lower; 911 (control), 1284 (Mek/+), and 1442 (Mek/Mek) axons from two animals of each group were examined. D, Transverse semithin sections of ventral spinal cord from control, PlpCreERT;Mek/+, and PlpCreERT;Mek/Mek mice injected with Tm at P10 and analyzed at 8 MPI also show abnormal myelin profiles with darkly stained ovals (red arrowheads) and degenerating axons in the PlpCreERT;Mek/Mek, but not in the PlpCreERT;Mek/+ or control mice. High-magnification EM images from PlpCreERT;Mek/Mek (DaDc) show myelinated axonal profiles with axons in varying stages of degeneration. Multiple images of semithin and ultrathin sections from two to three mice per group were analyzed.
Figure 7.
Figure 7.
Viability of oligodendrocytes is partially affected at later ages in the PlpCreERT;Mek/Mek, but not in the PlpCreERT;Mek/+, mice. Spinal cord transverse sections from control, PlpCreERT;Mek/+, and PlpCreERT;Mek/Mek mice injected with Tm at 2 months were analyzed at 1, 3, 6, and 8 MPI. A, Double immunolabeling shows CC1 (red), EGFP (green), and merged image (yellow; 8 MPI time point is shown). B, Quantification of the total numbers of EGFP+ oligodendrocytes in half-sections of lateral–ventral (L–V) white matter shows that their numbers are progressively reduced in the PlpCreERT;Mek/Mek compared with PlpCreERT;Mek/+, reaching significance by 6 and 8 MPI. C, The numbers of CC1+ oligodendrocytes (OLs) in the PlpCreERT;Mek/+ are comparable to the control and remain largely unchanged at all the time points, whereas in the PlpCreERT;Mek/Mek mice, they show an increase at 6 MPI and reach significance at 8 MPI. D, Spinal cord sections immunolabeled for cleaved caspase-3 show significantly increased numbers of labeled cells in the PlpCreERT;Mek/Mek mice compared with PlpCreERT;Mek/+ or control mice, indicative of increased cell death due to apoptosis. Three to four sections, each from three to five mice of each genotype, were analyzed. Error bars indicate SEM. *p < 0.05, **p < 0.01. n = 3–5.
Figure 8.
Figure 8.
Strong microglial activation and reactive astrocytosis occur in PlpCreERT;Mek/Mek, but not in the PlpCreERT;Mek/+, mice. Transverse sections of cervical spinal cord from control, PlpCreERT;Mek/+, and PlpCreERT;Mek/Mek mice immunolabeled for GFAP (A) or IBA-1 (B) at 3, 6, and 8 MPI show marked presence of reactive astrocytes and activated microglia, respectively, at 6 and 8 MPI in the gray and white matter of PlpCreERT;Mek/Mek, but only a mild increase in the PlpCreERT;Mek/+, by 8 MPI compared with control mice. C, Coronal sections from corpus callosum at 6 MPI mice also show increased IBA1 staining in the PlpCreERT;Mek/Mek, but not in the PlpCreERT;Mek/+ and control mice. n = 3; representative sections are shown. WM, White matter; GM, gray matter.
Figure 9.
Figure 9.
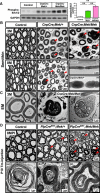
Myelin/axonal pathology occur in the PNS by elevation of ERK1/2 activity in Schwann cells. A, Immunoblot analysis of phospho-ERK1/2 in lysates of sciatic nerves from control, CnpCre;Mek/+, and CnpCre;Mek/Mek mice at P 21 shows a statistically significant graded elevation of ERK1/2 activity with increased dosage of constitutively active Mek1 gene. Error bars represent SEM. **p < 0.01, one-way ANOVA. n = 3. B, Toludine-blue-stained semithin sections of sciatic nerves at 3 months (M) show numerous abnormal myelin figures (examples shown by arrowheads) in the CnpCre;Mek/Mek and to a lesser extent in the CnpCre;Mek/+ mice. By 8 months of age, myelin figures appear more pronounced in the CnpCre;Mek/+ mice as well (percentage of total axons showing pathology, 3 months: control, 2.3 ± 0.2; CnpCre;Mek/+, 26.5 ± 1.6; CnpCre;Mek/Mek, 48.3 ± 2.7. p < 0.01 8 months: control, 3.2 ± 0.6; CnpCre;Mek/+, 38.3 ± 2.5. p < 0.01, 10 fields at 100× per genotype were analyzed from at least two mice per group). Aa, Ab, Sudan black staining of teased fiber preparation of sciatic nerve shows thickening of myelin (tomacula) at the paranodes in the CnpCre;Mek/+ mice, but not in the control mice. C, EM images of sciatic nerves at high magnification from 8-month-old CnpCre;Mek/Mek mice showing examples of abnormal myelin infoldings and axonal degeneration. D, Toludine-blue-stained semithin sections of sciatic nerves from control, PlpCreERT;Mek/+, and PlpCreERT;Mek/Mek mice injected with Tm at P10 and analyzed at 8 MPI show numerous abnormal myelin figures (arrowheads show examples) in the PlpCreERT;Mek/Mek mice and, to a lesser extent, in the PlpCreERT;Mek/+ (percentage of total axons showing abnormal myelin figures: control, 3.1 ± 0.8; PlpCreERT;Mek/+, 10.6 ± 1.2; PlpCreERT;Mek/Mek, 22.3 ± 2.5; p < 0.01, 10 100× fields per genotype were analyzed from at least two mice per group). EM images show a myelinated axon that has completely degenerated leaving only an unraveling myelin sheath (Da) and axons with myelin sheaths with apparently abnormal membranous infolding and outfoldings appearing as concentric rings of myelin (Db, DC). Representative images are shown from two mice per genotype.
Figure 10.
Figure 10.
Increased collagen deposition and mast cell infiltration occur in the sciatic nerves by superelevation of ERK1/2 activity in Schwann cells. A, Gross micrographs showing enlargement of sciatic nerves of CnpCre;Mek/+ and CnpCre;Mek/Mek mice compared with controls at 3 months of age (M). B, Collagen deposition, shown by Masson's trichrome staining (blue) in longitudinal sections of sciatic nerves at 3 months, is enhanced in the CnpCre;Mek/Mek compared with the CnpCre;Mek/+ mice. By 8 months, staining intensity also increases in the CnpCre;Mek/+ mice. EM image of sciatic nerve shows collagen fibers in the CnpCre;Mek/Mek mice. C, Mast cell infiltration, shown by Giemsa staining (blue) in longitudinal sections of sciatic nerves, is increased at 3 months in the CnpCre;Mek/Mek compared with the CnpCre;Mek/+ mice (number of mast cells/field: control, 0.6 ± 0.3; CnpCre;Mek/+, 5.5 ± 0.3; CnpCre;Mek/Mek, 9.9 ± 0.3. p < 0.01, ∼9 fields at 20× were counted from 3 animals per genotype. By 8 months, mast cell numbers are further increased in the CnpCre;Mek/+ mice, as well (12.5 ± 1.8 cells/field). EM image shows mast cells in the sciatic nerves of these mice. Representative images are shown from three mice per genotype.

Similar articles

Cited by

References

    1. Bansal R, Pfeiffer SE. FGF-2 converts mature oligodendrocytes to a novel phenotype. J Neurosci Res. 1997;50:215–228. - PubMed
    1. Canoll PD, Kraemer R, Teng KK, Marchionni MA, Salzer JL. GGF/neuregulin induces a phenotypic reversion of oligodendrocytes. Mol Cell Neurosci. 1999;13:79–94. doi: 10.1006/mcne.1998.0733. - DOI - PubMed
    1. Cotter L, Ozçelik M, Jacob C, Pereira JA, Locher V, Baumann R, Relvas JB, Suter U, Tricaud N. Dlg1-PTEN interaction regulates myelin thickness to prevent damaging peripheral nerve overmyelination. Science. 2010;328:1415–1418. doi: 10.1126/science.1187735. - DOI - PubMed
    1. Crawley JN. What's wrong with my mouse? In: Crawley JN, editor. Behavioral phenotype of transgenic and knockout mice. New York: Wiley; 2007. pp. 62–109.
    1. Dickinson RJ, Keyse SM. Diverse physiological functions for dual-specificity MAP kinase phosphatases. J Cell Sci. 2006;119:4607–4615. doi: 10.1242/jcs.03266. - DOI - PubMed

MeSH terms

Substances

LinkOut - more resources