. 2016 Sep;20(9):1749-60.
doi: 10.1111/jcmm.12893. Epub 2016 Jun 16.

Methylglyoxal induces cell death through endoplasmic reticulum stress-associated ROS production and mitochondrial dysfunction

Affiliations

Methylglyoxal induces cell death through endoplasmic reticulum stress-associated ROS production and mitochondrial dysfunction

Chi-Ming Chan et al. J Cell Mol Med. 2016 Sep.

Abstract

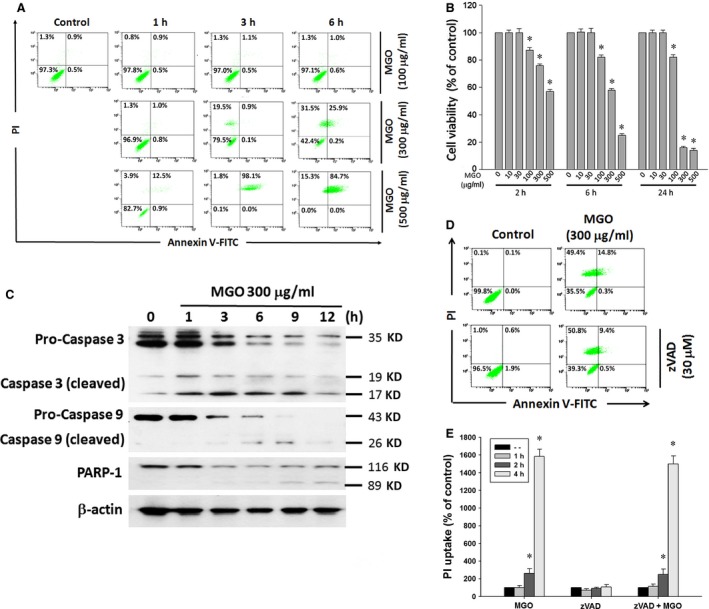
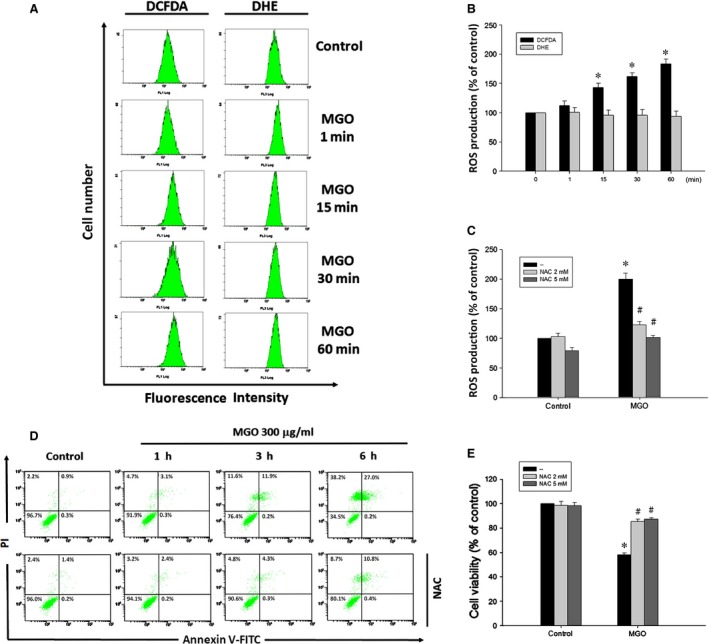
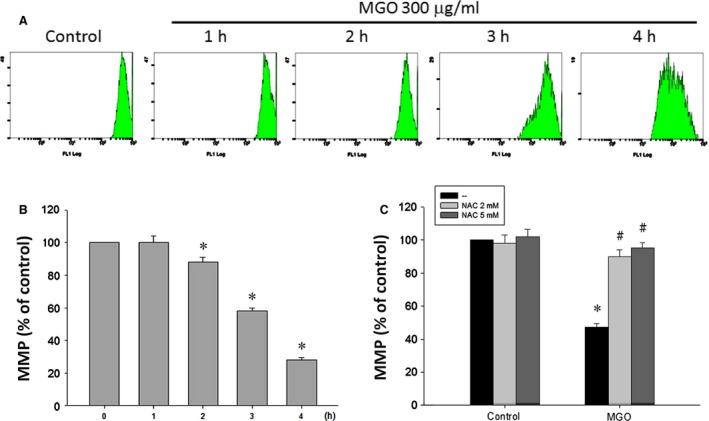
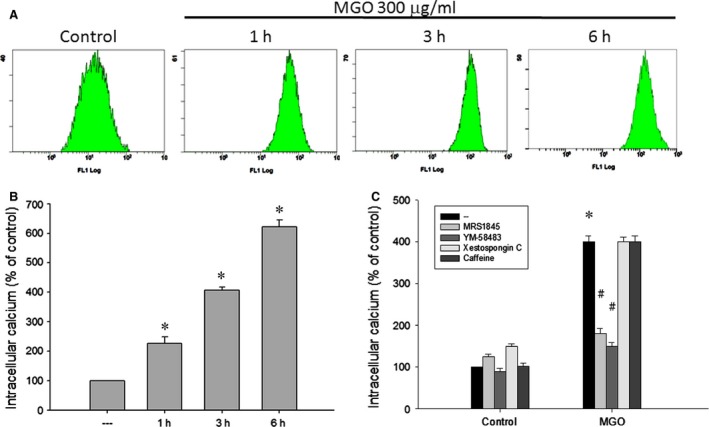
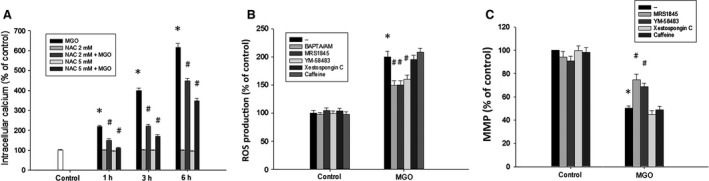
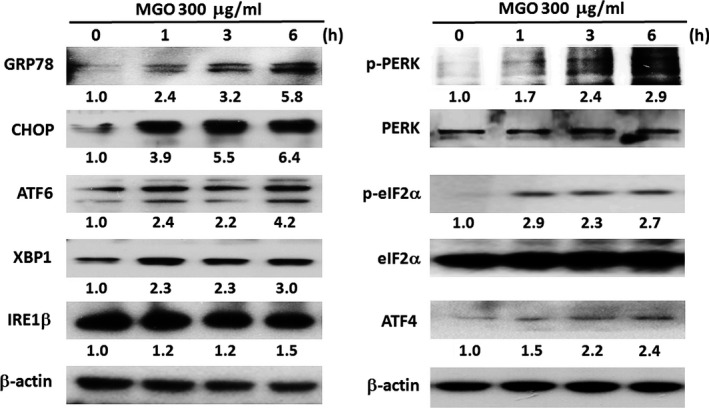
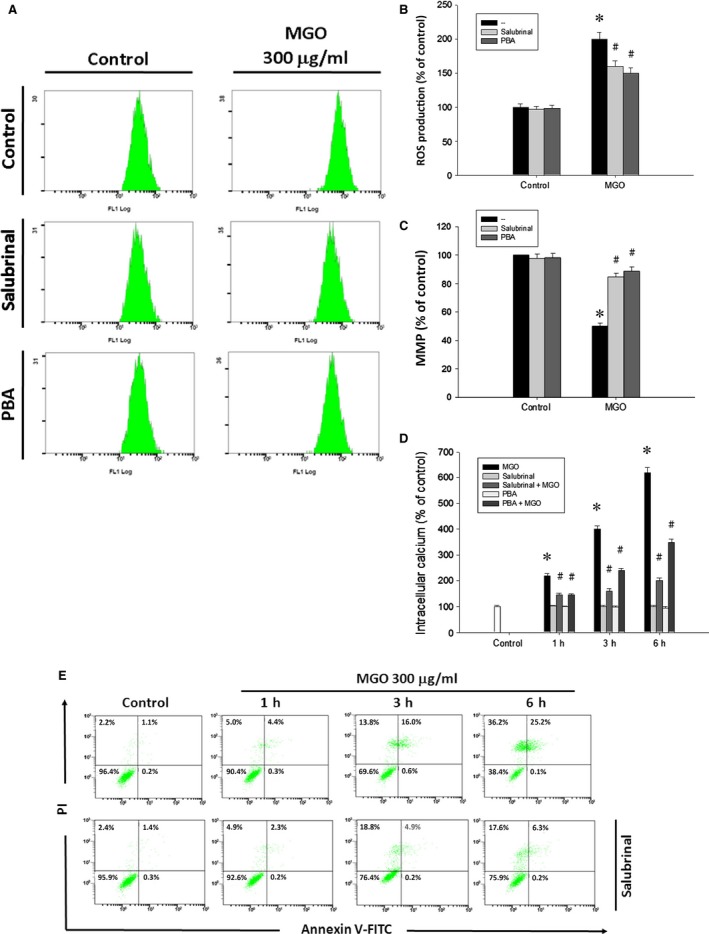
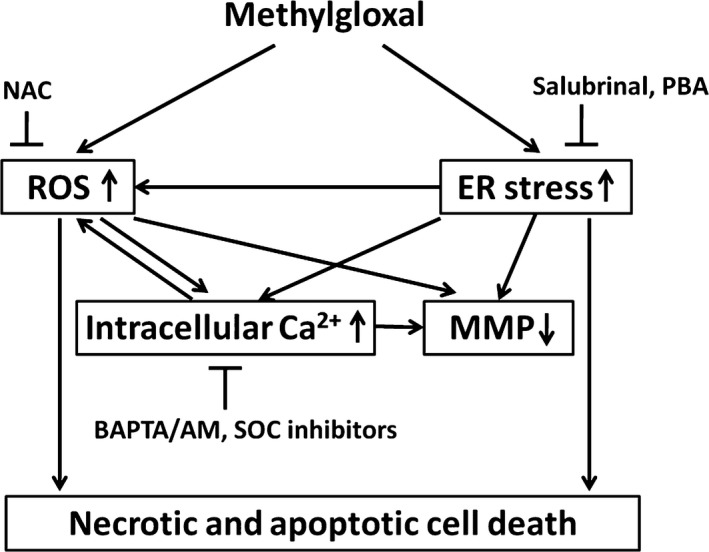
Diabetic retinopathy (DR) and age-related macular degeneration (AMD) are two important leading causes of acquired blindness in developed countries. As accumulation of advanced glycation end products (AGEs) in retinal pigment epithelial (RPE) cells plays an important role in both DR and AMD, and the methylglyoxal (MGO) within the AGEs exerts irreversible effects on protein structure and function, it is crucial to understand the underlying mechanism of MGO-induced RPE cell death. Using ARPE-19 as the cell model, this study revealed that MGO induces RPE cell death through a caspase-independent manner, which relying on reactive oxygen species (ROS) formation, mitochondrial membrane potential (MMP) loss, intracellular calcium elevation and endoplasmic reticulum (ER) stress response. Suppression of ROS generation can reverse the MGO-induced ROS production, MMP loss, intracellular calcium increase and cell death. Moreover, store-operated calcium channel inhibitors MRS1845 and YM-58483, but not the inositol 1,4,5-trisphosphate (IP3) receptor inhibitor xestospongin C, can block MGO-induced ROS production, MMP loss and sustained intracellular calcium increase in ARPE-19 cells. Lastly, inhibition of ER stress by salubrinal and 4-PBA can reduce the MGO-induced intracellular events and cell death. Therefore, our data indicate that MGO can decrease RPE cell viability, resulting from the ER stress-dependent intracellular ROS production, MMP loss and increased intracellular calcium increase. As MGO is one of the components of drusen in AMD and is the AGEs adduct in DR, this study could provide a valuable insight into the molecular pathogenesis and therapeutic intervention of AMD and DR.

Keywords: ER stress; intracellular calcium; methylglyoxal; mitochondria; reactive oxygen species; retinal pigment epithelium.


Figures

Figure 1
Figure 1
MGO decreases cell viability and induces caspase‐independent cell death in ARPE‐19 cells. (A) Cells were treated with various concentrations (100, 300 or 500 μg/ml) of MGO for 1, 3 or 6 h, and then stained with annexin V and PI, and evaluated by flow cytometry. (B) Cells were treated with various concentrations (10–500 μg/ml) of MGO for 2, 6 or 24 h. Cell viability was determined by MTT assay and the percentages of viability as compared to vehicle‐treated cells were plotted as the mean ± SE of at least three independent experiments. (C) Cells were treated with 300 μg/ml MGO for the indicated times. Cells were lysed and expression levels of indicated proteins were detected by Western blotting by using antibodies against caspase 3, caspase 9, PARP‐1 and β‐actin. (D) Cells were treated with pan‐caspase inhibitor zVAD (30 μM) for 30 min, followed by the treatment with 300 μg/ml MGO for 6 h. Cell viability was determined by annexin V/PI double staining assay. (E) After cells were treated with zVAD and MGO (300 μg/ml) for 1, 2 and 4 h, PI uptake was measured by flow cytometry. *P < 0.05, indicating the significant induction of cell death by MGO.
Figure 2
Figure 2
ROS scavenger suppresses MGO‐induced ROS generation and cell death in ARPE‐19 cells. (A, B) Cells were incubated with 300 μg/ml MGO for the indicated times, and then treated with H2 DCFDA (10 μM) or DHE (5 μM) for 30 min. Cellular ROS levels were measured using flow cytometry, and presented as percentages of control. (C) After pre‐treatment with 2 or 5 mM NAC for 30 min, MGO‐induced mitochondrial ROS production at 1 h was measured with H2 DCFDA by using flow cytometry. (D) MGO‐induced cell death was assessed by pre‐treatment with NAC (2 mM) for 6 h. Cells were stained with annexin V and PI, and evaluated by flow cytometry. (E) Cell viability was determined by MTT assay at 6 h. *P < 0.05, indicating the significant increase of mitochondrial ROS production (B, C) and decrease of cell viability (E) by MGO. # P < 0.05, indicating the significant effects of NAC to reverse the actions of MGO in ROS production (C) and cell death (E).
Figure 3
Figure 3
ROS scavenger suppresses MGO‐induced MMP reduction in ARPE‐19 cells. (A, B) Cells were incubated with 300 μg/ml MGO for 1, 2, 3 or 4 h. MMP was measured with rhodamine 123 by using flow cytometry. (C) Cells were pre‐incubated with 2 or 5 mM NAC for 30 min and then incubated with 300 μg/ml MGO for 3 h. *P < 0.05, indicating the significant decrease of MMP by MGO. # P < 0.05, indicating the significant ability of NAC to restore MMP under MGO treatment.
Figure 4
Figure 4
SOC channel inhibitors reduce MGO‐induced intracellular calcium increase in ARPE‐19 cells. (A, B) Cells were incubated with 300 μg/ml MGO for 1, 3 or 6 h. (C) Cells were pre‐treated with MRS1845 (10 μM), YM‐58483 (10 μM), xestospongin C (1 μM) or caffeine (10 mM) for 30 min, and then incubated with 300 μg/ml MGO for 3 h. Intracellular calcium levels were determined by using Fluo‐3 AM and flow cytometry. *P < 0.05, indicating the significant increase of intracellular calcium level by MGO. # P < 0.05, indicating the significant inhibition of MGO‐elicited intracellular calcium increase.
Figure 5
Figure 5
Reciprocal amplification of ROS production and intracellular calcium increase in MGO‐treated ARPE‐19 cells. (A) Cells were pre‐incubated with NAC (2 or 5 mM) for 30 min and then incubated with 300 μg/ml MGO for 1, 3 or 6 h. Intracellular calcium levels were determined by using Fluo‐3 AM and flow cytometry. (B, C) Cells were pre‐treated with BAPTA/AM (10 μM), MRS1845 (10 μM), YM‐58483 (10 μM), xestospongin C (1 μM) or caffeine (10 mM) for 30 min and then incubated with 300 μg/ml MGO. After 1 h, cellular ROS levels were measured with H2 DCFDA by using flow cytometry (B). After 3 h, MMP was measured with rhodamine 123 by using flow cytometry (C). *P < 0.05, indicating the significant effects of MGO. # P < 0.05, indicating the significant inhibition of MGO responses by indicated agents.
Figure 6
Figure 6
MGO induces ER stress response in ARPE‐19 cells. Cells were treated with 300 μg/ml MGO for the indicated times. Cell lysates were analysed by Western blot with antibodies specific to GRP78, CHOP, ATF6α (p90), XBP1, IRE1β, p‐PERK, PERK, p‐eIF2α, eIF2α, ATF4 and β‐actin. Results were representative of three independent experiments. The changes of protein expression were normalized to β‐actin (the cases of GRP78, CHOP, ATF6, XBP‐1, IRE1β and ATF4) or total protein (the cases for PERK and eIF2α), and then compared to the control group without MGO treatment.
Figure 7
Figure 7
ER stress inhibitors suppress MGO‐induced ROS generation, MMP reduction, intracellular calcium increase and cell death in ARPE‐19 cells. Cells were pre‐treated with 10 μM salubrinal or 3 mM 4‐phenylbutyrate (PBA) for 1 h and then incubated with 300 μg/ml MGO. (A, B) After MGO incubation for 1 h, cellular ROS levels were measured with H2 DCFDA by using flow cytometry. (C) After MGO incubation for 3 h, MMP was measured with rhodamine 123 by using flow cytometry. (D) After MGO incubation for 3 h, intracellular calcium levels were determined by using Fluo‐3 AM and flow cytometry. *P < 0.05, indicating the significant effect of MGO alone. # P < 0.05, indicating the significant inhibitory effects of salubrinal and PBA on MGO responses. (E) After MGO incubation for 6 h, cell viability was determined by annexin V and PI staining, and evaluated by flow cytometry.
Figure 8
Figure 8
Summary of molecular mechanisms underlying MGO‐induced cell death in RPE cells.

References

    1. Simo R, Villarroel M, Corraliza L, et al The retinal pigment epithelium: something more than a constituent of the blood‐retinal barrier–implications for the pathogenesis of diabetic retinopathy. J Biomed Biotechnol. 2010; 2010: 190724. - PMC - PubMed
    1. Bhutto I, Lutty G. Understanding age‐related macular degeneration (AMD): relationships between the photoreceptor/retinal pigment epithelium/Bruch's membrane/choriocapillaris complex. Mol Aspects Med. 2012; 33: 295–317. - PMC - PubMed
    1. Saaddine JB, Honeycutt AA, Narayan KM, et al Projection of diabetic retinopathy and other major eye diseases among people with diabetes mellitus: United States, 2005‐2050. Arch Ophthalmol. 2008; 126: 1740–7. - PubMed
    1. Congdon N, O'Colmain B, Klaver CC, et al Causes and prevalence of visual impairment among adults in the United States. Arch Ophthalmol. 2004; 122: 477–85. - PubMed
    1. Mettu PS, Wielgus AR, Ong SS, et al Retinal pigment epithelium response to oxidant injury in the pathogenesis of early age‐related macular degeneration. Mol Aspects Med. 2012; 33: 376–98. - PubMed

Publication types

MeSH terms