. 2016 Jun 28;113(26):7219-24.
doi: 10.1073/pnas.1600581113. Epub 2016 Jun 15.

Disruption of the AMPK-TBC1D1 nexus increases lipogenic gene expression and causes obesity in mice via promoting IGF1 secretion

Affiliations

Disruption of the AMPK-TBC1D1 nexus increases lipogenic gene expression and causes obesity in mice via promoting IGF1 secretion

Liang Chen et al. Proc Natl Acad Sci U S A. .

Abstract

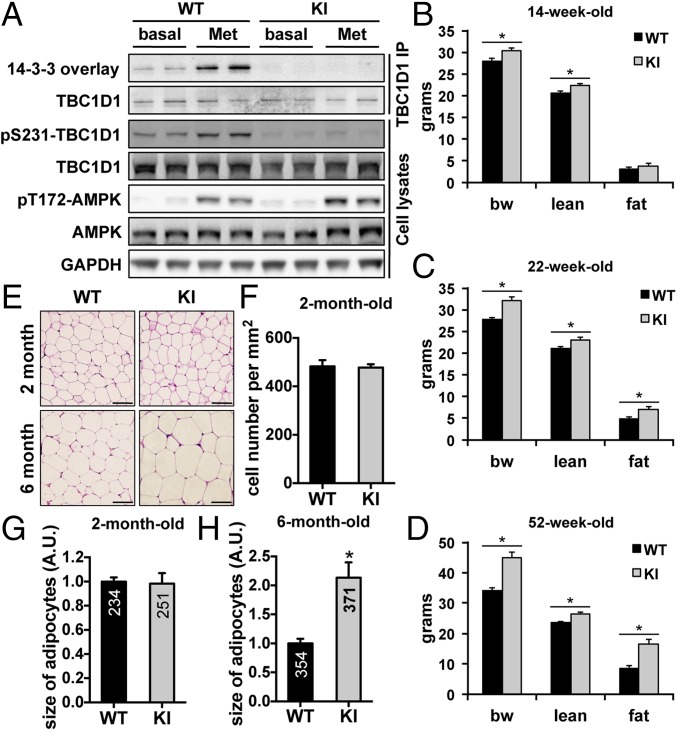
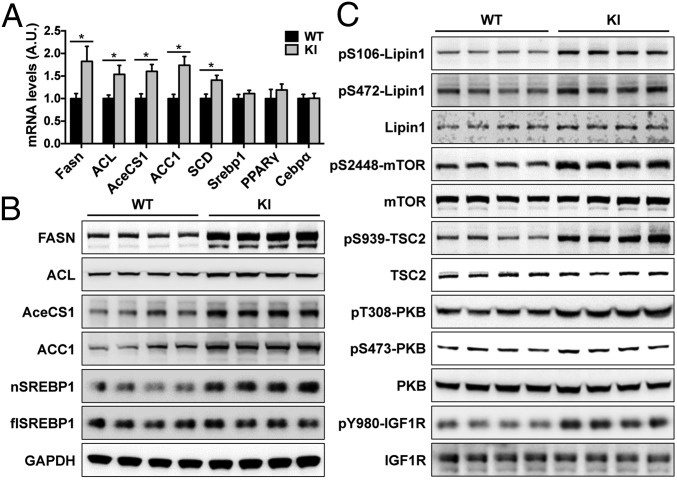
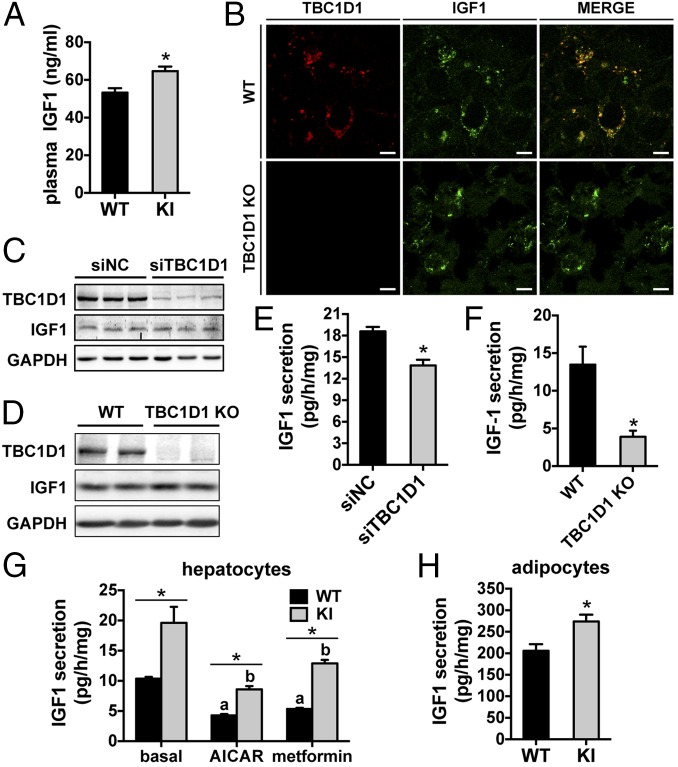
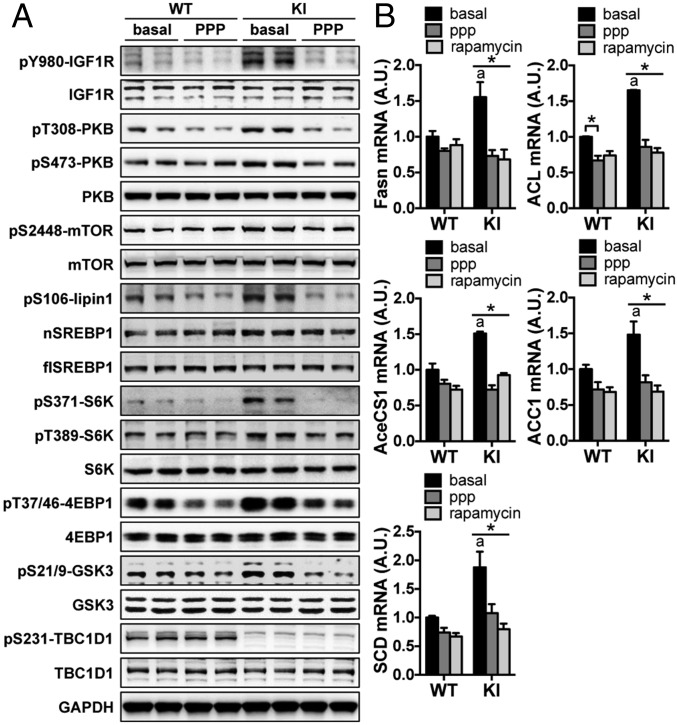
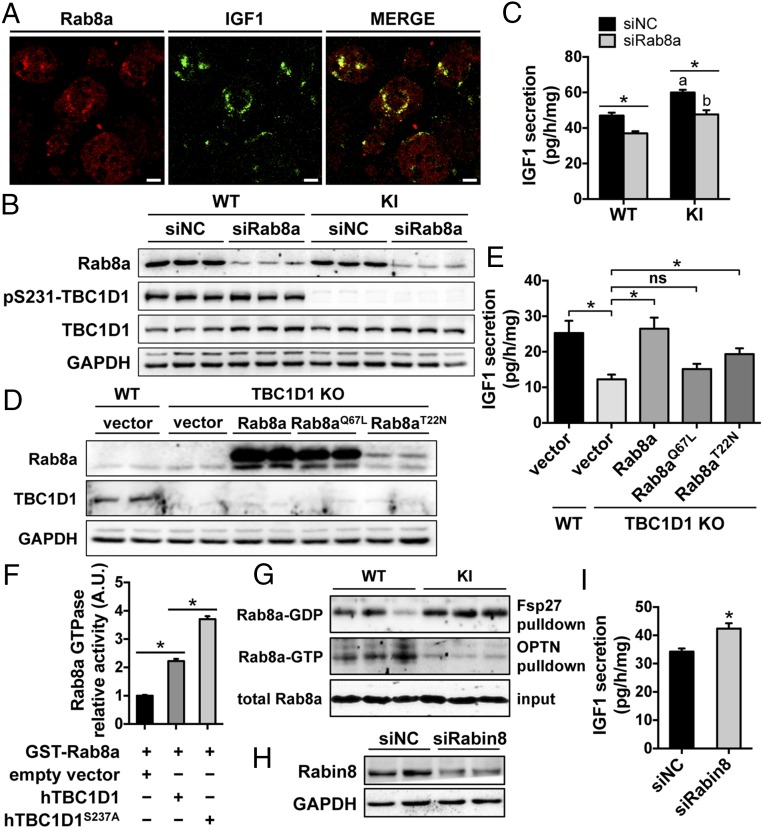
Tre-2/USP6, BUB2, cdc16 domain family member 1 (the TBC domain is the GTPase activating protein domain) (TBC1D1) is a Rab GTPase activating protein that is phosphorylated on Ser(231) by the AMP-activated protein kinase (AMPK) in response to intracellular energy stress. However, the in vivo role and importance of this phosphorylation event remains unknown. To address this question, we generated a mouse model harboring a TBC1D1(Ser231Ala) knockin (KI) mutation and found that the KI mice developed obesity on a normal chow diet. Mechanistically, TBC1D1 is located on insulin-like growth factor 1 (IGF1) storage vesicles, and the KI mutation increases endocrinal and paracrinal/autocrinal IGF1 secretion in an Rab8a-dependent manner. Hypersecretion of IGF1 causes increased expression of lipogenic genes via activating the protein kinase B (PKB; also known as Akt)-mammalian target of rapamycin (mTOR) pathway in adipose tissues, which contributes to the development of obesity, diabetes, and hepatic steatosis as the KI mice age. Collectively, these findings demonstrate that the AMPK-TBC1D1 signaling nexus interacts with the PKB-mTOR pathway via IGF1 secretion, which consequently controls expression of lipogenic genes in the adipose tissue. These findings also have implications for drug discovery to combat obesity.

Keywords: AMPK; IGF1 secretion; TBC1D1; obesity; phosphorylation.


Conflict of interest statement

The authors declare no conflict of interest.

Figures

Fig. 1.
Fig. 1.
Generation and characterization of the TBC1D1 KI mice. (A) Ser231 phosphorylation and 14-3-3 binding of TBC1D1 isolated from primary hepatocytes that had been treated with metformin (Met) for 1 h. (B–D) Body composition of the male TBC1D1Ser231Ala KI mice measured at the age of 14 wk (B, WT: n = 18; KI: n = 19), 20–22 wk (C, WT: n = 15; KI: n = 15), and 52 wk (D, WT: n = 8; KI: n = 9). (E–H) Histology (E) and cell number (F) and size (G and H) of the adipose from the WT and TBC1D1 KI male mice. Bars indicate 50 μm in length. Six sections per genotype were analyzed to measure cell numbers. The numbers shown in the bar graphs refer to the number of cells measured in the experiments. The data are given as the mean ± SEM, and the asterisk indicates P < 0.05.
Fig. 2.
Fig. 2.
Lipogenenic gene expression in the adipose of the TBC1D1 KI mice. (A) mRNA expression of indicated genes in the epididymal fat of the WT and KI male mice (16 wk old). n = 5. (B) Expression of indicated proteins were measured in the adipose from the WT and KI male mice (16 wk old) using GAPDH as a loading control. (C) Phosphorylated and total lipin1, mTOR, TSC2, PKB, and IGF1R were measured in the adipose from the KI mice and WT littermates (16 wk old). The data are given as the mean ± SEM, and the asterisk indicates P < 0.05.
Fig. 3.
Fig. 3.
Plasma IGF1 levels and IGF1 secretion in primary cells from the TBC1D1 KI mice. (A) Plasma levels of IGF1 in the male WT and KI mice (8 wk old). n = 7. (B) Colocalization of TBC1D1 and IGF1 in primary hepatocytes. Bars indicate 10 μm in length. (C and D) Expression of TBC1D1 and IGF1 in TBC1D1-depleted primary hepatocytes via siRNA (C) or in primary hepatocytes from the TBC1D1 KO mice (D). NC, negative control. (E and F) IGF1 secretion in TBC1D1-depleted primary hepatocytes (E) or in primary hepatocytes from the TBC1D1 KO mice (F). NC, negative control. n = 6. (G) IGF1 secretion in primary hepatocytes from the WT and TBC1D1 KI mice. aP < 0.05 (WT metformin or AICAR vs. WT untreated) and bP < 0.05 (KI metformin or AICAR vs. KI untreated). n = 8. (H) IGF1 secretion in primary adipocytes from the KI mice. WT: n = 5; KI: n = 6. The data are given as the mean ± SEM, and the asterisk indicates P < 0.05. Statistical analysis for G was carried out using two-way ANOVA.
Fig. 4.
Fig. 4.
Effects of IGF1R inhibition on activation of the PKB–TSC2–mTOR pathway and lipogenic gene expression in primary adipocytes from the TBC1D1 KI mice. (A) Phosphorylated and total forms of indicated proteins, and nSREBP1 and flSREBP1 were measured in PPP treated or untreated primary adipocytes from the TBC1D1 KI and WT mice using GAPDH as a loading control. (B) mRNA expression of lipogenic genes in primary adipocytes treated with or without PPP or rapamycin. n = 3. The data are given as the mean ± SEM. Statistical analyses were carried out using two-way ANOVA. The asterisk indicates P < 0.05 (basal vs. PPP or rapamycin). aP < 0.05 (KI basal vs. WT basal).
Fig. 5.
Fig. 5.
Rab8a and IGF1 secretion in primary hepatocytes. (A) Colocalization of Rab8a and IGF1 in primary hepatocytes. Bars indicate 10 μm in length. (B and C) Down-regulation of Rab8a in primary hepatocytes from the WT and TBC1D1 KI mice via siRNA (B), and IGF1 secretion in Rab8a-depleted primary hepatocytes (C). n = 6. (D and E) Expression of indicated proteins (D) and IGF1 secretion (E) in TBC1D1 KO primary hepatocytes expressing Rab8a WT and mutant proteins. n = 6. (F) The GTPase activity of recombinant GST-Rab8a was measured in the presence of immunoprecipitated WT or hTBC1D1S237A mutant protein. n = 5. (G) Levels of GDP-bound Rab8a and GTP-bound Rab8a in the epididymal fat of the WT and KI male mice (5 mo old) were determined using pulldown assays. (H and I) Down-regulation of Rabin8 in primary hepatocytes via siRNA (H) and IGF1 secretion in Rabin8-depleted primary hepatocytes (I). NC, negative control. n = 6.

References

    1. Hardie DG, Ross FA, Hawley SA. AMPK: A nutrient and energy sensor that maintains energy homeostasis. Nat Rev Mol Cell Biol. 2012;13(4):251–262. - PMC - PubMed
    1. Hawley SA, et al. Complexes between the LKB1 tumor suppressor, STRAD alpha/beta and MO25 alpha/beta are upstream kinases in the AMP-activated protein kinase cascade. J Biol. 2003;2(4):28. - PMC - PubMed
    1. Woods A, et al. LKB1 is the upstream kinase in the AMP-activated protein kinase cascade. Curr Biol. 2003;13(22):2004–2008. - PubMed
    1. Hardie DG. AMPK: A target for drugs and natural products with effects on both diabetes and cancer. Diabetes. 2013;62(7):2164–2172. - PMC - PubMed
    1. Fullerton MD, et al. Single phosphorylation sites in Acc1 and Acc2 regulate lipid homeostasis and the insulin-sensitizing effects of metformin. Nat Med. 2013;19(12):1649–1654. - PMC - PubMed

Publication types

MeSH terms