. 2016 Aug 12;90(17):7667-83.
doi: 10.1128/JVI.00813-16. Print 2016 Sep 1.

Latency-Associated Nuclear Antigen E3 Ubiquitin Ligase Activity Impacts Gammaherpesvirus-Driven Germinal Center B Cell Proliferation

Affiliations

Latency-Associated Nuclear Antigen E3 Ubiquitin Ligase Activity Impacts Gammaherpesvirus-Driven Germinal Center B Cell Proliferation

Sofia A Cerqueira et al. J Virol. .

Abstract

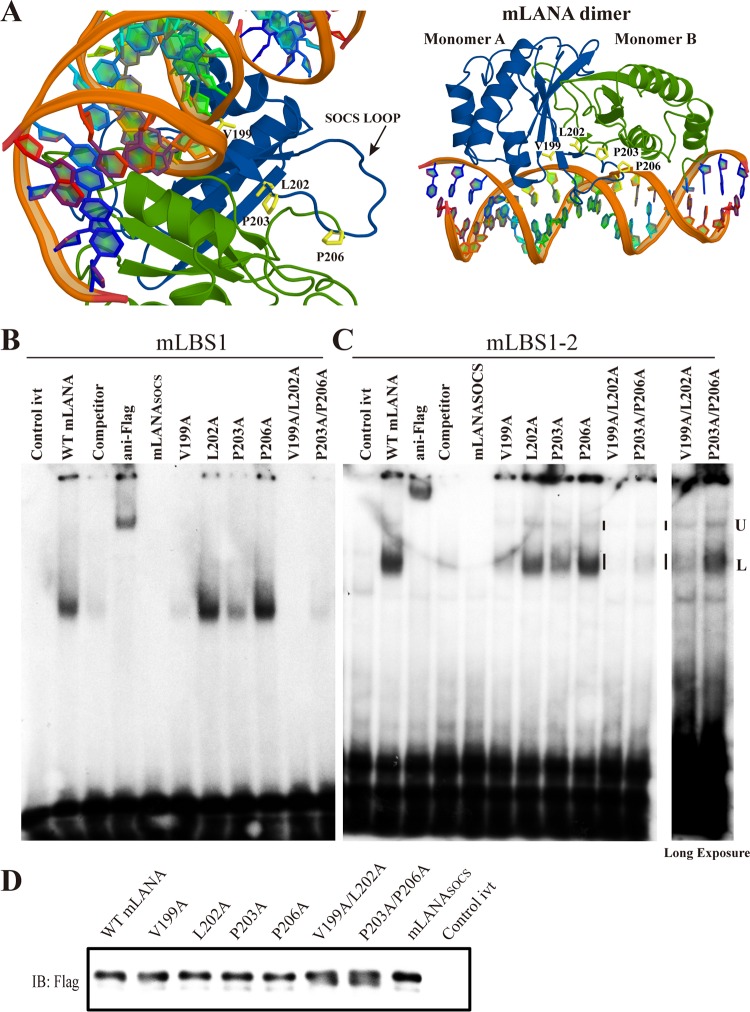
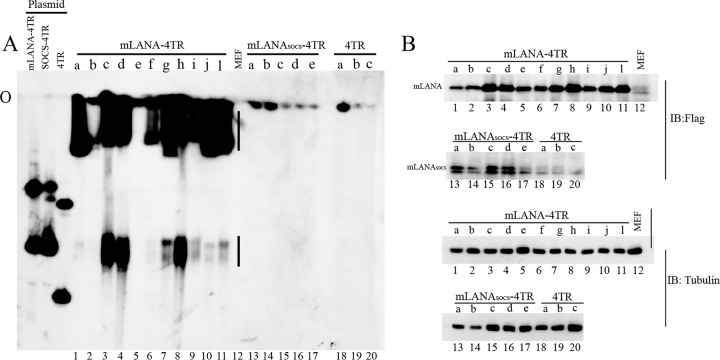
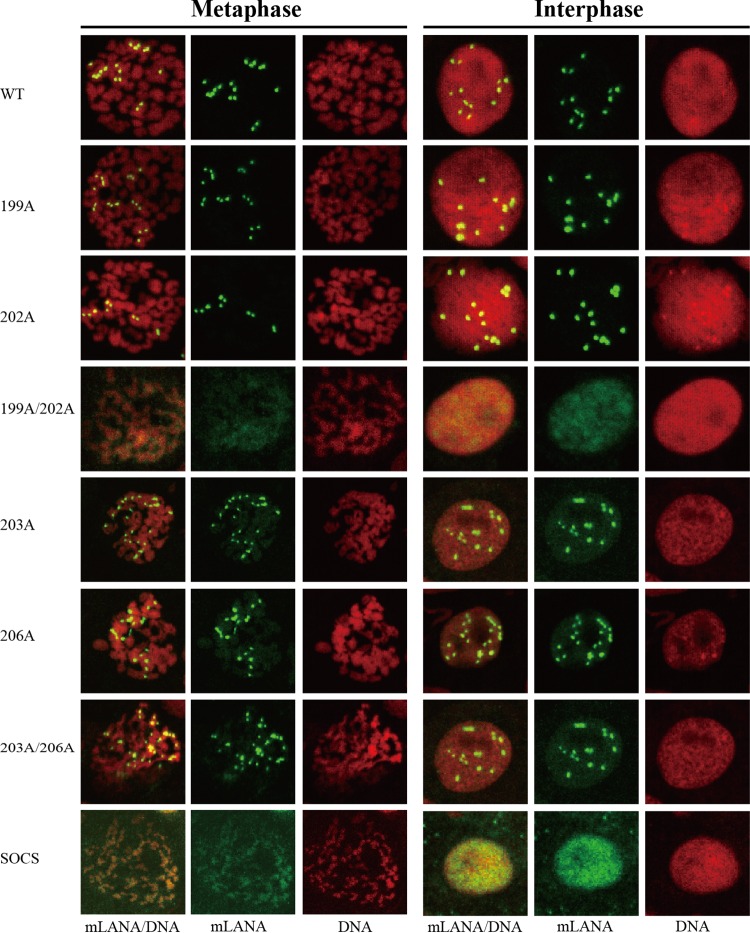
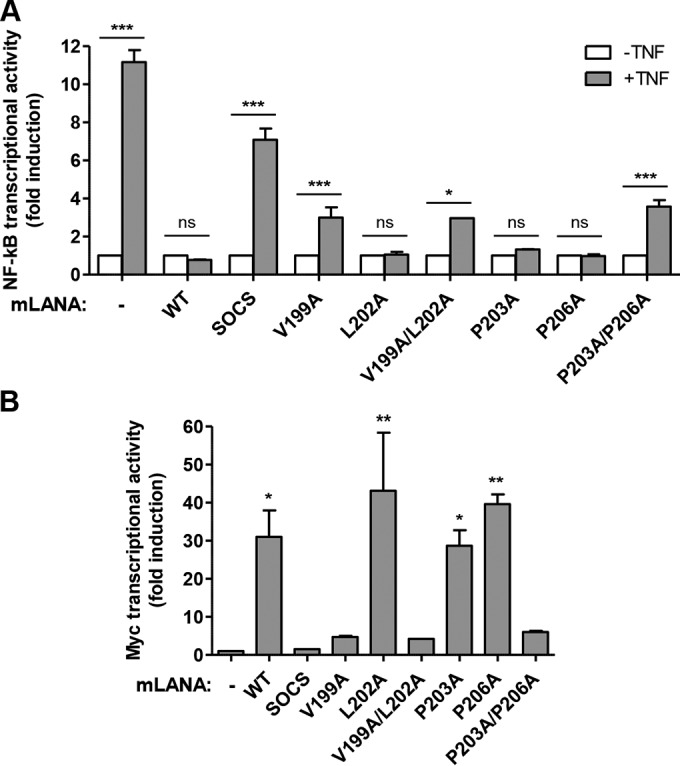
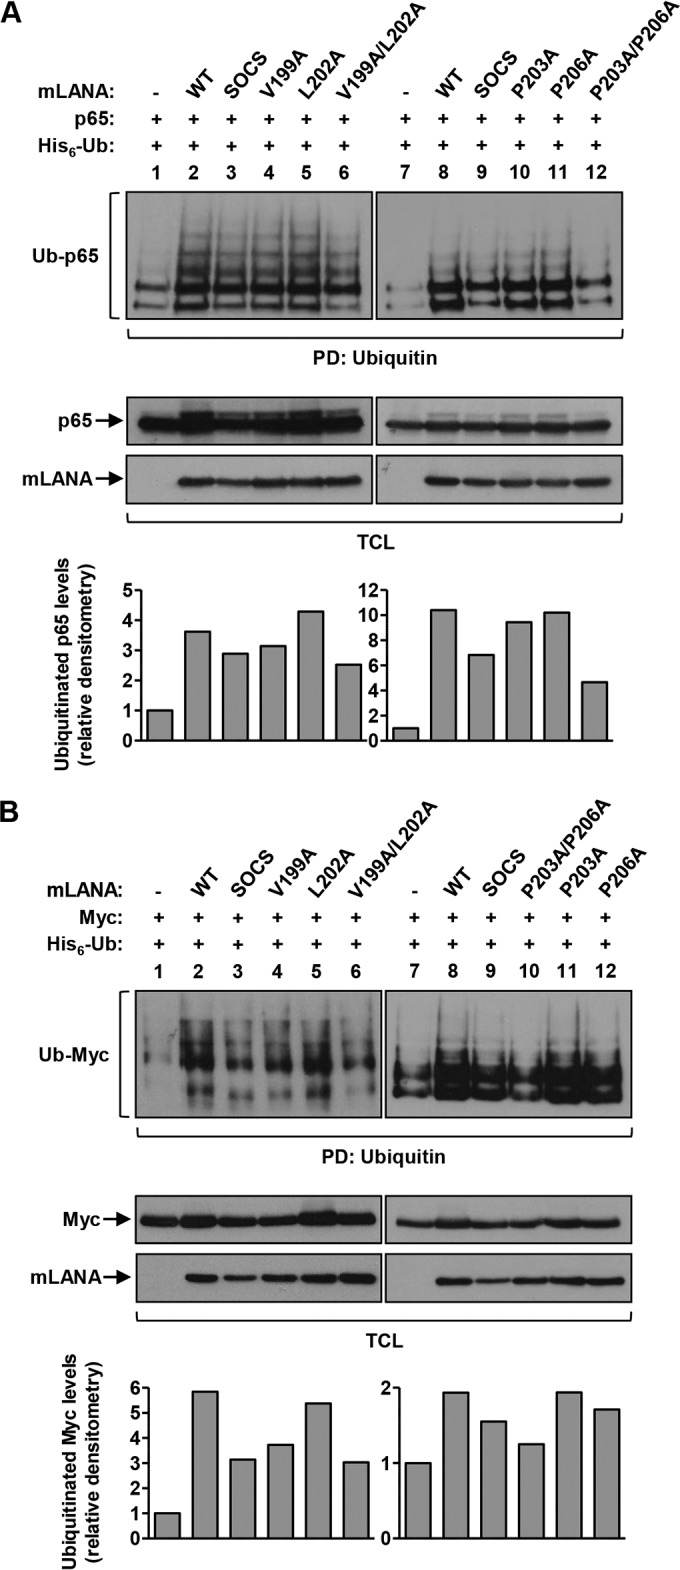
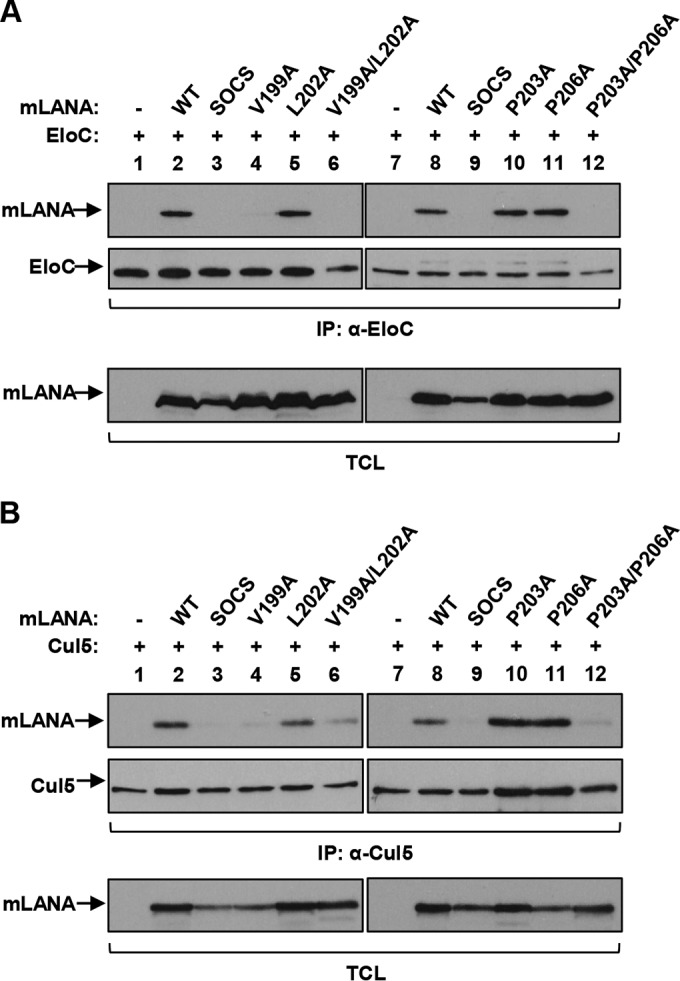
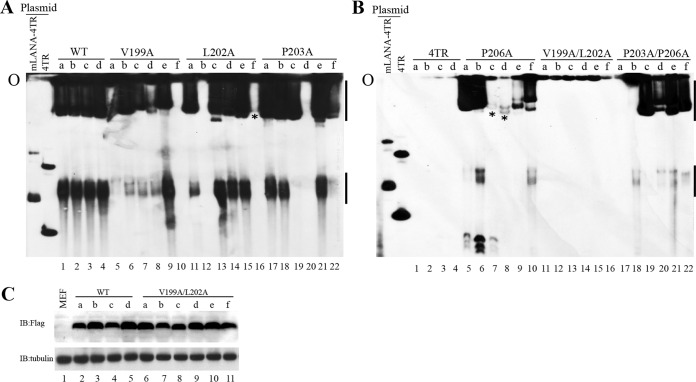
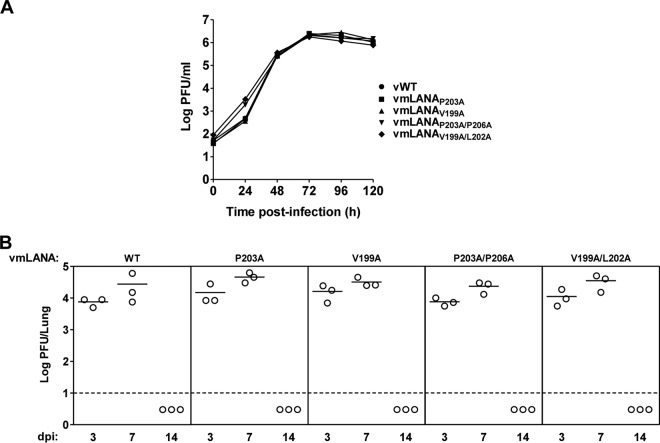
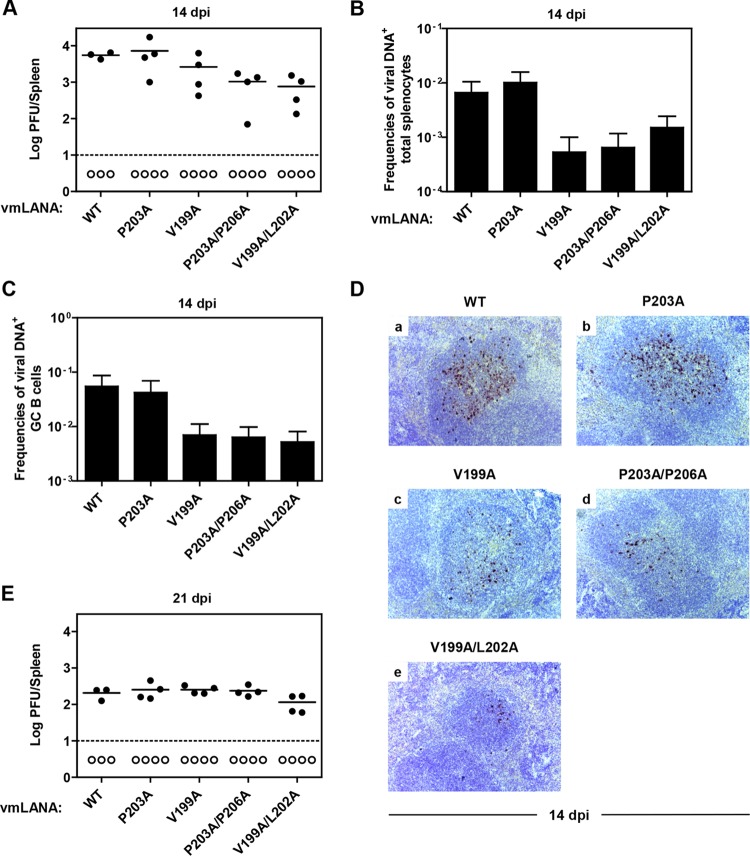
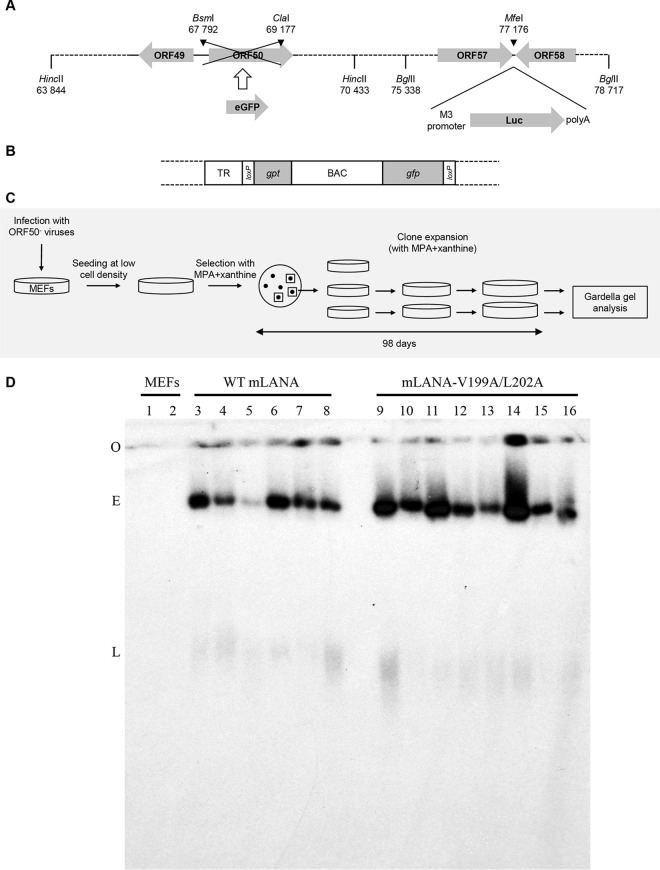
Viruses have evolved mechanisms to hijack components of cellular E3 ubiquitin ligases, thus modulating the ubiquitination pathway. However, the biological relevance of such mechanisms for viral pathogenesis in vivo remains largely unknown. Here, we utilized murid herpesvirus 4 (MuHV-4) infection of mice as a model system to address the role of MuHV-4 latency-associated nuclear antigen (mLANA) E3 ligase activity in gammaherpesvirus latent infection. We show that specific mutations in the mLANA SOCS box (V199A, V199A/L202A, or P203A/P206A) disrupted mLANA's ability to recruit Elongin C and Cullin 5, thereby impairing the formation of the Elongin BC/Cullin 5/SOCS (EC5S(mLANA)) complex and mLANA's E3 ligase activity on host NF-κB and Myc. Although these mutations resulted in considerably reduced mLANA binding to viral terminal repeat DNA as assessed by electrophoretic mobility shift assay (EMSA), the mutations did not disrupt mLANA's ability to mediate episome persistence. In vivo, MuHV-4 recombinant viruses bearing these mLANA SOCS box mutations exhibited a deficit in latency amplification in germinal center (GC) B cells. These findings demonstrate that the E3 ligase activity of mLANA contributes to gammaherpesvirus-driven GC B cell proliferation. Hence, pharmacological inhibition of viral E3 ligase activity through targeting SOCS box motifs is a putative strategy to control gammaherpesvirus-driven lymphoproliferation and associated disease.

Importance: The gammaherpesviruses Epstein-Barr virus (EBV) and Kaposi's sarcoma-associated herpesvirus (KSHV) cause lifelong persistent infection and play causative roles in several human malignancies. Colonization of B cells is crucial for virus persistence, and access to the B cell compartment is gained by virus-driven proliferation in germinal center (GC) B cells. Infection of B cells is predominantly latent, with the viral genome persisting as a multicopy episome and expressing only a small subset of viral genes. Here, we focused on latency-associated nuclear antigen (mLANA) encoded by murid herpesvirus-4 (MuHV-4), which exhibits homology in sequence, structure, and function to KSHV LANA (kLANA), thereby allowing the study of LANA-mediated pathogenesis in mice. Our experiments show that mLANA's E3 ubiquitin ligase activity is necessary for efficient expansion of latency in GC B cells, suggesting that the development of pharmacological inhibitors of LANA E3 ubiquitin ligase activity may allow strategies to interfere with gammaherpesvirus-driven lymphoproliferation and associated disease.


Figures

FIG 1
FIG 1
Effect of SOCS motif mutations on mLANA TR DNA binding. (A) Structural model of the mLANA DNA binding domain dimer (blue, monomer A; green, monomer B) (Protein Data Bank [PDB] code 4BLG) (24) complexed with DNA (using the mLANA DBD superposed on the kLANA-LBS1 crystal structure [PDB code 4UZB]) (51). kLBS1 DNA is shown as an orange ribbon. V199, L202, P203, and P206 are highlighted in stick representation and colored yellow. The left view is rotated 180° about the x axis and +45° about the y axis relative to the view on the right to highlight the SOCS loop of monomer A. The SOCS motif is located adjacent to the DNA binding surface and also the dimerization interface. (B and C) 32P-labeled mLBS1 (B) or mLBS1-2 (C) oligonucleotides were incubated with in vitro-translated mLANA or mLANA mutants, and complexes were detected after resolution by gel electrophoresis. A longer exposure is shown on the right. The vertical bars indicate upper (U) and lower (L) LBS1-2 complexes. (D) Anti-FLAG Western blot of in vitro-translated mLANA used in EMSAs. IB, immunoblot.
FIG 2
FIG 2
mLANA-SOCS cannot establish episome persistence. (A and B) MEFs were transfected with mLANA-m4TR, SOCS-m4TR, or m4TR. Forty-eight hours later, the cells were trypsinized, reseeded into 15-cm dishes, and placed under G418 selection. G418-resistant colonies were picked and expanded. (A) Gardella gel containing G418-resistant MEFs transfected with mLANA-m4TR (lanes 1 to 11), mLANA SOCS-m4TR (lanes 12 to 17), or m4TR (lanes 18 to 20); ∼2 × 10⁶ cells were loaded per lane. Input plasmids mLANA-4mTR, mLANA-SOCS-m4TR, and m4TR DNA are in the lanes on the left. O, gel origin. The vertical lines indicate episomal DNA. (B) Western blot of mLANA and tubulin for the cells in panel A. The letters above the lanes correspond to the lowercase letters in panel A.
FIG 3
FIG 3
Distribution of mLANA or mLANA mutants in interphase and mitosis. mLANA-m4TR or mLANA-m4TR containing SOCS box mutations stably expressed in MEFs was detected in interphase or metaphase. mLANA or mLANA mutants (green) were detected with antibody directed against the mLANA C-terminal FLAG epitope. DNA was counterstained with propidium iodide (red). The overlay of green and red results in yellow. Brightness and contrast were uniformly adjusted for some panels from the same field with Adobe Photoshop. Magnification, ×630.
FIG 4
FIG 4
mLANAV199A, mLANAV199A/L202A, and mLANAP203A/P206A exhibit impaired ability to inhibit NF-κB and activate Myc transcriptional activities. HEK 293T cells were transiently transfected with an NF-κB (A) or Myc (B) luciferase reporter vector and a plasmid encoding mLANA (WT or mutants), as indicated at the bottom. In panel A, transfected cells were either stimulated with 50 ng/ml of TNF (+TNF) or left unstimulated (−TNF). NF-κB (A) and Myc (B) transcriptional activities associated with each sample were assayed using a luminometer. The results are shown as the fold induction relative to luciferase activity measured in unstimulated cells (A) or in cells that did not express mLANA (B). The error bars represent standard errors of the mean (SEM) for triplicate results from two independent transfection experiments. The statistical significance of the difference between groups was evaluated by two-way analysis of variance (ANOVA) (A) or one-way ANOVA (B) (ns, not significant; *, P < 0.05; **, P < 0.01; ***, P < 0.001).
FIG 5
FIG 5
mLANAV199A, mLANAV199A/L202A, and mLANAP203A/P206A exhibit diminished capability to promote p65 and Myc polyubiquitination. HEK 293T cells were transiently transfected with plasmids encoding mLANA (WT or mutants), p65 (A), or Myc (B) and histidine-tagged ubiquitin, as indicated at the top. After 48 h, total cellular lysates were subjected to Ni-NTA pulldown, allowing the purification of ubiquitinated proteins. The levels of ubiquitinated p65 (A) or Myc (B) under each condition were assayed using an anti-p65 or anti-Myc antibody (first panel), respectively. Representative aliquots of the total cellular lysates were used to detect the appropriate expression of p65 (A) or Myc (B) (second panel) and mLANA (third panel). The graphs at the bottom show densitometry analysis of ubiquitinated p65 (A) and ubiquitinated Myc (B) levels present under each experimental condition, expressed as fold induction relative to cells not expressing mLANA. −, without; +, with. PD, pulldown; TCL, total cellular lysates; Ub, ubiquitinated.
FIG 6
FIG 6
mLANAV199A, mLANAV199A/L202A, and mLANAP203A/P206A are unable to recruit Elongin C and weakly associate with Cullin 5. HEK 293T cells were transiently transfected with plasmids encoding mLANA (WT or mutants) and Elongin C (A) or Cullin 5 (B), as indicated at the top. After 48 h, the cells were lysed, and the total cellular lysates were subjected to immunoprecipitation using an anti-Elongin C (A) or anti-Cullin 5 (B) antibody. (Top) The immunoprecipitates were analyzed by Western blotting. (Bottom) Representative aliquots of the total cellular lysates were used to detect the appropriate expression of mLANA. EloC, Elongin C; Cul5, Cullin 5.
FIG 7
FIG 7
Effect of SOCS motif mutations on mLANA episome persistence. (A and B) MEFs were transfected with mLANA-4TR, m4TR, or mLANA mutants. Forty-eight hours later, the cells were trypsinized, reseeded into 15-cm dishes, and placed under G418 selection. G418-resistant clones were picked and expanded; ∼2 × 10⁶ cells were loaded per lane for Gardella gels. (A) Gardella gel containing G418-resistant MEFs transfected with mLANA-4TR (lanes 1 to 4), mLANAV199A-4TR (lanes 5 to 10), mLANAL202A-m4TR (lanes 11 to 16), or mLANAP203A-m4TR (lanes 17 to 22). Input plasmids mLANA-4mTR and m4TR DNA are in the lanes on the left. O, gel origin. The vertical lines indicate episomal DNA. The asterisk indicates faint episomal DNA signal in lane 16. (B) Gardella gel containing G418-resistant MEFs transfected with m4TR (lanes 1 to 4), mLANAP206A-4TR (lanes 5 to 10), mLANAV199A/L202A-4TR (lanes 11 to 16), or mLANAP203A/P206A-4TR (lanes 17 to 22). The vertical lines indicate episomal DNA. The asterisks indicate faint episomal DNA signal in lanes 7 and 8. Signal migrating faster than episomal DNA in panels A and B was likely due to partially replicated episomes or degraded episomal DNA. (C) Immunoblot of mLANA or tubulin for mLANA-m4TR or mLANAV199A/L202A-m4TR cells in panels A and B.
FIG 8
FIG 8
Recombinant MuHV-4s display normal lytic replication kinetics in vitro and in vivo. (A) Multistep growth curves were constructed by infection of BHK-21 cells with the indicated viruses at a low multiplicity of infection (0.01 PFU/cell). At the indicated times postinfection, samples were harvested, and virus titers were determined by plaque assay of freeze-thawed samples. (B) BALB/c mice were intranasally infected with 104 PFU of the indicated viruses. At 3, 7, and 14 days postinfection, the lungs were removed and infectious viruses were titrated by plaque assay of freeze-thawed lung homogenates. Each point shows the titer for an individual mouse. The horizontal lines indicate arithmetic means. The dashed line represents the limit of detection of the assay.
FIG 9
FIG 9
Impairment of mLANA E3 ubiquitin ligase activity impacts MuHV-4 latency amplification in GC B cells. (A) Quantification of latent infection in the spleen by ex vivo coculture assay. BALB/c mice were intranasally infected with 104 PFU of the indicated viruses. At day 14 postinfection, latent viruses in spleens were titrated by ex vivo coculture assay (solid circles). Titers of infectious viruses were determined in freeze-thawed splenocyte suspensions (open circles). Each circle represents the titer for an individual mouse. The dashed line represents the limit of detection of the assay. The latency levels of vmLANAP203A/P206A and vmLANAV199A/L202A were significantly lower than those of vWT (P < 0.05 by two-tailed unpaired t test). (B and C) Quantification of viral-DNA-positive cells in total splenocytes (B) and in GC B cells (C). BALB/c mice were intranasally infected with 104 PFU of the indicated viruses. At 14 dpi, reciprocal frequencies of viral infection in total splenocytes (B) or FACS-purified GC B cells (CD19+ CD95hi GL7hi) (C) were determined by limiting dilution and real-time PCR. The data were obtained from pools of three or four spleens per group. The bars represent the frequency of viral-DNA-positive cells with 95% confidence intervals. (D) Identification of latently infected cells within the spleen by in situ hybridization. BALB/c mice were intranasally infected with 104 PFU of the indicated viruses. At 14 dpi, spleens were dissected and processed for in situ hybridization with a viral tRNA/miRNA-specific riboprobe. The images show representative spleen sections from each group of animals. Dark staining indicates cells positive for virus-encoded tRNAs/miRNAs. All the sections are magnified ×200 and counterstained with hematoxylin. (E) Quantification of latent infection in the spleen by ex vivo coculture assay. BALB/c mice were intranasally infected with 104 PFU of the indicated viruses. At day 21 postinfection, latent viruses in spleens were titrated by ex vivo coculture assay (solid circles). Titers of infectious viruses were determined in freeze-thawed splenocyte suspensions (open circles). Each circle represents the titer for an individual mouse. The dashed line represents the limit of detection of the assay.
FIG 10
FIG 10
mLANAV199A/L202A efficiently mediates MuHV-4 episome persistence. (A) Schematic diagram showing the insertion of eGFP in place of the deleted ORF50 gene and the insertion of an M3 promoter-luciferase-poly(A) cassette between ORF57 and ORF58, as described by Milho et al. (31). Relevant restriction sites are shown. (B) Schematic diagram showing the left end of the BAC-cloned MuHV-4 genome, with viral terminal repeats and the gpt gene, and BAC sequences and the gfp gene, flanked by loxP sites, as described by Adler et al. (34). (C) Schematic diagram showing the experimental setting of establishment of MEF lines latently infected with ORF50-deficient viruses. MEF-1 cells were infected with ORF50-deficient viruses at a multiplicity of infection of 3 PFU per cell. Two days after infection, the cells were trypsinized, counted, and seeded at low density. Fresh medium containing MPA and xanthine was added. Resistant clones were picked, expanded under continued drug selection, and analyzed in Gardella gels for the presence of viral genomes. (D) After 98 days of MPA selection, ∼5 × 10⁶ cells were loaded per lane for Gardella gel analysis. The Gardella gel contained uninfected (lanes 1 and 2), vORF50 mLANA-WT-infected (lanes 3 to 8), or vORF50 mLANAV199A/L202A-infected (lanes 9 to 16) MEFs. O, gel origin; E, episomal DNA; L, linear MuHV-4 DNA resulting from low-level lytic replication; Luc, luciferase.

Similar articles

Cited by

References

    1. Berndsen CE, Wolberger C. 2014. New insights into ubiquitin E3 ligase mechanism. Nat Struct Mol Biol 21:301–307. doi:10.1038/nsmb.2780. - DOI - PubMed
    1. Lydeard JR, Schulman BA, Harper JW. 2013. Building and remodelling Cullin-RING E3 ubiquitin ligases. EMBO Rep 14:1050–1061. doi:10.1038/embor.2013.173. - DOI - PMC - PubMed
    1. Skaar JR, Pagan JK, Pagano M. 2013. Mechanisms and function of substrate recruitment by F-box proteins. Nat Rev Mol Cell Biol 14:369–381. doi:10.1038/nrm3582. - DOI - PMC - PubMed
    1. Yoshimura A, Naka T, Kubo M. 2007. SOCS proteins, cytokine signalling and immune regulation. Nat Rev Immunol 7:454–465. doi:10.1038/nri2093. - DOI - PubMed
    1. Cai QL, Knight JS, Verma SC, Zald P, Robertson ES. 2006. EC5S ubiquitin complex is recruited by KSHV latent antigen LANA for degradation of the VHL and p53 tumor suppressors. PLoS Pathog 2:e116. doi:10.1371/journal.ppat.0020116. - DOI - PMC - PubMed

Publication types

LinkOut - more resources