. 2016 Dec 15;22(24):6176-6191.
doi: 10.1158/1078-0432.CCR-15-3107. Epub 2016 Jun 15.

BMI-1 Targeting Interferes with Patient-Derived Tumor-Initiating Cell Survival and Tumor Growth in Prostate Cancer

Affiliations

BMI-1 Targeting Interferes with Patient-Derived Tumor-Initiating Cell Survival and Tumor Growth in Prostate Cancer

Nitu Bansal et al. Clin Cancer Res. .

Abstract

Purpose: Current prostate cancer management calls for identifying novel and more effective therapies. Self-renewing tumor-initiating cells (TICs) hold intrinsic therapy resistance and account for tumor relapse and progression. As BMI-1 regulates stem cell self-renewal, impairing BMI-1 function for TIC-tailored therapies appears to be a promising approach.

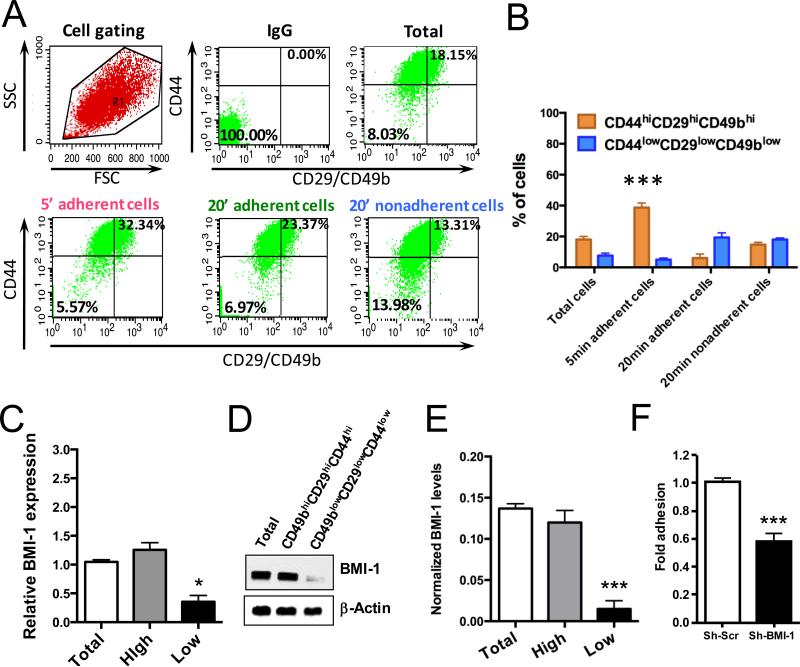
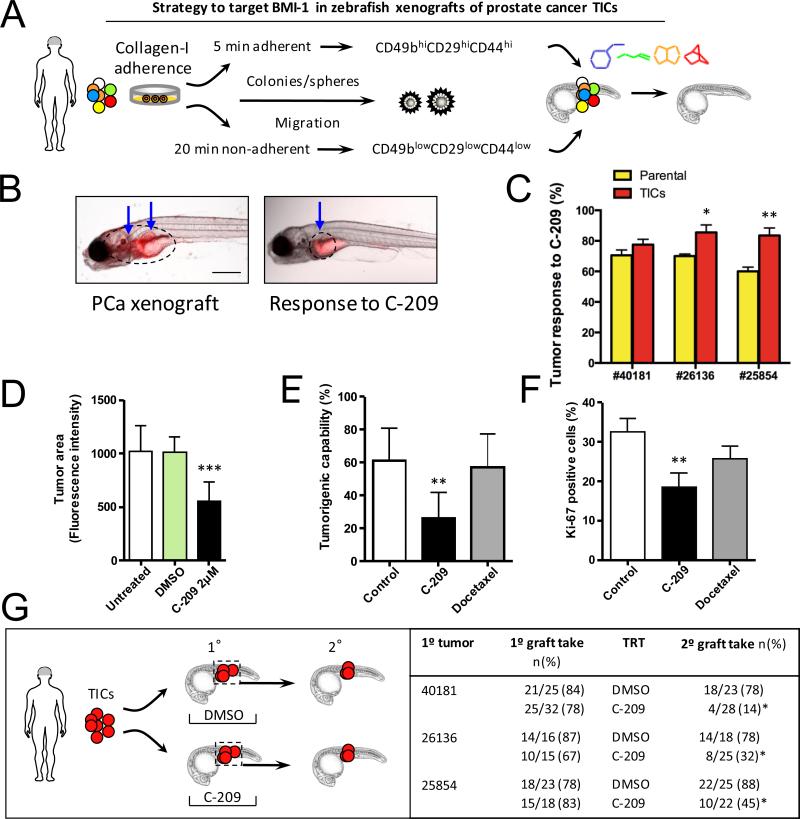
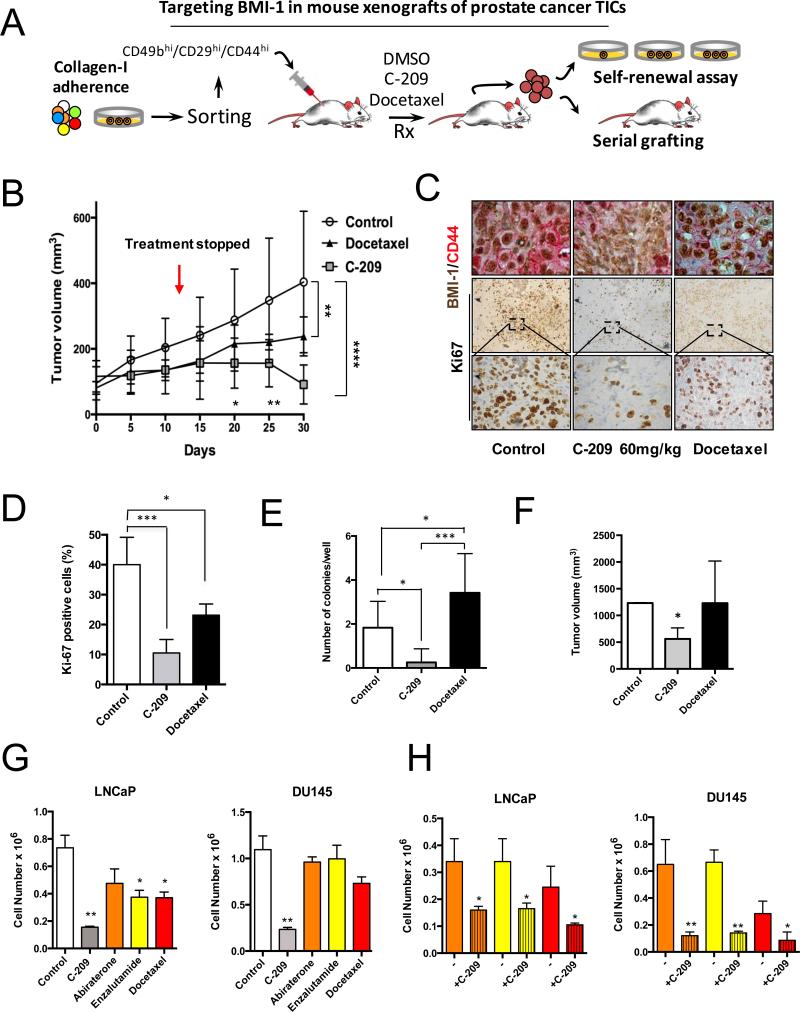
Experimental design: We have previously developed a combined immunophenotypic and time-of-adherence assay to identify CD49bhiCD29hiCD44hi cells as human prostate TICs. We utilized this assay with patient-derived prostate cancer cells and xenograft models to characterize the effects of pharmacologic inhibitors of BMI-1.

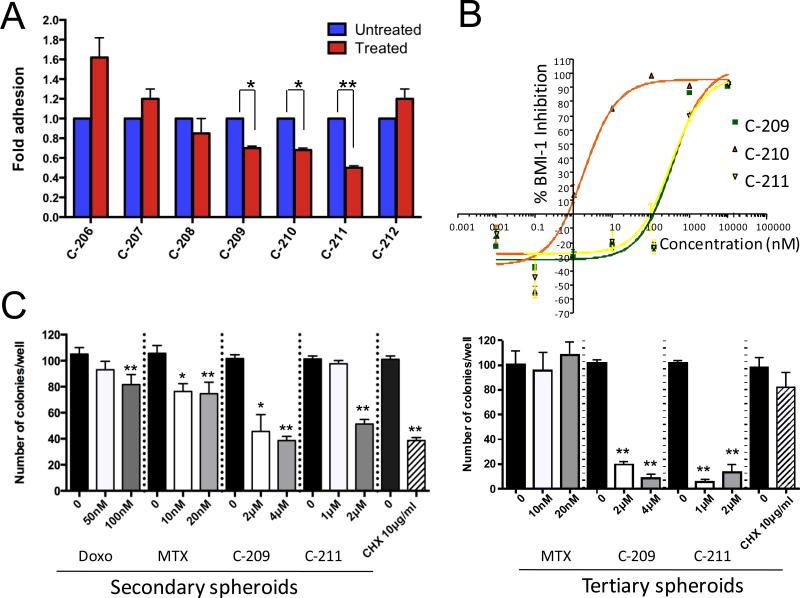
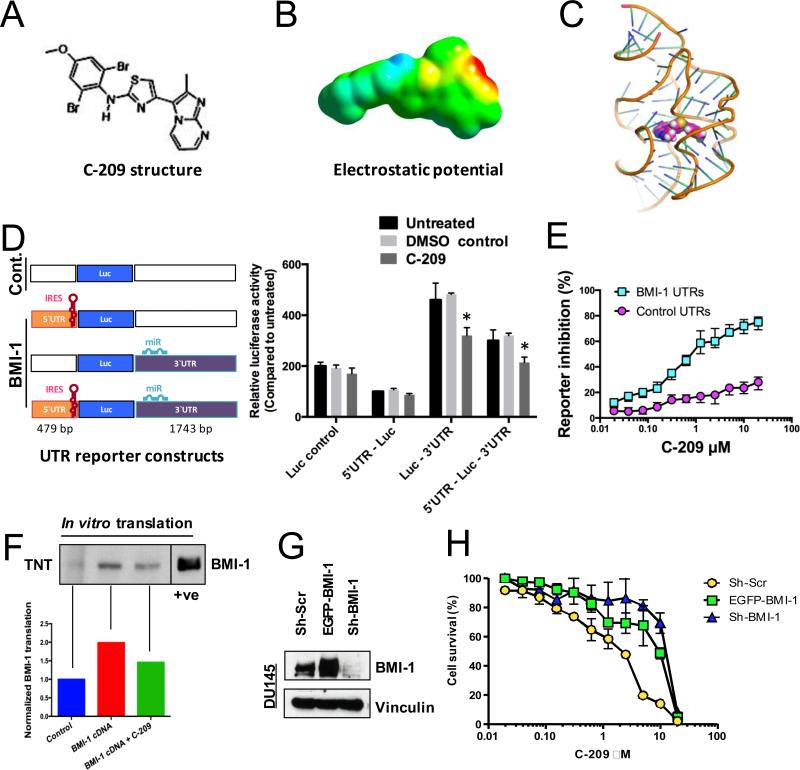
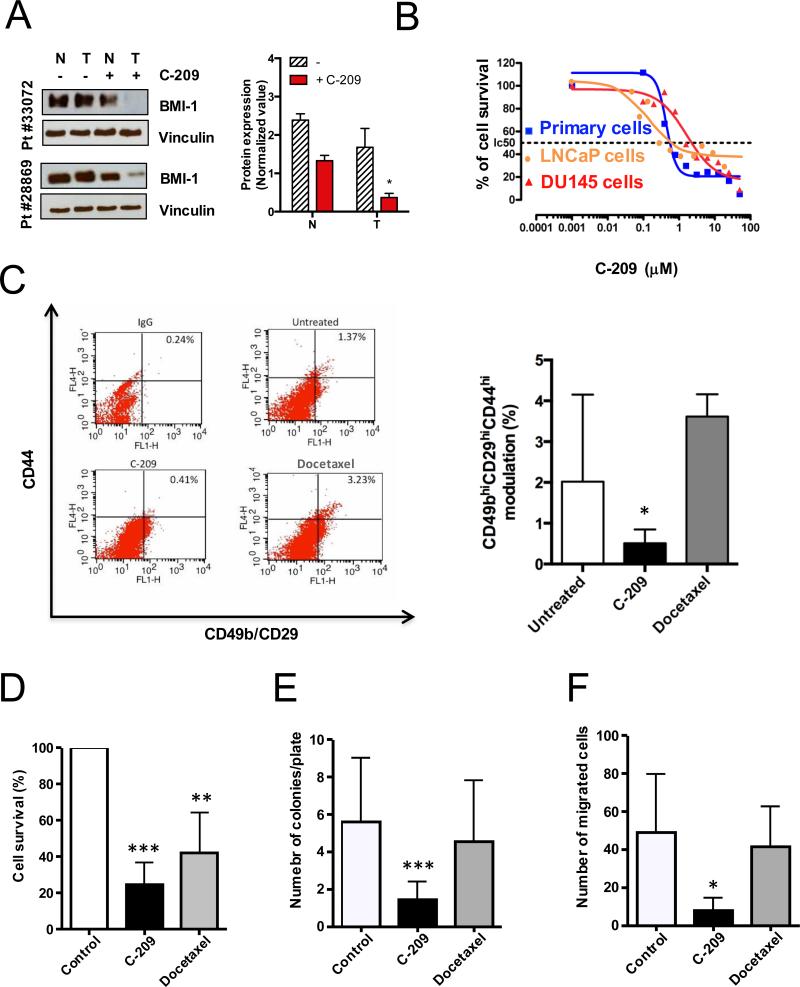
Results: We demonstrate that in cell lines and patient-derived TICs, BMI-1 expression is upregulated and associated with stem cell-like traits. From a screened library, we identified a number of post-transcriptional small molecules that target BMI-1 in prostate TICs. Pharmacologic inhibition of BMI-1 in patient-derived cells significantly decreased colony formation in vitro and attenuated tumor initiation in vivo, thereby functionally diminishing the frequency of TICs, particularly in cells resistant to proliferation- and androgen receptor-directed therapies, without toxic effects on normal tissues.

Conclusions: Our data offer a paradigm for targeting TICs and support the development of BMI-1-targeting therapy for a more effective prostate cancer treatment. Clin Cancer Res; 22(24); 6176-91. ©2016 AACR.


Figures

Figure 1
Figure 1
Assessment of BMI-1 in PCa TICs isolated by combined adherence and phenotypic assays. A, Flow cytometric analyses. B, Percentage of cells identified by flow cytometry to express the TIC phenotype. C, Relative mRNA BMI-1 level in total, CD49bhiCD29hiCD44hi (high) and CD49blowCD29lowCD44low (low) DU145 cells. D, Western blot analysis showing BMI-1 expression levels between total, CD49bhiCD29hiCD44hi and CD49blowCD29lowCD44low DU145 cells. E, BMI-1 expression quantitation from 6 independent experiments. Anti-actin was used as a loading control. F, Fold adhesion of rapidly adherent CD49bhiCD29hiCD44hi cells assessed over total DU145 control (Sh-Scr) and DU145 BMI-1-depleted (Sh-BMI-1) cells. Results are shown as mean ± S.D. of three independent experiments. **P-value <0.01, ***P-value <0.001.
Figure 2
Figure 2
BMI-1 inhibition reduces TIC number and interferes with self-renewal capacity in vitro. A, Fold adhesion of rapidly adherent CD49bhiCD29hiCD44hi cells evaluated upon treatment of total DU145 with inhibitors targeting BMI-1 for 72hrs. B, IC50s of compounds C-209-211 assessed in DU145 cells through an ELISA assay. C, Effects of BMI-1 post-transcriptional inhibitors vs. the non-specific protein translation inhibitor cycloheximide (CHX), or the chemotherapeutics methotrexate (MTX) and doxorubicin on secondary (left) and tertiary (right) prostate spheroids formation. Treatments that were statistically significant were indicated as *p <0.05 and **p<0.01, compared to untreated.
Figure 3
Figure 3
Modulation of BMI-1 post-transcriptional regulation by C-209. A, Chemical structure of C-209. B, The electrostatic potential of C-209 mapped to electron density surface. At an IC50 of 2μM, the electrostatic potential E(RB3LYP) = −1423.42386733 au and dipole moment = 9.4906 Debye. C, Docking of C-209 to the human BMI-1 RNA. View of C-209 (space filling model colored magenta) within the binding pocket of the BMI-1 5‘UTR model (ribbon). Illustration was created using the Pymol software package. D, Left, Schematic diagram of the luciferase (Luc) constructs used. The diagrams display the IRES containing 5‘UTR and the micro-RNA (miR) binding sites within the 3‘UTR. The base pair (bp) length of the human BMI-1 5` and 3‘UTRs are displayed (from full length cDNA # L.13689.1). Boxes and sites are drawn neither to scale nor to exact locations. Right, DU145 cells containing Luc flanked by control UTRs or BMI-1 5’ or 3’ UTR regions were treated for 24 hrs with 2μM C-209 and compared against untreated and DMSO controls. IRES-containing BMI-1 5‘UTR and 3‘UTR were shown to either inhibit or upregulate Luc expression, respectively (14). The 5‘UTR reduced Luc expression, while when combined with the 3‘UTR reversed the Luc expression enhancing effects of the 3‘UTR. Treatment with 2μM C-209 resulted in reduced Luc expression opposing the effects of the 3‘UTR. Data plotted represent six independent experiments. E, Percentage of inhibition of Luc reporter cells with either control (Cont.) vs. BMI-1 5‘ and 3‘UTR cells following C-209 (0.0195-20μM) treatments for 72hrs. F, Selective effects of C-209 on BMI-1 mRNA translation in cell-free extracts. Top, WB analysis of translated full-length BMI-1 RNA (complete cDNA including BMI-1 5‘ and 3‘UTRs) in in vitro transcription/translation (TNT) assays in eukaryotic cell-free rabbit reticulocytes. A cellular lysate in the left most lane was used as a positive control to determine the BMI-1 migrated band on the polyacrylamide gel at a position of ~37 KDa. Bottom, quantitation of normalized translated BMI-1 from BMI-1 cDNA pretreated or not with 2μM C-209 for one hour compared to control. G, BMI-1 expression in vector-transduced (Sh-Scr), BMI-1-overexpressing (EGFP-BMI-1) and BMI-1-depleted (shBMI-1) DU145 cells. H, Cell viability evaluated in vector-transduced (Sh-Scr), BMI-1-overexpressing (EGFP-BMI-1) and BMI-1-depleted (shBMI-1) DU145 cells following C-209 (0.0195-20μM) treatments for 72hrs.
Figure 4
Figure 4
Antitumor activities of C-209 against patient-derived TICs. A, BMI-1 expression levels assessed in normal (N) and tumoral (T) patient-derived samples before and after C-209 (2μM) treatment for 72hrs. Right panel. Quantitation of BMI-1 expression levels in normal (N) and tumoral (T) patient-derived cells after C-209 (2μM) treatment for 72hrs. B, Antitumor activity of C-209 in androgen-responsive LNCaP cells (orange), androgen-insensitive DU145 cells (red) and primary PCa cells (blue) (Patient#25854). Percentage of survival was evaluated by MTS assay. C, Representative cytofluorimetric analysis (left panel) and graphical plotting (right panel) of TIC modulation in primary patient-derived cells untreated and treated with C-209 (2μM) and docetaxel (2.5nM) for 72h (Patient#28869, #33020, #33072, #33120, #33106). D-F, Cell survival, clonogenicity and motility assessed on unselected primary PCa (#29084, #29092,#29110,#29663,#29834,#29990,#28869,#28864). Following treatments with DMSO, C-209 (2μM) or docetaxel (2.5nM) for 96hrs, cells were washed, counted and replated in fresh media to assess cell survival (assessed at 96h post cell wash), colony formation (assessed at 2-3 weeks post cell wash) and migration (24h post cell wash). Data are displayed as mean percentage ± S.D. Single independent experiments were performed with four to eight distinct patient-derived cells. *p <0.05, **p<0.01 and ***p<0.001.
Figure 5
Figure 5
Treatment effects of C-209 on zebrafish xenografts. A, Schematic illustration of the experimental procedure for the use of zebrafish PCa xenografts to identify small molecules targeting BMI-1 in vivo. B, Anti-tumor activity of C-209. Reduction in tumor size monitored with reduced QD fluorescence (blue arrows). C, Anti-tumor activity of C-209 (2μM) against xenografts derived from either parental cells (yellow) or the TIC fraction (orange) from three primary samples. The graph demonstrates responses to C-209 as a percentage of total treated xenografts (n=25 xenograft per cell fraction per patient). Zebrafish with established grafts were sorted before treatment. D, Evaluation of tumor area variation calculated as fluorescence intensity of untreated and treated xenografts with C-209 (2μM). Data are presented as mean value ± S.D. E, Tumorigenic capacity of primary PCa TICs in zebrafish xenografts. Cells, pre-treated with C-209 (2μM) or docetaxel (2.5nM), were washed after 4 days, plated in fresh media for 3 days and subsequently injected in equal number into adult zebrafish. Data are displayed as mean percentage ± S.D. from four distinct patients (#29663, #29834, #29084 and #29990). F, The graph displays the percentage ± S.D. of Ki67 positive cells in DMSO (control), C-209 (2μM) or docetaxel (2.5nM) treated-cells. G, Strategy employed to determine inhibition of tumor initiation potential of remaining treated cells in secondary xenografts. TICs of patient samples #40181, #26136, and #25854 were transplanted to generate primary xenografts (1°). Diagram on the right demonstrates primary graft take rates. Xenografts were treated (TRT) with either DMSO or C-209 at 2μM for 72 hours, tumor areas were dissected, pooled, and TICs were sorted and injected into secondary recipients. Treatment with C-209 significantly reduced the rates of secondary xenografts (2°). Scale bars are 250 μm in B and 50 μm in H.
Figure 6
Figure 6
In vivo pharmacological targeting of BMI-1 in mouse PCa xenografts. A, Strategy for examining the antitumor activity of C-209 in serial mouse xenografts and clonogenic repopulation assays of treated cells. B, Growth rate of mouse xenografts generated after subcutaneous (SC) injection of CD49bhiCD29hiCD44hi Luc2EGFP cells. Mice were randomized and administered daily with 60 mg/kg/day of C-209 for twelve days and docetaxel 6mg/kg once a week for two consecutive weeks. Results are mean ± S.D. of six independent experiments. Comparison of tumor volumes between the three groups was determined by two-way ANOVA with Bonferroni post-hoc test. Graph indicates significance of Docetaxel vs. Control at day 30 (**p<0.01) and C-209 vs. Control at day 30 (****p<0.0001). There was a trend towards significance (p=0.08) when comparing tumor volumes in xenograft treated with C-209 vs. Docetaxel at day 30 using Mann-Whitney U test. At the earlier days 20 and 25, Docetaxel was not significantly different than Control, while C-209 was; C-209 vs. Control at day 20 (*p<0.05); C-209 vs. Control at day 25 (**p<0.01). Red arrow indicates treatment discontinuation. In each experiment, n=8/group. C, Intratumor IHC revealed reduced nuclear BMI-1 (brown) and surface CD44 (red) staining upon treatment with C-209. Staining was performed on tumor xenografts taken at Day 30. D, Quantitation of Ki67 positive cells in sections from treated xenografts. (***p<0.001, *p<0.01). E, Colony-forming ability assay performed on freshly dissociated and EGFP sorted xenograft-cells. Average number of colonies/plate for each treatment mean ± S.D. of two independent experiments with 12 wells/condition is reported. *p<0.05, ***p<0.001. F, Tumor initiation potential in serial grafting in secondary mouse xenografts of cells dissociated from treated primary mouse xenografts (n=8 mice /group, *p<0.01). G, Cell proliferation of LNCaP and DU145 cells treated with C-209 (2μM), abiraterone (5μM), enzalutamide (5μM) and docetaxel (2.5nM) for 72 hrs. H, Cell survival of therapy-resistant cells. LNCaP and DU145 cells pre-treated with abiraterone (5μM), enzalutamide (5μM) and docetaxel (2.5nM) for 72 hrs were washed and remaining cells that survived treatments (therapy resistant cells) were treated with C-209 (2μM) for another 3 days. Results are indicated as ± S.D. of two independent experiments with *p<0.05, **p<0.01.

References

    1. Siegel RL, Miller KD, Jemal A. Cancer statistics, 2015. CA Cancer J Clin. 2015;65:5–29. - PubMed
    1. Attard G, Parker C, Eeles RA, Schroder F, Tomlins SA, Tannock I, et al. Prostate cancer. Lancet. 2016;387:70–82. - PubMed
    1. Collins AT, Berry PA, Hyde C, Stower MJ, Maitland NJ. Prospective identification of tumorigenic prostate cancer stem cells. Cancer Res. 2005;65:10946–51. - PubMed
    1. Goldstein AS, Lawson DA, Cheng D, Sun W, Garraway IP, Witte ON. Trop2 identifies a subpopulation of murine and human prostate basal cells with stem cell characteristics. Proc Natl Acad Sci U S A. 2008;105:20882–7. - PMC - PubMed
    1. Toivanen R, Berman DM, Wang H, Pedersen J, Frydenberg M, Meeker AK, et al. Brief report: a bioassay to identify primary human prostate cancer repopulating cells. Stem Cells. 2011;29:1310–4. - PubMed

MeSH terms