. 2016 Jun 15;32(12):i278-i287.
doi: 10.1093/bioinformatics/btw260.

Simultaneous prediction of enzyme orthologs from chemical transformation patterns for de novo metabolic pathway reconstruction

Affiliations

Simultaneous prediction of enzyme orthologs from chemical transformation patterns for de novo metabolic pathway reconstruction

Yasuo Tabei et al. Bioinformatics. .

Abstract

Motivation: Metabolic pathways are an important class of molecular networks consisting of compounds, enzymes and their interactions. The understanding of global metabolic pathways is extremely important for various applications in ecology and pharmacology. However, large parts of metabolic pathways remain unknown, and most organism-specific pathways contain many missing enzymes.

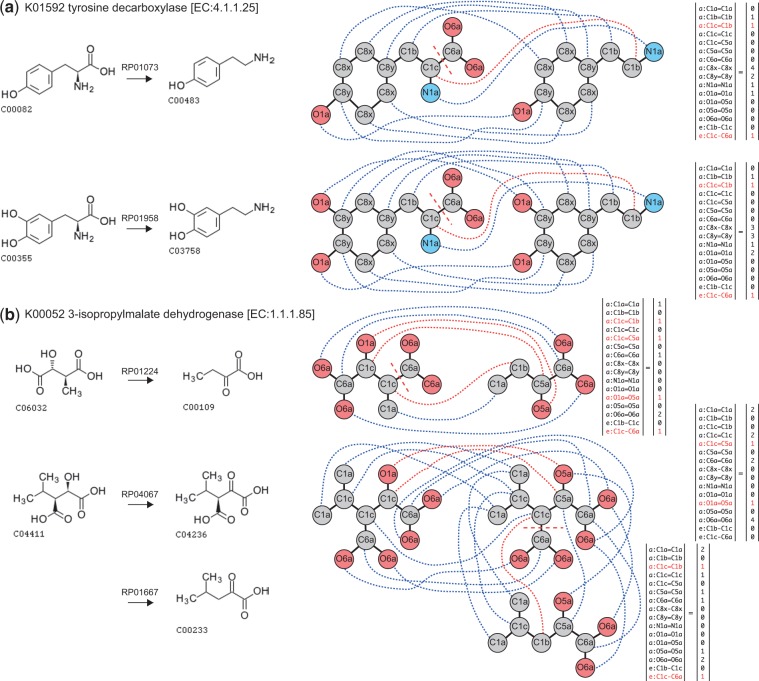
Results: In this study we propose a novel method to predict the enzyme orthologs that catalyze the putative reactions to facilitate the de novo reconstruction of metabolic pathways from metabolome-scale compound sets. The algorithm detects the chemical transformation patterns of substrate-product pairs using chemical graph alignments, and constructs a set of enzyme-specific classifiers to simultaneously predict all the enzyme orthologs that could catalyze the putative reactions of the substrate-product pairs in the joint learning framework. The originality of the method lies in its ability to make predictions for thousands of enzyme orthologs simultaneously, as well as its extraction of enzyme-specific chemical transformation patterns of substrate-product pairs. We demonstrate the usefulness of the proposed method by applying it to some ten thousands of metabolic compounds, and analyze the extracted chemical transformation patterns that provide insights into the characteristics and specificities of enzymes. The proposed method will open the door to both primary (central) and secondary metabolism in genomics research, increasing research productivity to tackle a wide variety of environmental and public health matters.

Contact: : maskot@bio.titech.ac.jp.


Figures

Fig. 1.
Fig. 1.
Possible approaches for metabolic pathway reconstruction. Nodes and edges indicate metabolites (chemical compounds) and reactions, respectively. Black nodes indicate compounds for which at least one reaction is known. White nodes indicate compounds for which chemical structures are identified but no reactions are known (referred to as ‘orphan metabolites’). Bold solid lines indicate well-characterized enzymatic reactions for which at least an enzyme is known. Dotted lines indicate putative reactions (previously unknown reactions) for which no enzymes are not known. (a) Known metabolic pathways are surrounded by many orphan metabolites. (b) Enzyme prediction by sequence homology is applicable to reactions with known enzymes. (c) Missing enzyme prediction is performed with gene/protein similarity based on gene co-expression and other omics data. (d) Enzyme prediction by chemical structures, which is the focus of this study, enables the de novo reconstruction of metabolic pathway by finding possible enzymes for putative reactions involving orphan metabolites
Fig. 2.
Fig. 2.
Evaluation of the ability of the baseline NN method and the proposed JL method to predict 2514 enzyme orthologs. The upper left and upper middle panels show index-plots of the AUC scores of NN and JL, respectively. The upper right panel shows a scatter-plot of the AUC scores between NN and JL. The bottom left and bottom middle panels show scatter-plots of the AUC scores against the degrees (the number of positive examples for each enzyme ortholog) for NN and JL, respectively. The bottom right panel shows a scatter-plot of the average AUC scores calculated on the same degrees between NN and JL
Fig. 3.
Fig. 3.
Examples of enzyme orthologs and known reactions with various AUC scores obtained while performing the five-fold cross-validation experiments
Fig. 4.
Fig. 4.
Examples of extracted features as enzyme-specific chemical transformation patterns. (a) The left panel shows two substrate–product pairs (RP01073 and RP01958) associated with enzyme ortholog K01592, tyrosine decarboxylase. (b) The left panel shows three substrate–product pairs (RP01224, RP04067 and RP01667) associated with enzyme ortholog K00052, 3-isopropylmalate dehydrogenase. In (a) and (b), the chemical graph alignments of the compounds are shown in the middle. Red dashed lines indicate the elimination of chemical bonds, red dotted lines indicate the atoms that change their labels (functional groups), and blue dotted lines indicate the atoms that are preserved during the reaction. The corresponding PACHA feature vectors are shown at the right. Features representing conserved chemical substructures are colored black and the features representing chemical changes are colored red
Fig. 5.
Fig. 5.
Examples of newly predicted associations between reactions and enzyme orthologs. Four predicted reactions are shown for (a) K01592 and (b) K00052, respectively. Known reactions catalyzed by (c) K01824 and (d) K00213 seem similar, and the predicted reactions for these enzyme orthologs K01824 and K00213 are the same, as shown in (e)
Fig. 6.
Fig. 6.
Distributions of the sequence similarity scores within the same, and between the different EC sub-subclasses. The first, second and third box-plots show the distributions of the sequence similarity scores of enzymes belonging to EC 4.1.1.25 and the ‘EC 4.1.1.*’ (enzymes within EC 4.1.1 but not EC 4.1.1.25), enzymes belonging to EC 1.1.1.85 and the ‘EC 1.1.1.*’ (enzymes within EC 1.1.1 but not EC 1.1.1.85), and enzymes belonging to EC 4.1.1.25 and EC 1.1.1.85, respectively. The fourth, fifth and sixth box-plots show the distributions of the sequence similarity scores of enzymes belonging to EC 5.3.3.5 and the ‘EC 5.3.3.*’ (enzymes within EC 5.3.3 but not EC 5.3.3.5), enzymes belonging to EC 1.3.1.21 and the ‘EC 1.3.1.*’ (enzymes within EC 1.3.1 but not EC 1.3.1.21), and enzymes belonging to EC 5.3.3.5 and EC 1.3.1.21, respectively

References

    1. Afendi F. et al. (2012) KNApSAcK family databases: integrated metabolite-plant species databases for multifaceted plant research Plant Cell Physiol., 53, e1.. - PubMed
    1. Colin P. et al. (2015) Ultrahigh-throughput discovery of promiscuous enzymes by picodroplet functional metagenomics. Nat. Commun., 6, 10008.. - PMC - PubMed
    1. Darvas F. (1988) Predicting metabolic pathways by logic programming. J. Mol. Graphics, 6, 80–86.
    1. Egelhofer V. et al. (2010) Automatic assignment of EC numbers. PLoS Comput. Biol., 6, e1000661.. - PMC - PubMed
    1. Ellis L. et al. (2008) The University of Minnesota pathway prediction system: predicting metabolic logic. Nucleic Acids Res., 36, W427–W432. - PMC - PubMed