. 2016 May 25:11:2329-43.
doi: 10.2147/IJN.S104119. eCollection 2016.

In vivo biodistribution, biocompatibility, and efficacy of sorafenib-loaded lipid-based nanosuspensions evaluated experimentally in cancer

Affiliations

In vivo biodistribution, biocompatibility, and efficacy of sorafenib-loaded lipid-based nanosuspensions evaluated experimentally in cancer

Shaomei Yang et al. Int J Nanomedicine. .

Abstract

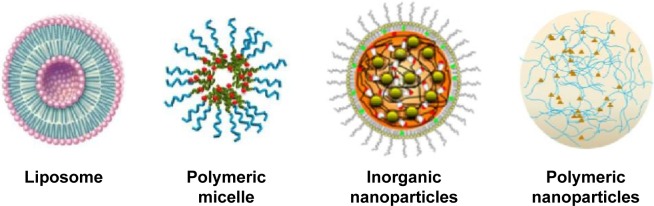
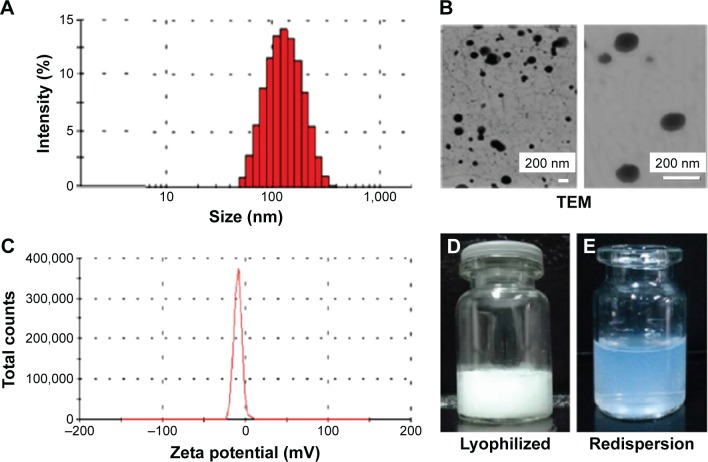
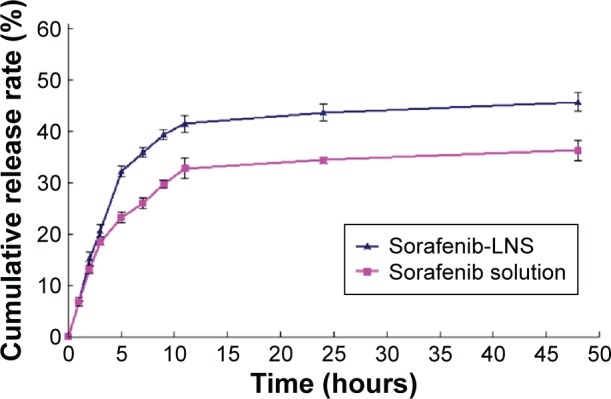
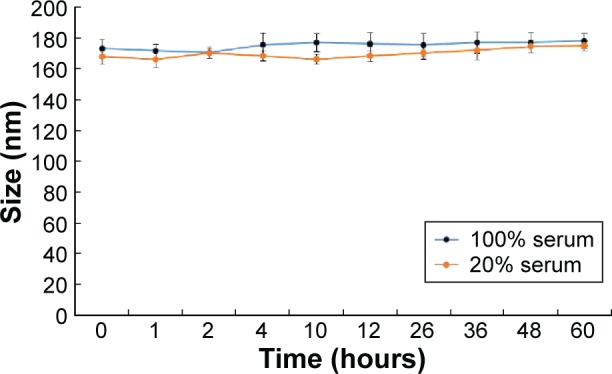
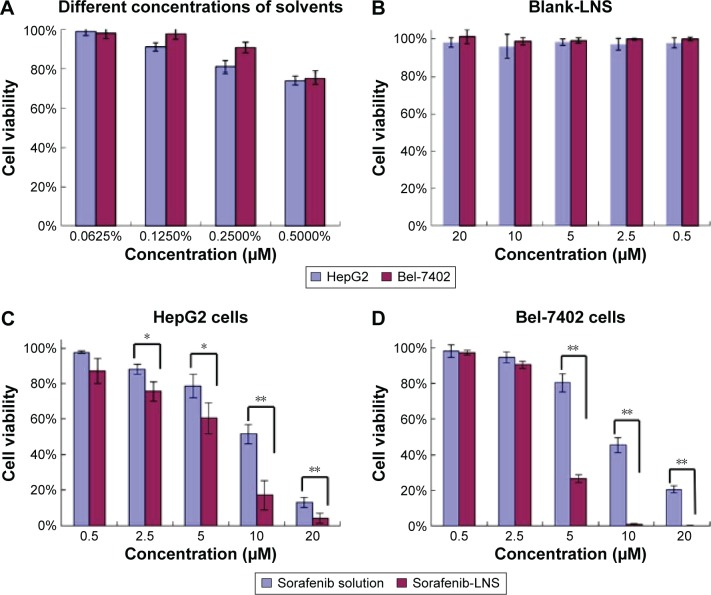
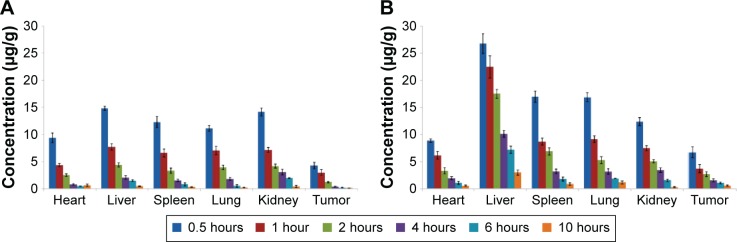
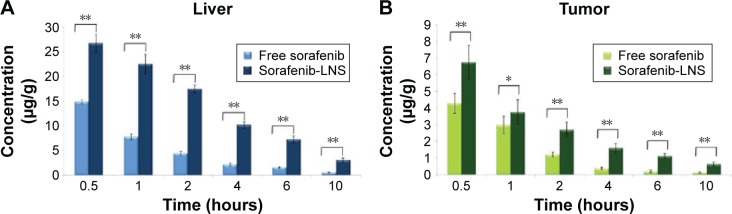
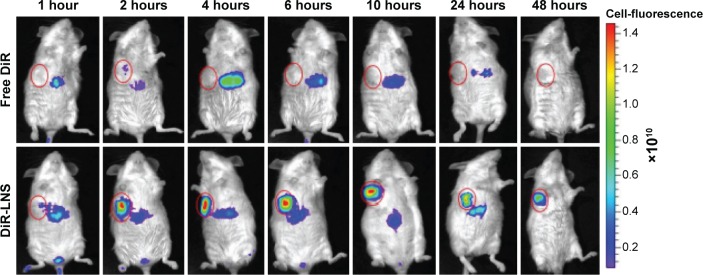
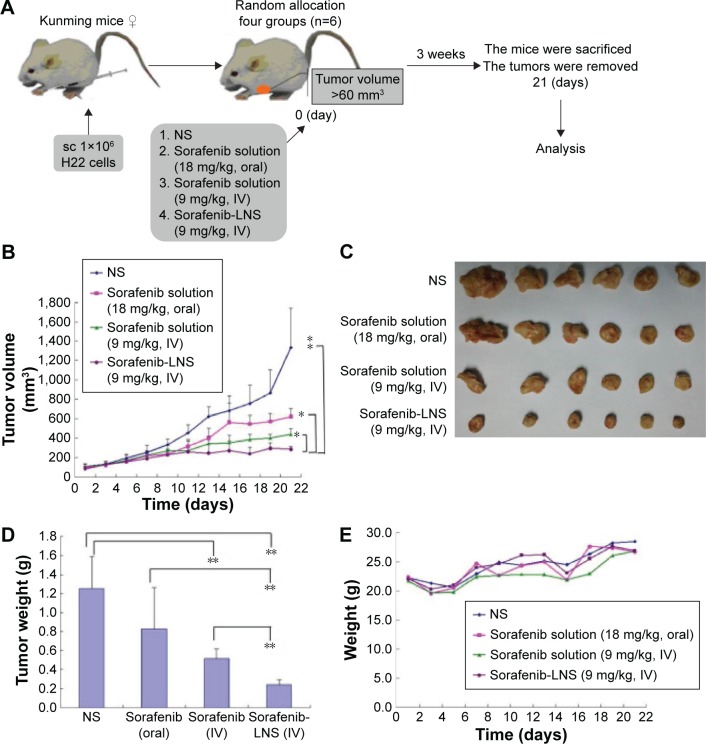
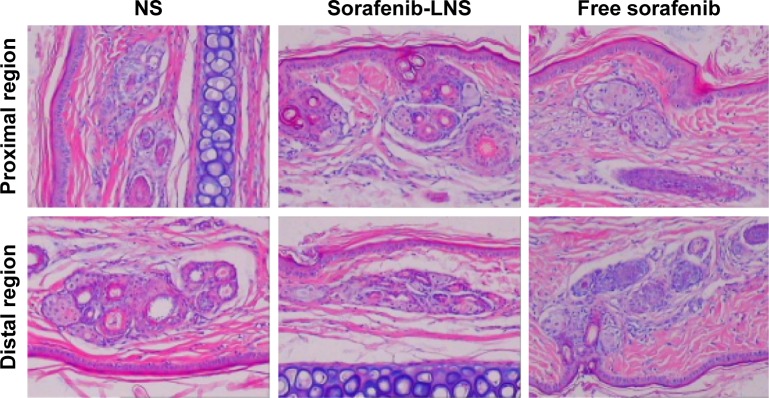
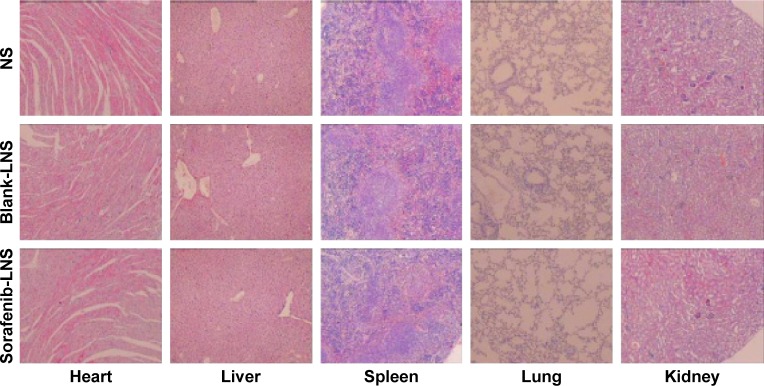
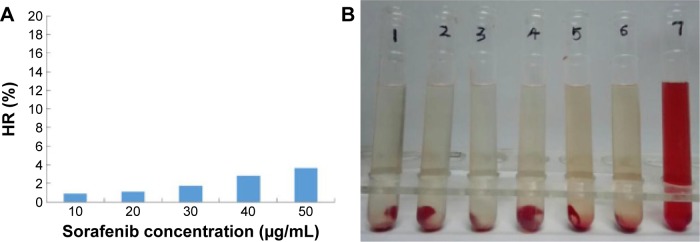
Hepatocellular carcinoma (HCC) is one of the most common malignant tumors worldwide. In this study, sorafenib-loaded lipid-based nanosuspensions (sorafenib-LNS) were first developed as an intravenous injectable formulation to increase the efficacy of sorafenib against HCC. LNS were used as nanocarriers for sorafenib owing to their desired features in increasing the solubility and dissolution velocity, improving the bioavailability of sorafenib. Sorafenib-LNS were prepared by nanoprecipitation and consisted of spherical particles with a uniform size distribution (164.5 nm, polydispersity index =0.202) and negative zeta potential (-11.0 mV). The drug loading (DL) was 10.55%±0.16%. Sorafenib-LNS showed higher in vitro cytotoxicity than sorafenib against HepG2 cells (P<0.05) and Bel-7402 cells (P<0.05). The in vivo biodistribution, biocompatibility, and antitumor efficacy of sorafenib-LNS were evaluated in H22-bearing liver cancer xenograft murine model. The results showed that sorafenib-LNS (9 mg/kg) exhibited significantly higher antitumor efficacy by reducing the tumor volume compared with the sorafenib oral group (18 mg/kg, P<0.05) and sorafenib injection group (9 mg/kg, P<0.05). Furthermore, the results of the in vivo biodistribution experiments demonstrated that sorafenib-LNS injected into H22 tumor-bearing mice exhibited increased accumulation in the tumor tissue, which was confirmed by in vivo imaging. In the current experimental conditions, sorafenib-LNS did not show significant toxicity both in vitro and in vivo. These results suggest that sorafenib-LNS are a promising nanomedicine for treating HCC.

Keywords: HCC; antitumor effect; distribution; lipid-based nanosuspensions; sorafenib.


Figures

Figure 1
Figure 1
Illustration of sorafenib-loaded nanomedicines.
Figure 2
Figure 2
Characterization of sorafenib-LNS. Notes: (A) Particle size and size distribution, (B) TEM images: level of magnification of the left image is 19,000×; the right image magnification is 70,000×; (C) zeta potential, (D) photograph of lyophilized sorafenib-LNS, and (E) photograph of lyophilized sorafenib-LNS after redispersion. Abbreviations: Sorafenib-LNS, sorafenib-loaded lipid-based nanosuspensions; TEM, transmission electron microscopy.
Figure 3
Figure 3
In vitro release profile of sorafenib in PBS (1.0% Tween-80, pH =7.4) at 37°C±0.5°C. Note: Data are mean ± SD (n=3). Abbreviations: PBS, phosphate-buffered saline; sorafenib-LNS, sorafenib-loaded lipid-based nanosuspensions.
Figure 4
Figure 4
Particle size changes of sorafenib-LNS incubated in 100% or 20% serum at 37°C for 60 hours. Abbreviation: Sorafenib-LNS, sorafenib-loaded lipid-based nanosuspensions.
Figure 5
Figure 5
Effects of different treatments on cell viabilities (percentage from untreated control) of HepG2 cells and Bel-7402 cells. Notes: (A) Effect of concentrations of solvents (Cremophor EL–ethanol, 1:1, v/v) on cell viabilities of HepG2 and Bel-7402 cells; (B) effect of blank-LNS on cell viabilities of HepG2 cells and Bel-7402 cells; (C) effect of sorafenib solution (Cremophor EL–ethanol, 1:1, v/v, diluted in PBS) or sorafenib-LNS on cell viabilities of HepG2 cells; and (D) effect of sorafenib solution (Cremophor EL–ethanol, 1:1, v/v, diluted in PBS) or sorafenib-LNS on cell viabilities of Bel-7402 cells. Data are presented as the mean ± SD (n=3). *P<0.05 and **P<0.01. Abbreviations: blank-LNS, blank lipid-based nanosuspensions; PBS, phosphate-buffered saline; sorafenib-LNS, sorafenib-loaded lipid-based nanosuspensions.
Figure 6
Figure 6
Mean tissue concentrations of sorafenib after a single IV injection in mice. Notes: (A) Mean tissue concentrations of sorafenib after a single IV injection of sorafenib solution (Cremophor EL–ethanol, 1:1, v/v, diluted with normal saline) in mice and (B) mean tissue concentrations of sorafenib after a single IV injection of sorafenib-LNS in mice. Data are presented as the mean ± SD (n=3). Abbreviations: IV, intravenous; sorafenib-LNS, sorafenib-loaded lipid-based nanosuspensions.
Figure 7
Figure 7
Distribution of sorafenib in liver and tumor tissues after IV administration of sorafenib or sorafenib-LNS to mice. Notes: (A) Distribution of sorafenib in liver after IV administration of sorafenib or sorafenib-LNS to mice and (B) distribution of sorafenib in tumor tissues after IV administration of sorafenib or sorafenib-LNS to mice. Data are presented as the mean ± SD (n=3). *P<0.05; **P<0.01. Abbreviations: IV, intravenous; sorafenib-LNS, sorafenib-loaded lipid-based nanosuspensions.
Figure 8
Figure 8
Real-time NIRF images of H22 tumor-bearing mice post-IV injection of free DiR and DiR-LNS. Notes: At 1 hour, 2 hours, 4 hours, 6 hours, 10 hours, 24 hours, and 48 hours postadministration, mice were anesthetized with 10% chloral hydrate (IP) and then placed on their back in a light-tight chamber. The real-time NIRF images were taken using the Xenogen IVIS Lumina system with an ICG filter (excitation at 745 nm and emission at 835 nm). The tumors are circled in red. Abbreviations: DiR, 1,1′-dioctadecyl-3,3,3′,3′-tetramethylindotricarbocyanine iodide; DiR-LNS, DiR-loaded lipid-based nanosuspensions; ICG, indocyanine green; IP, intraperitoneal; IV, intravenous; NIRF, near-infrared fluorophore.
Figure 9
Figure 9
Antitumor efficacy of sorafenib in different formulations in H22 tumor-bearing mice (n=5). Notes: (A) Schematic of in vivo pharmacodynamic experiments in Kunming mice implanted with H22 tumor cells; (B) time-dependent tumor growth profile of tumor-bearing mice administrated with NS, sorafenib solution (18 mg/kg, oral), sorafenib solution (9 mg/kg, IV), and sorafenib-LNS (9 mg/kg, IV); (C) excised tumor images after tumor therapy; (D) tumor weights after the administration of different formulations; and (E) body weight change after the administration of different formulations in H22 tumor-bearing mice. Data are presented as the mean ± SD (n=6). *P<0.05 and **P<0.01. Abbreviations: IV, intravenous; NS, normal saline; sorafenib-LNS, sorafenib-loaded lipid-based nanosuspensions; sc, subcutaneous injection.
Figure 10
Figure 10
Photomicrographs of pathological sections of rabbit ear-rim vein after different treatments. Notes: Two parts of the ear vein were obtained for histopathological examination, including the region 1 cm (proximal region) and 2 cm (distal region) from the pinprick. Magnification 100×. Abbreviations: NS, normal saline; sorafenib-LNS, sorafenib-loaded lipid-based nanosuspensions.
Figure 11
Figure 11
Representative microscopy images of H&E-stained histological sections after treatment with NS, blank-LNS, or sorafenib-LNS. Note: Magnification 40×. Abbreviations: blank-LNS, blank lipid-based nanosuspensions; H&E, hematoxylin and eosin; NS, normal saline; sorafenib-LNS, sorafenib-loaded lipid-based nanosuspensions.
Figure 12
Figure 12
In vitro hemolysis assay of sorafenib-LNS. Notes: (A) HR of the sorafenib-LNS at different sorafenib concentrations and (B) photograph of hemolysis samples for sorafenib-LNS. Sample 1: negative control (NS); Samples 2–6: five different concentrations of sorafenib-LNS from low to high; and Sample 7: positive control. Abbreviations: HR, hemolysis ratio; NS, normal saline; sorafenib-LNS, sorafenib-loaded lipid-based nanosuspensions.

References

    1. Forner A, Llovet JM, Bruix J. Hepatocellular carcinoma. Lancet. 2012;379(9822):1245–1255. - PubMed
    1. Huynh H. Molecularly targeted therapy in hepatocellular carcinoma. Biochem Pharmacol. 2010;80(5):550–560. - PubMed
    1. Bertino G. Hepatocellular carcinoma: present and future. Chin Clin Oncol. 2012;1(1):14. - PubMed
    1. DiFrancesco C [webpage on the Internet] FDA Approves Nexavar for Patients with Inoperable Liver Cancer. 2007. [Accessed April 14, 2016]. Available from: http://www.fda.gov/NewsEvents/Newsroom/PressAnnouncements/2007/ucm109030....
    1. Benson AB, 3rd, Abrams TA, Ben-Josef E, et al. NCCN clinical practice guidelines in oncology: hepatobiliary cancers. J Natl Compr Canc Netw. 2009;7(4):350–391. - PMC - PubMed

MeSH terms