

Development of quantitative mass spectrometric immunoassay for serum amyloid A
- PMID: 27308834
- PMCID: PMC5253327
- DOI: 10.1080/1354750X.2016.1201533
Development of quantitative mass spectrometric immunoassay for serum amyloid A
Abstract
Objective: Proteins can exist as multiple proteoforms in vivo that can have important roles in physiological and pathological states.
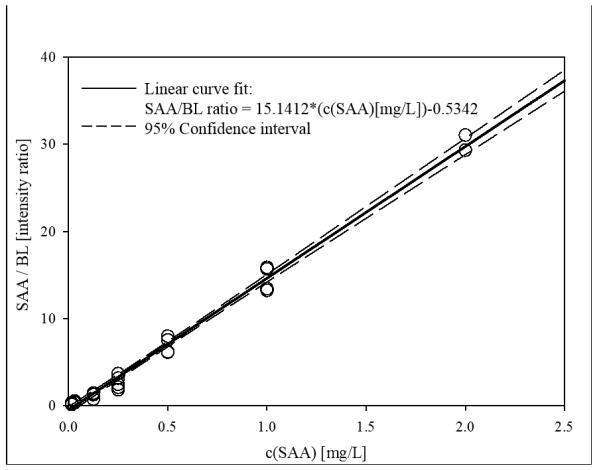
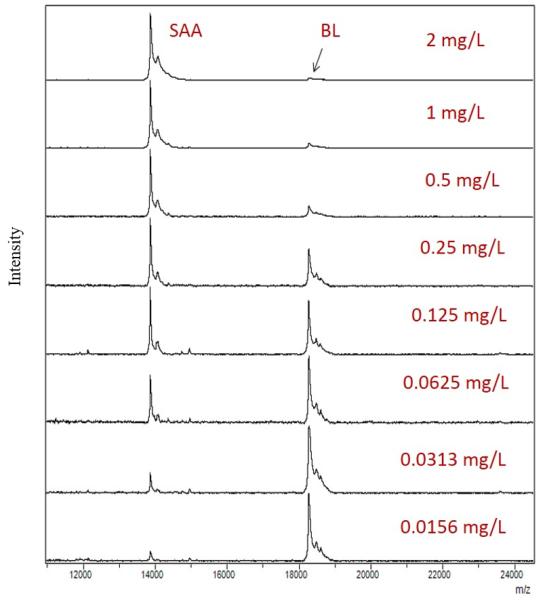
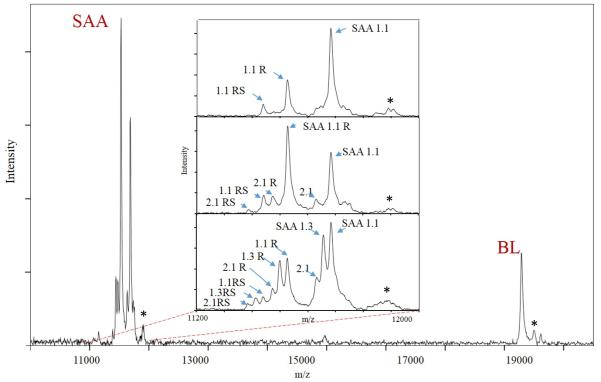
Methods: We present the development and characterization of mass spectrometric immunoassay (MSIA) for quantitative determination of serum amyloid A (SAA) proteoforms.
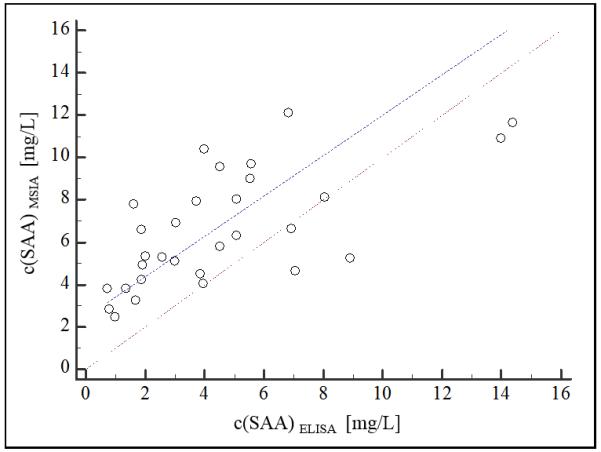
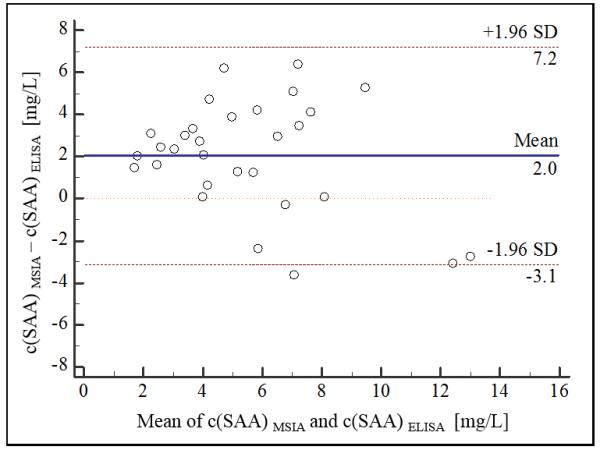
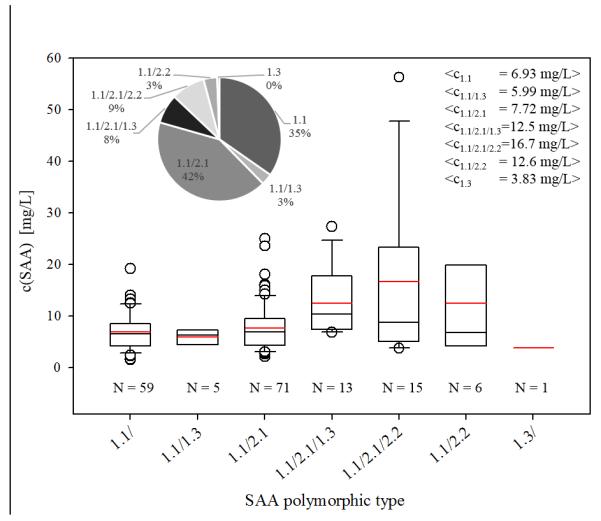
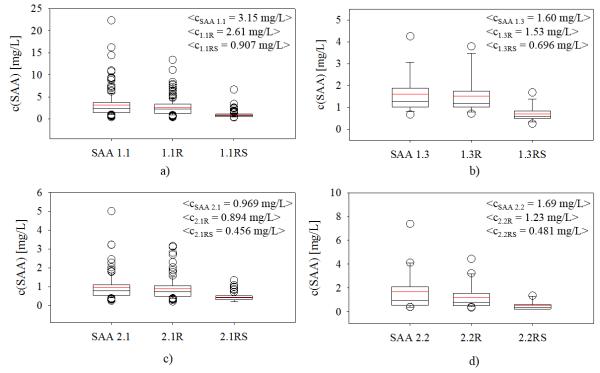
Results: Intra- and inter-day precision revealed CVs <10%. Against existing SAA ELISA, the developed MSIA showed good correlation according to the Altman-Bland plot. Individual concentrations of the SAA proteoforms across a cohort of 170 samples revealed 7 diverse SAA polymorphic types and 12 different proteoforms.
Conclusion: The new SAA MSIA enables parallel analysis of SAA polymorphisms and quantification of all expressed SAA proteoforms, in a high-throughput and time-efficient manner.
Keywords: Baseline concentration; inflammation biomarker; mass spectrometry; polymorphism; posttranslational modifications; proteoforms.
Figures
Similar articles
-
Quantitative mass spectrometric immunoassay for the chemokine RANTES and its variants.J Proteomics. 2015 Feb 26;116:15-23. doi: 10.1016/j.jprot.2014.12.011. Epub 2014 Dec 27. J Proteomics. 2015. PMID: 25549571 Free PMC article.
-
Mass Spectrometric Immunoassay for the qualitative and quantitative analysis of the cytokine Macrophage Migration Inhibitory Factor (MIF).Proteome Sci. 2014 Oct 14;12(1):52. doi: 10.1186/s12953-014-0052-3. eCollection 2014. Proteome Sci. 2014. PMID: 25328446 Free PMC article.
-
Parallel workflow for high-throughput (>1,000 samples/day) quantitative analysis of human insulin-like growth factor 1 using mass spectrometric immunoassay.PLoS One. 2014 Mar 24;9(3):e92801. doi: 10.1371/journal.pone.0092801. eCollection 2014. PLoS One. 2014. PMID: 24664114 Free PMC article. Clinical Trial.
-
Mass Spectrometric Immunoassays in Characterization of Clinically Significant Proteoforms.Proteomes. 2016 Mar 17;4(1):13. doi: 10.3390/proteomes4010013. Proteomes. 2016. PMID: 28248223 Free PMC article. Review.
-
Mass spectrometric immunoassays for discovery, screening and quantification of clinically relevant proteoforms.Bioanalysis. 2016 Aug;8(15):1623-1633. doi: 10.4155/bio-2016-0060. Epub 2016 Jul 11. Bioanalysis. 2016. PMID: 27396364 Free PMC article. Review.
Cited by
-
The Human Proteoform Atlas: a FAIR community resource for experimentally derived proteoforms.Nucleic Acids Res. 2022 Jan 7;50(D1):D526-D533. doi: 10.1093/nar/gkab1086. Nucleic Acids Res. 2022. PMID: 34986596 Free PMC article.
-
Electrospun Nanofibers including Organic/Inorganic Nanohybrids: Polystyrene- and Clay-Based Architectures in Immunosensor Preparation for Serum Amyloid A.Biosensors (Basel). 2023 Jun 23;13(7):673. doi: 10.3390/bios13070673. Biosensors (Basel). 2023. PMID: 37504072 Free PMC article.
-
Comparative analysis of inflammatory biomarkers for the diagnosis of neonatal sepsis: IL-6, IL-8, SAA, CRP, and PCT.Open Life Sci. 2025 Jan 28;20(1):20221005. doi: 10.1515/biol-2022-1005. eCollection 2025. Open Life Sci. 2025. PMID: 39886481 Free PMC article.
-
Mass Spectrometric Studies of Apolipoprotein Proteoforms and Their Role in Lipid Metabolism and Type 2 Diabetes.Proteomes. 2017 Oct 15;5(4):27. doi: 10.3390/proteomes5040027. Proteomes. 2017. PMID: 29036931 Free PMC article. Review.
-
Molecular and translational biology of the blood-based VeriStrat® proteomic test used in cancer immunotherapy treatment guidance.J Mass Spectrom Adv Clin Lab. 2023 Nov 20;30:51-60. doi: 10.1016/j.jmsacl.2023.11.001. eCollection 2023 Nov. J Mass Spectrom Adv Clin Lab. 2023. PMID: 38074293 Free PMC article.
References
-
- ALDO-BENSON MA, BENSON MD. SAA suppression of immune response in vitro: evidence for an effect on T cell-macrophage interaction. J Immunol. 1982;128:2390–2. - PubMed
-
- ANDERSSON LO. Pharmacology of apolipoprotein A-I. Curr Opin Lipidol. 1997;8:225–8. - PubMed
-
- ARTL A, MARSCHE G, LESTAVEL S, SATTLER W, MALLE E. Role of serum amyloid A during metabolism of acute-phase HDL by macrophages. Arterioscler Thromb Vasc Biol. 2000;20:763–72. - PubMed
-
- BABA S, MASAGO SA, TAKAHASHI T, KASAMA T, SUGIMURA H, TSUGANE S, TSUTSUI Y, SHIRASAWA H. A novel allelic variant of serum amyloid A, SAA1 gamma: genomic evidence, evolution, frequency, and implication as a risk factor for reactive systemic AA-amyloidosis. Hum Mol Genet. 1995;4:1083–7. - PubMed
Grants and funding
LinkOut - more resources
Full Text Sources
Other Literature Sources
Research Materials