. 2016 Jun 23;534(7608):500-5.
doi: 10.1038/nature18270. Epub 2016 Jun 15.

Defining the consequences of genetic variation on a proteome-wide scale

Affiliations

Defining the consequences of genetic variation on a proteome-wide scale

Joel M Chick et al. Nature. .

Erratum in

Abstract

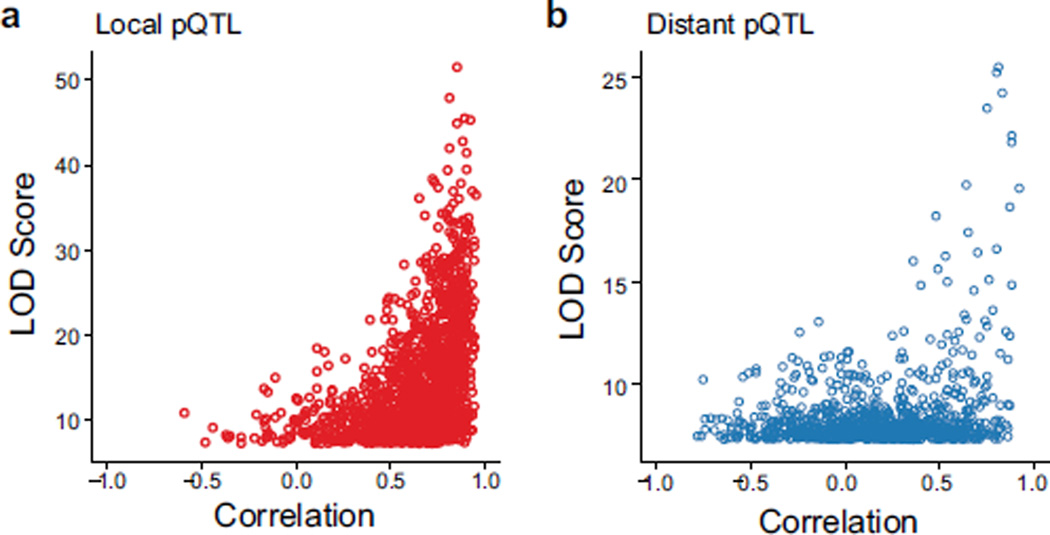
Genetic variation modulates protein expression through both transcriptional and post-transcriptional mechanisms. To characterize the consequences of natural genetic diversity on the proteome, here we combine a multiplexed, mass spectrometry-based method for protein quantification with an emerging outbred mouse model containing extensive genetic variation from eight inbred founder strains. By measuring genome-wide transcript and protein expression in livers from 192 Diversity outbred mice, we identify 2,866 protein quantitative trait loci (pQTL) with twice as many local as distant genetic variants. These data support distinct transcriptional and post-transcriptional models underlying the observed pQTL effects. Using a sensitive approach to mediation analysis, we often identified a second protein or transcript as the causal mediator of distant pQTL. Our analysis reveals an extensive network of direct protein-protein interactions. Finally, we show that local genotype can provide accurate predictions of protein abundance in an independent cohort of collaborative cross mice.


Figures

Extended Data Figure 1
Extended Data Figure 1. Proteomic profiling of the eight founder strains used to create the DO mouse population
a, A multiplexed TMT proteomics method was used to characterize protein expression for the eight founder strains with two biological replicates for each strain using both sexes. In total, just over 400,000 peptides were quantified corresponding to 7,699 proteins. b, Hierarchical clustering and principal component analysis determined that the major source of variation in protein expression is due to genetic variation among the eight strains and the sex within strains. c, K-means clustering and gene set enrichment determined that each of the clusters was specifically enriched for metabolic pathways, biological process or cellular components. d, Proteins representing each of the displayed clusters from c. These proteins have specific patterns of expression as exemplified by PCK1, which was highly expressed in the NOD strain. Other examples include SCD1, which was highly expressed in C57BL/6J and NZO strains (n = 4 mice for each founder, 2 male and 2 female, black bars represent median values). Protein abundance is shown as the percentage contribution of that mouse’s protein levels to its respective 10-plex.
Extended Data Figure 2
Extended Data Figure 2. The influence of sex and diet on protein and transcript abundance
a, Principal component analysis aligns well with sex and diet as major experimental contributors of variation in protein abundance. b, Female-specific protein abundance profiles for SULT2A1 and FMO3. c, Male-specific protein abundance profiles for CYP4A12A and MUP3. d, e, Diet also resulted in the regulation of many proteins, which are represented by proteins such as SCD1 and ACACA that increased in abundance and proteins such as HMGCR and SQLE that decreased in abundance. f, Principal component analysis aligns well with sex and diet as major experimental contributors of variation in transcript abundance. g–j. Transcript scatter plots for the proteins in b–e. Transcript abundance data were transformed to rank normal scores for plotting.
Extended Data Figure 3
Extended Data Figure 3. Genetic effects drive much of the observed expression variance in the RNA-seq and proteomics data
Liver transcript and protein abundance are highly variable in the DO population. Among the discovery set (n = 6,707 proteins, 6,647 genes), much of this variance can be attributed to one or more experimental variables and/or genetic effects. a–c, The experimental covariates sex and diet influence many transcripts and proteins in an additive manner, however, the interaction of sex and diet does not seem to affect many genes. The effects from sex and diet are not biased towards one molecular species—that is, similar numbers of transcripts and proteins are similarly affected by these experimental variables. Genetic variation underlies many of the most variable transcripts and proteins. d, e, Local genetic variation in particular is a strong driver of expression variation for many genes, while distant genetic effects are observed but more subtle. Among the discovery set, we observe more and larger genetic effects (both local and distant) on transcript abundance than protein abundance. f, For most transcripts and proteins detected in this study, expression variation is minimal, cannot be attributed to a known experimental or genetic variable, and is plotted as noise. g, pQTL map for all 6,707 proteins tested from genetic linkage analysis. h, i, QTL mapping identified the genetic loci that underlie variability in transcript abundance (eQTL). For the discovery set of transcripts with detected proteins and the larger set of all expressed genes, the location of the eQTL is plotted on the x axis and the location of the controlled gene is plotted on the y axis. Most genetic effects are local and map to the same location as the gene, as evidenced by the prominent diagonal line in both maps.
Extended Data Figure 4
Extended Data Figure 4. Replication rates for eQTL are highly correlated with effect size, and local eQTL replicate at higher rates than distant eQTL
a, To assess replication of eQTL, an independent set of 192 DO liver RNA-seq samples was analysed (‘replication set’) and compared to the discovery set. A total of 16,839 genes were expressed in half or more samples in both data sets. For each gene, the most significant proximal locus (within ± 10 Mb of gene) and distant locus (located on a different chromosome from the gene) were identified from the discovery set—LOD scores at these loci are plotted on the x axis (local in red; distant in blue). Next, the most significant loci within a 10-Mb window flanking the local and distant loci from the discovery set were identified in the replication set and plotted on the y axis. LOD scores are highly correlated at these peak loci (local Pearson r = 0.91; distant r = 0.84). b, For the core set of 6,707 proteins (6,647 gene ids), pQTL and eQTL overlap were compared at multiple genome-wide P value thresholds from 0.01 to 0.2. Again, one maximum proximal locus and one maximum distant locus were identified for each gene/protein, and recorded if it met the P value cut off. Local pQTL exhibit high overlap with both the discovery eQTL set and replication eQTL set, regardless of P value threshold (67–80%). Distant pQTL exhibit slightly higher overlap with eQTL at the most stringent P value cut off, however, overlap is consistently low for distant pQTL (<1–2%). Local eQTL overlap well with the replication eQTL set regardless of P value threshold (75–77%). Distant eQTL replicate poorly overall (3–31%), but overlap rate is highest (31%) at the most stringent P value threshold, suggesting that larger sample sizes will be required to fully and accurately characterize distant effects on gene expression. c, The maximum proximal locus and distant locus were identified for each of the 6,707 proteins and transcripts, and the cumulative distribution of their LOD scores is plotted (blue = proteins, green = transcripts). LOD score is plotted on the x axis, and the proportion of total QTL is plotted on the y axis. Local eQTL as a group exhibit higher LOD scores (consistent with higher effect sizes) than local pQTL (ninetieth percentile LOD = 23.9 for local eQTL, 13.6 for pQTL), while distant eQTL and pQTL are of similar scale (ninetieth percentile LOD = 7.9 for distant eQTL, 8.2 for distant pQTL). d, Comparison of pQTL from the discovery set to eQTL from the discovery set (left set of Venn diagrams) and eQTL from the replication set (right). As expected given that they derive from the same samples, local pQTL and eQTL overlap is observed to be higher in the discovery set (1,392 out of 1,736 = 80%), however, local pQTL still overlap well with eQTL from the replication set (1,273 out of 1,736 = 73%). Distant pQTL overlap poorly with both eQTL sets (9 out of 1,048 in discovery set); 8 out of 1,048 in replication set), however, 6 of 9 distant pQTL that do overlap with eQTL in the discovery set are also identified as overlapping in the replication set.
Extended Data Figure 5
Extended Data Figure 5. BIC model selection reveals transcriptional mechanisms driving most local pQTL and post-transcriptional mechanisms underlying most distant pQTL
We identified the local and distant QTL with the maximum LOD score (regardless of significance) for each of the 6,707 proteins, and used BIC to assess eight models linking QTL genotype to transcript and protein abundance. Most proteins are not affected by the local or distant QTL, and fall in one of the three groups below outlined by the dotted line. Among the five models where a QTL effect on protein abundance is detected, two are transcriptional in nature (L1, L2; D1, D2); the QTL effect on protein abundance is conferred at least partially through the transcript. The remaining three genetic models are post-transcriptional (L3–5; D3–5); the QTL effect on protein abundance is not mediated through the transcript. The transcriptional L1 and L2 models are identified as the best models for most local pQTL, while the post-transcriptional D3 and D4 models are optimal for most distant pQTL.
Extended Data Figure 6
Extended Data Figure 6. Examples of local pQTL that are due to an underlying eQTL and those that are due to post-transcriptional mechanisms
a, The protein DHTKD1 contained a local acting eQTL and pQTL, which was associated with increased transcript and protein abundance derived from 129S1/SvImJ, CAST/EiJ, PWK/PhJ and WSB/EiJ strains. Mice were divided into three groups depending on whether or not their genomes contained 0, 1 or 2 of the alleles found to be associated with the pQTL. These increases in protein abundance were further validated using the proteomic analysis of the founder strains. b, c, Similarly, Ces2h and Pipox had both a local acting eQTL and pQTL that could be associated with specific strains (CAST/EiJ, PWK/PhJ and WSB/EiJ). These protein abundance measurements were further validated using the founder strains data set. d, e, Alternatively, 10% of the genes had local pQTL but lacked local eQTLs, which is evident in proteins such as ENTPD5 and OMA1. The founder allele expression patterns inferred at the pQTL were validated by protein abundance measurements in the founder strains, which could be explained CAST/EiJ specific missense mutations in both genes. f, Likewise, Lars2 also contained a pQTL that had no observable eQTL that showed a decrease in protein abundance in the 129S1/SvImJ, CAST/EiJ, PWK/PhJ and WSB/EiJ strains. Genome sequencing determined that these strains share four missense mutations (*P < 0.01 using a Student’s t-test; for founder strains, n = 4 mice for each founder, 2 male and 2 female, error bars represent s.d.).
Extended Data Figure 7
Extended Data Figure 7. The causal relationship between genetic variation and protein expression was determined for over 700 proteins as inferred by mediation analysis
a–d, Many of the causal relationships between proteins have been previously documented such as the associations between SNX7–SNX4, PGAM1–PGAM2, LRRFIP1–FLII and PPIF–PPIE. e–h, In addition, many of the protein associations had not be previously documented such as UPB1–MTR, FOC AD–AVEN, AGPAT9–CHP1 and ANXA1–ARAD1A. i–l, Protein associations were also identified for multimeric complexes such as ECSIT–NDUFAF1–TMEM126B, DMXL2–ROGDI–WDR7, PIGU–PIGT–PIGS and IKBKAP–ELP2–ELP3.
Extended Data Figure 8
Extended Data Figure 8. Mediation analysis for CCT complex members details the effects of a QTL in Cct6a on protein abundance through post-transcriptional protein buffering
a–f, Mediation analysis for each of the Cct complex identifies Cct6a as the causal intermediate. A local QTL for Cct6a affects transcript and protein abundance, and CC T6A abundance sets the abundance of other CC T proteins regardless of variation in their transcripts. For each of the complex members tested, all other complex members are confirmed to be co-regulated providing additional supporting evidence for stoichiometric buffering.
Extended Data Figure 9
Extended Data Figure 9. Distant pQTL and co-regulated proteins frequently correspond to complexes of physically interacting proteins
a, Distant pQTL and co-regulated proteins assemble to form a regulatory network, which is defined by protein clusters with distinct topologies. A total of 3,938 proteins/QTL are linked by 5,794 associations. Distant pQTL are depicted as purple arrows pointing from the inferred causal protein to its regulated pair. Co-regulated proteins are connected with green arrows emanating from the primary target protein. b, MCL clustering decomposes the distant pQTL network into 671 clusters. Cluster size varies considerably, although most clusters contain fewer than 20 proteins. c, Clusters extracted from the distant pQTL network frequently associate proteins with shared biological functions. More than half of clusters are enriched for at least one GO category, as depicted in the bar chart above. d–f, Three selected clusters of distant pQTL and co-regulated proteins. g, To understand the relationship between the distant pQTL associations and protein interactions, each distant pQTL and its co-regulated proteins were mapped to their human homologues in the BioPlex network of human protein interactions. To assess the tendency for these co-regulated proteins to cluster together, the median graph distance separating all pairs of co-regulated proteins was determined. The distribution of median distances observed for equal numbers of randomly selected proteins was also determined and used to assign a Z-score to each distant pQTL and its co-regulated proteins. h, Histogram depicting the Z-score distribution for distant pQTL and co-regulated proteins. Z-scores below −2.5 (highlighted in red) indicated that co-regulated proteins were unusually close within the BioPlex network. i–l, Selected distant pQTL and co-regulated proteins, mapped onto the BioPlex network of protein interactions. All shortest paths connecting distant pQTL and their regulated proteins have been extracted from the BioPlex network and displayed. Proteins inferred to be responsible for each QTL are purple, while primary regulated proteins are red and secondary co-regulated proteins are green. Grey circles represent neighbouring proteins in the BioPlex network that were not found to be co-regulated. Grey edges indicate BioPlex interactions, while Blue edges denote co-regulation uncovered from trans-QTL analysis.
Extended Data Figure 10
Extended Data Figure 10. Comparison of protein abundance in the DO and founder strains reveals a positive correlation between pQTL significance and predictive power
a, b, For all detected liver pQTL in the DO population, founder strain allelic contributions were derived from the mapping model and compared to protein abundance measured directly from the eight founder strains. Pearson correlations are plotted against the LOD score of the pQTL for both local and distant pQTL. Predictive power tracks well with pQTL significance. Local pQTL tend to be more significant and yield higher predictive power than distant pQTL, however highly significant distant pQTL (>10 LOD) have comparable predictive power to local pQTL of similar significance.
Figure 1
Figure 1. Tandem mass tag (TMT)-based liver proteomics in 192 DO mice
a, Overview of the breeding scheme to create the DO and CC mouse strains. b, Experimental overview of the genotyping, transcriptomics and proteomic analysis on 192 DO mouse livers from both sexes on a high-fat or chow diet.
Figure 2
Figure 2. Global view of the liver proteome reveals distinct genetic models of protein regulation
a, Venn diagram showing the distribution of transcripts and proteins broken down into local or distant QTL. b, Histograms of Pearson correlations for each gene’s protein and transcript measurements after segregating into four groups (eQTL–pQTL (purple), pQTL–no eQTL (blue), eQTL–no pQTL (green) and no QTL (grey)). c, Local and distant pQTL LOD scores after transcript measurements were used as a covariate in the regression model showing that local pQTL were mediated through their cognate transcripts unlike distant pQTL. d, Model selection by Bayesian information criterion (BIC). Local pQTL (QTLL) were mostly transcriptionally controlled, whereas distant pQTL (QTLD) were regulated generally by post-transcriptional mechanisms.
Figure 3
Figure 3. Examples of local pQTL that illustrate different models of regulation
a, DHTKD1 abundance is regulated by a local pQTL that probably acts proximally on transcript abundance. b, Dhtkd1 has a strong local eQTL (green) and local pQTL (blue), which corresponds to high correlation between transcript and protein abundance (inset; abundance data transformed to rank normal scores for comparison). c, The predicted founder strain abundance of DHTKD1 in the DO population mirrors the measured abundance of DHTKD1 in the founder strains (n = 4 mice for each founder, 2 male and 2 female, black bars represent median values). d, OMA1 follows a mode of regulation in which the pQTL acts directly on protein abundance without affecting transcript levels. e, OMA1 protein abundance is controlled by a strong local pQTL without a corresponding local eQTL, leading to low correlation (inset) observed between protein and transcript abundance. f, The predicted founder strain expression in the DO population is highly correlated to measured OMA1 abundance in the founder strains (n = 4 mice for each founder, 2 male and 2 female, black bars represent median values).
Figure 4
Figure 4. Mediation of distant pQTL reveals network interactions in the liver proteome
a, The genetic variant underlying the distant TMEM68 pQTL acts proximally in cis on Nnt transcript and protein abundance. b, TMEM68 protein abundance is buffered against local genetic variation affecting transcript levels by a distant regulator on chromosome 13. c, Mediation analysis identified NNT protein and Nnt transcript as the likely mediator. d, TMEM68 protein is poorly correlated to its corresponding transcript, but highly correlated with both NNT protein and Nnt transcript abundance. e, TMEM68 strain abundance predicted at the chromosome 13 distant pQTL in the DO population is highly correlated to TMEM68 and NNT abundance measured in the founder strains, and matches the predicted NNT strain abundance in the DO population (n = 4 mice for each founder, 2 male and 2 female, black bars represent median values). In all cases the C57BL/6J allele is observed to be the low expressor. f, The chromosome 5 variant responsible for the distant effect on CC T2 abundance acts proximally in cis on Cct6a transcript and protein abundance. g, All members of the chaperonin containing Tcp1 (CC T) complex including CC T2 exhibit a distant pQTL that maps to distal chromosome 5. h, Mediation analysis identified Cct6a/CC T6A as the probable mediator of this effect. Protein mediation shows that the protein abundance of all CC T complex members is highly correlated as all members are pulled down in the background of the mediation plot. i, CC T2 protein abundance is highly correlated to CC T6A protein and Cct6a transcript abundance. All other CC T complex members show this same pattern. j, CC T2 abundance predicted at the chromosome 5 distant pQTL is highly correlated with CC T2 and CC T6A abundance measured in the founder strains, and tracks with CC T6A abundance predicted at the pQTL in the DO population (n = 4 mice for each founder, 2 male and 2 female, black bars represent median values). DO animals that derive the chromosome 5 region from NOD/ShiLtJ have lower abundance of all CC T proteins.
Figure 5
Figure 5. Genotype can be an accurate predictor of protein abundance
a, Founder strain protein abundance values inferred at significant pQTL in the DO population closely match measured abundance values from the founder strains themselves. The distributions of Pearson correlations are plotted for local pQTL and distant pQTL. Local pQTL are generally more predictive of abundance values in the founder strains (local median r = 0.72, distant median r = 0.11). b, Founder strain allele predictions from the DO were also assessed against protein abundance data collected from four CC strains (n = 6 mice per strain). We observe that local pQTL are more predictive of protein abundance in the CC strains (local median r = 0.63; distant median r = 0.22). c, Predictive power depends largely on the significance of the pQTL. Local pQTL generally had higher LOD scores, and as such we had higher power to predict these proteins (n = 4 mice for each founder, 2 male and 2 female, black bars represent median values). An example is shown for LYPLAL1. d, Protein abundance could also be predicted for genes with significant distant pQTL in the DO population; however, as a group these predictions were modest compared to local pQTL. As an example, NAGS abundance in the CC strains could be predicted based on the local genotype at its mediator protein, GLYCTK (n = 6 mice for each CC strain, 3 male and 3 female, black bars represent median values).

References

    1. Crick F. Central dogma of molecular biology. Nature. 1970;227:561–563. - PubMed
    1. Gygi SP, Rochon Y, Franza BR, Aebersold R. Correlation between protein and mRNA abundance in yeast. Mol. Cell. Biol. 1999;19:1720–1730. - PMC - PubMed
    1. Schwanhäusser B, et al. Global quantification of mammalian gene expression control. Nature. 2011;473:337–342. - PubMed
    1. Ghazalpour A, et al. Comparative analysis of proteome and transcriptome variation in mouse. PLoS Genet. 2011;7:e1001393. - PMC - PubMed
    1. Skelly DA, et al. Integrative phenomics reveals insight into the structure of phenotypic diversity in budding yeast. Genome Res. 2013;23:1496–1504. - PMC - PubMed

Publication types