

The Impact of the Geometric Characteristics on the Hemodynamics in the Stenotic Coronary Artery
- PMID: 27310014
- PMCID: PMC4911169
- DOI: 10.1371/journal.pone.0157490
The Impact of the Geometric Characteristics on the Hemodynamics in the Stenotic Coronary Artery
Abstract
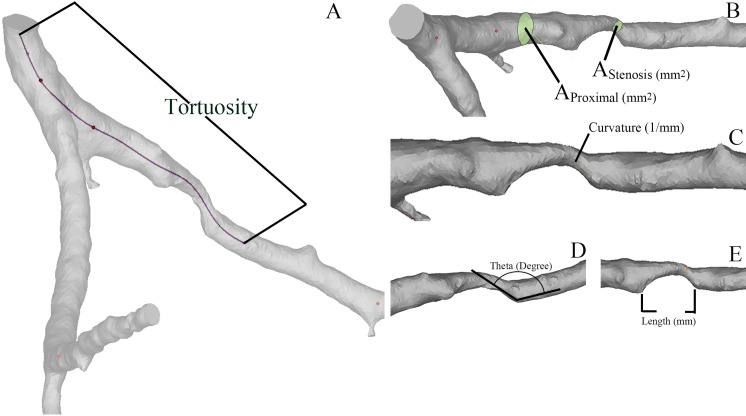
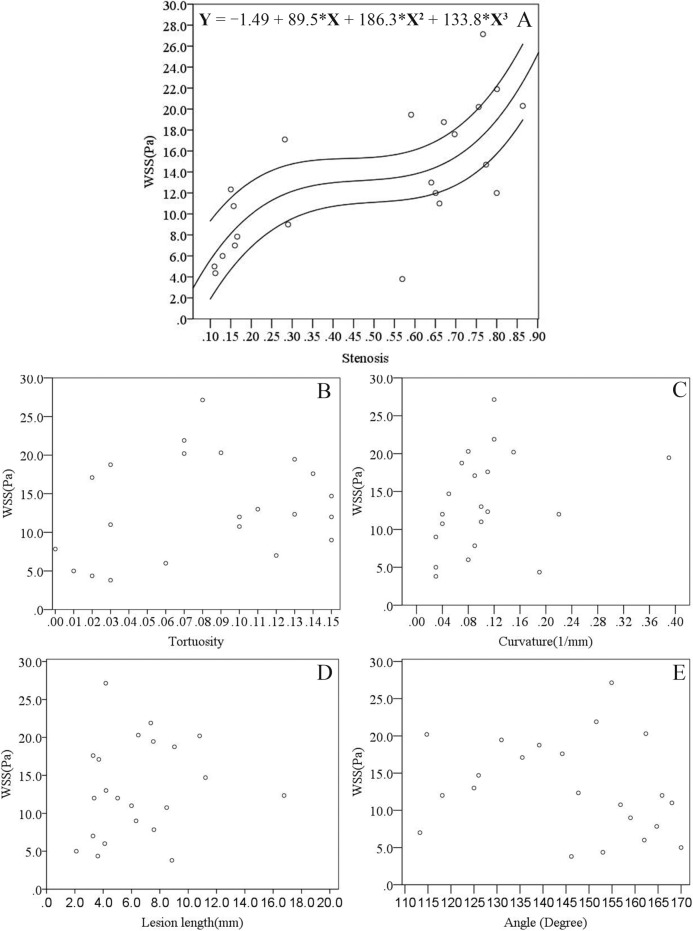
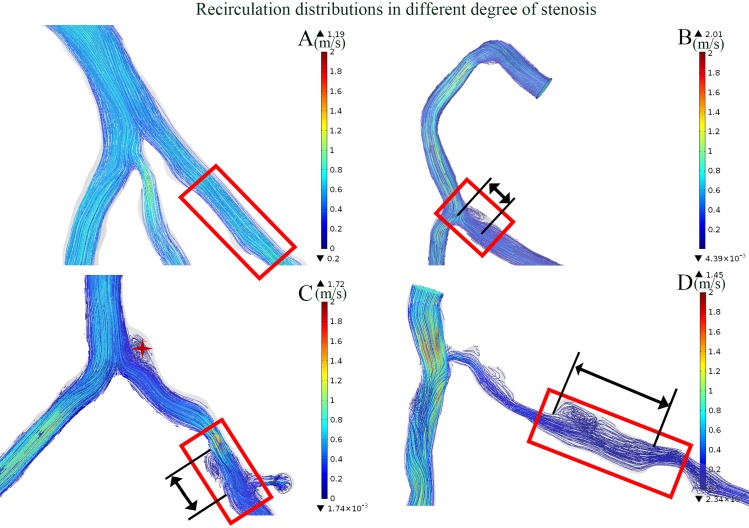
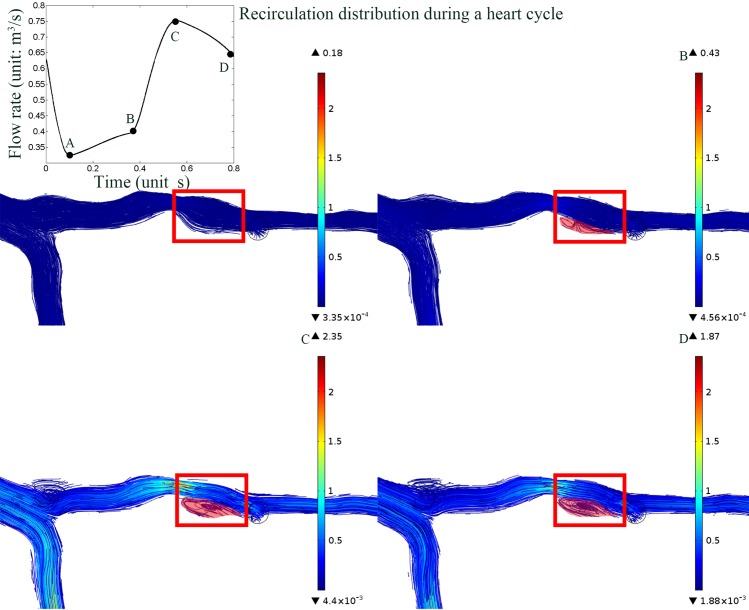
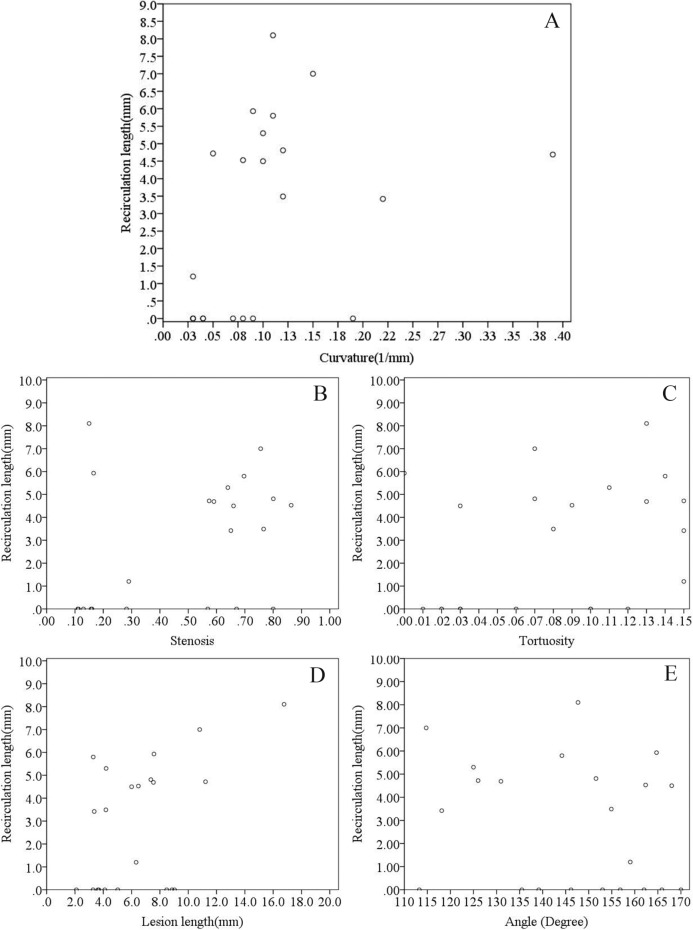
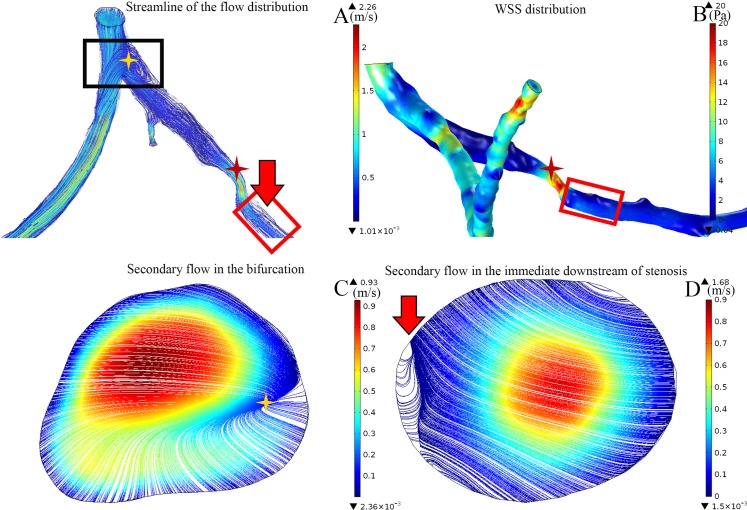
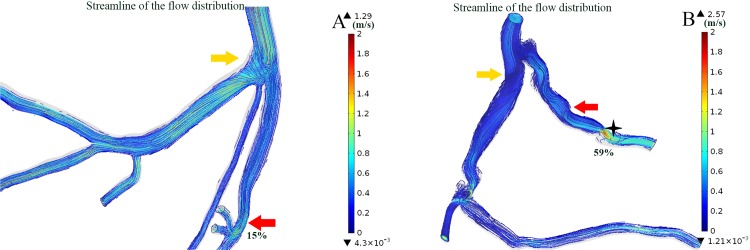
The alterations of the hemodynamics in the coronary arteries, which result from patient-specific geometric significances are complex. The effect of the stenosis on the blood flow alteration had been wildly reported, but the combinational contribution from geometric factors required a comprehensive investigation to provide patient-specific information for diagnosis and assisting in the decision on the further treatment strategies. In the present study, we investigated the correlation between hemodynamic parameters and individual geometric factors in the patient-specific coronary arteries. Computational fluid dynamic simulations were performed on 22 patient-specific 3-dimensional coronary artery models that were reconstructed based on computed tomography angiography images. Our results showed that the increasing severity of the stenosis is associated with the increased maximum wall shear stress at the stenosis region (r = 0.752, P < 0.001). In contrast, the length of the recirculation zone has a moderate association with the curvature of the lesion segment (r = 0.505, P = 0.019) and the length of the lesions (r = 0.527, P = 0.064). Moreover, bifurcation in the coronary arteries is significantly correlated with the occurrence of recirculation, whereas the severity of distal stenosis demonstrated an effect on the alteration of the flow in the upstream bifurcation. These findings could serve as an indication for treatment planning and assist in prognosis evaluation.
Conflict of interest statement
Figures
Similar articles
-
Fractional flow reserve-based 4D hemodynamic simulation of time-resolved blood flow in left anterior descending coronary artery.Clin Biomech (Bristol). 2019 Dec;70:164-169. doi: 10.1016/j.clinbiomech.2019.09.003. Epub 2019 Sep 10. Clin Biomech (Bristol). 2019. PMID: 31525657
-
Coronary Artery Axial Plaque Stress and its Relationship With Lesion Geometry: Application of Computational Fluid Dynamics to Coronary CT Angiography.JACC Cardiovasc Imaging. 2015 Oct;8(10):1156-1166. doi: 10.1016/j.jcmg.2015.04.024. Epub 2015 Sep 9. JACC Cardiovasc Imaging. 2015. PMID: 26363834
-
A patient-specific virtual stenotic model of the coronary artery to analyze the relationship between fractional flow reserve and wall shear stress.Int J Cardiol. 2016 Nov 1;222:799-805. doi: 10.1016/j.ijcard.2016.07.153. Epub 2016 Aug 3. Int J Cardiol. 2016. PMID: 27522378
-
Interpreting results of coronary computed tomography angiography-derived fractional flow reserve in clinical practice.J Cardiovasc Comput Tomogr. 2017 Sep-Oct;11(5):383-388. doi: 10.1016/j.jcct.2017.06.002. Epub 2017 Jun 23. J Cardiovasc Comput Tomogr. 2017. PMID: 28666784 Review.
-
Noninvasive FFR derived from coronary CT angiography in the management of coronary artery disease: technology and clinical update.Vasc Health Risk Manag. 2016 Jun 22;12:269-78. doi: 10.2147/VHRM.S79632. eCollection 2016. Vasc Health Risk Manag. 2016. PMID: 27382296 Free PMC article. Review.
Cited by
-
A new CFD based non-invasive method for functional diagnosis of coronary stenosis.Biomed Eng Online. 2018 Mar 22;17(1):36. doi: 10.1186/s12938-018-0468-6. Biomed Eng Online. 2018. PMID: 29566702 Free PMC article.
-
Relationship between Coronary Arterial Geometry and the Presence and Extend of Atherosclerotic Plaque Burden: A Review Discussing Methodology and Findings in the Era of Cardiac Computed Tomography Angiography.Diagnostics (Basel). 2022 Sep 9;12(9):2178. doi: 10.3390/diagnostics12092178. Diagnostics (Basel). 2022. PMID: 36140578 Free PMC article. Review.
-
Sensitivity of coronary hemodynamics to vascular structure variations in health and disease.Sci Rep. 2025 Jan 27;15(1):3325. doi: 10.1038/s41598-025-85781-x. Sci Rep. 2025. PMID: 39865100 Free PMC article.
-
A new understanding of coronary curvature and haemodynamic impact on the course of plaque onset and progression.R Soc Open Sci. 2024 Sep 11;11(9):241267. doi: 10.1098/rsos.241267. eCollection 2024 Sep. R Soc Open Sci. 2024. PMID: 39309260 Free PMC article.
-
Optimized vascular network by stereolithography for tissue engineered skin.Int J Bioprint. 2018 Apr 23;4(2):134. doi: 10.18063/IJB.v4i2.134. eCollection 2018. Int J Bioprint. 2018. PMID: 33102915 Free PMC article.
References
-
- Javadzadegan A, Yong ASC, Chang M, Ng ACC, Yiannikas J, Ng MKC, et al. Flow recirculation zone length and shear rate are differentially affected by stenosis severity in human coronary arteries. American Journal of Physiology—Heart and Circulatory Physiology, 2013; 304: H559–H566. 10.1152/ajpheart.00428.2012 - DOI - PubMed
-
- Morris PD, Ryan D, Morton AC, Lycett R, Lawford PV, Hose DR, et al. Virtual Fractional Flow Reserve From Coronary Angiography: Modeling the Significance of Coronary Lesions: Results From the VIRTU-1 (VIRTUal Fractional Flow Reserve From Coronary Angiography) Study. JACC: Cardiovascular Interventions, 2013; 6: 149–157. 10.1016/j.jcin.2012.08.024 - DOI - PubMed
-
- Rispler S, Keidar Z, Ghersin E, Roguin A, Soil A, Dragu R, et al. Integrated single-photon emission computed tomography and computed tomography coronary angiography for the assessment of hemodynamically significant coronary artery lesions. J Am Coll Cardiol 2007;49:1059–1067. - PubMed
-
- Abbara S, Arbab-Zadeh A, Callister TQ, Desai MY, Mamuya W, Thomson L, et al. SCCT guidelines for performance of coronary computed tomographic angiography: A report of the Society ofCardiovascular Computed Tomography Guidelines Committee. J Cardiovasc Comput Tomogr 2009; 3: 190–204. 10.1016/j.jcct.2009.03.004 - DOI - PubMed
MeSH terms
LinkOut - more resources
Full Text Sources
Other Literature Sources
